# The Sparkline Widget
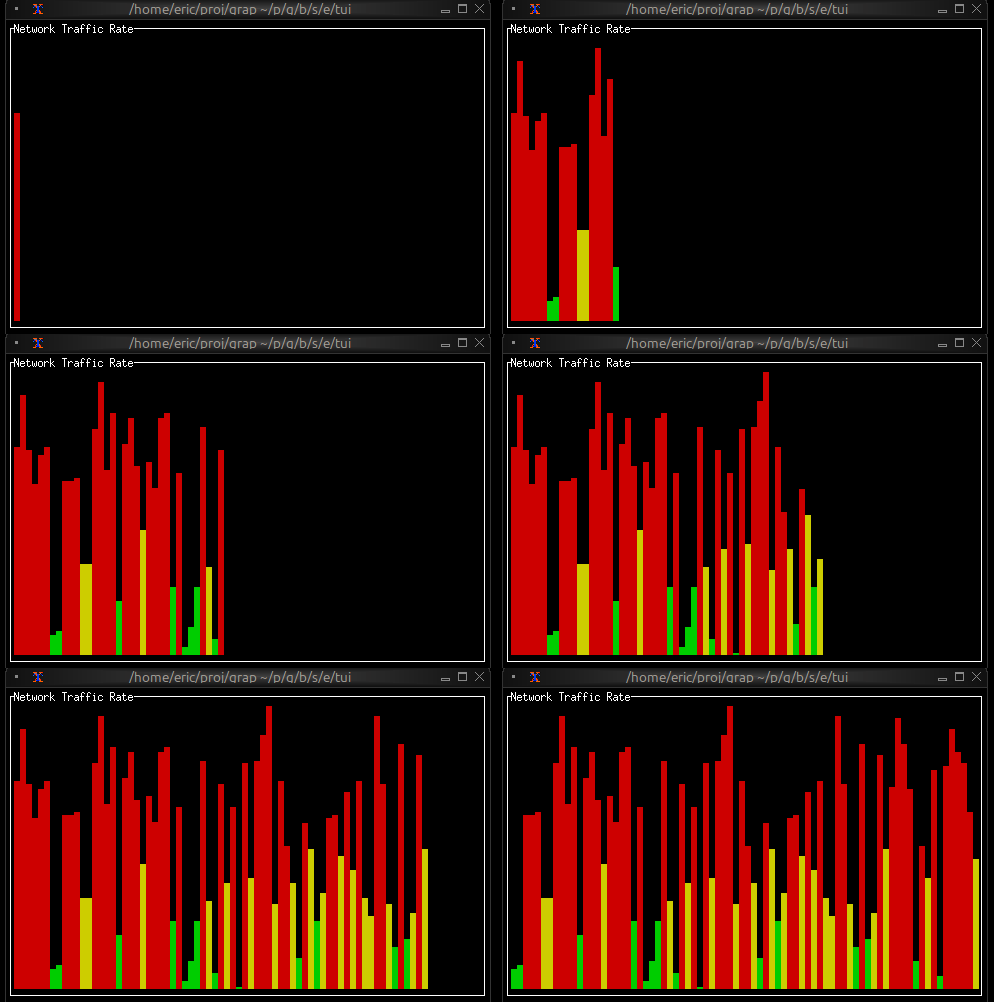
The `sparkline` widget renders compact inline charts perfect for dashboards and status displays. It shows data trends in minimal space, with support for color-coded bars based on thresholds.
## Interface
```graphix
type RenderDirection = [
`LeftToRight,
`RightToLeft
];
type SparklineBar = {
style: [Style, null],
value: [f64, null]
};
val sparkline_bar: fn(
?#style: [Style, null],
[f64, null]
) -> SparklineBar;
val sparkline: fn(
?#absent_value_style: &[Style, null],
?#absent_value_symbol: &[string, null],
?#direction: &[RenderDirection, null],
?#max: &[i64, null],
?#style: &[Style, null],
&Array<[SparklineBar, f64, null]>
) -> Tui;
```
## Parameters
### sparkline
- **max** - Maximum value for scaling (auto-scales if not specified)
- **style** - Default style for bars
- **direction** - `LeftToRight` (default) or `RightToLeft`
### sparkline_bar
- **style** - Style for this specific bar
## Examples
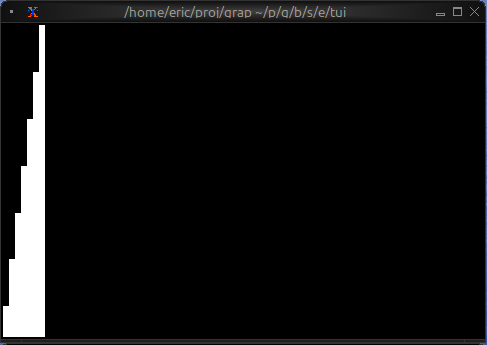
### Basic Usage
```graphix
{{#include ../../examples/tui/sparkline_basic.gx}}
```
### Threshold-based Coloring
```graphix
{{#include ../../examples/tui/sparkline_threshold.gx}}
```
### Multi-metric Dashboard
```graphix
{{#include ../../examples/tui/sparkline_dashboard.gx}}
```
### Sparkline from Netidx
```graphix
{{#include ../../examples/tui/sparkline_rolling.gx}}
```
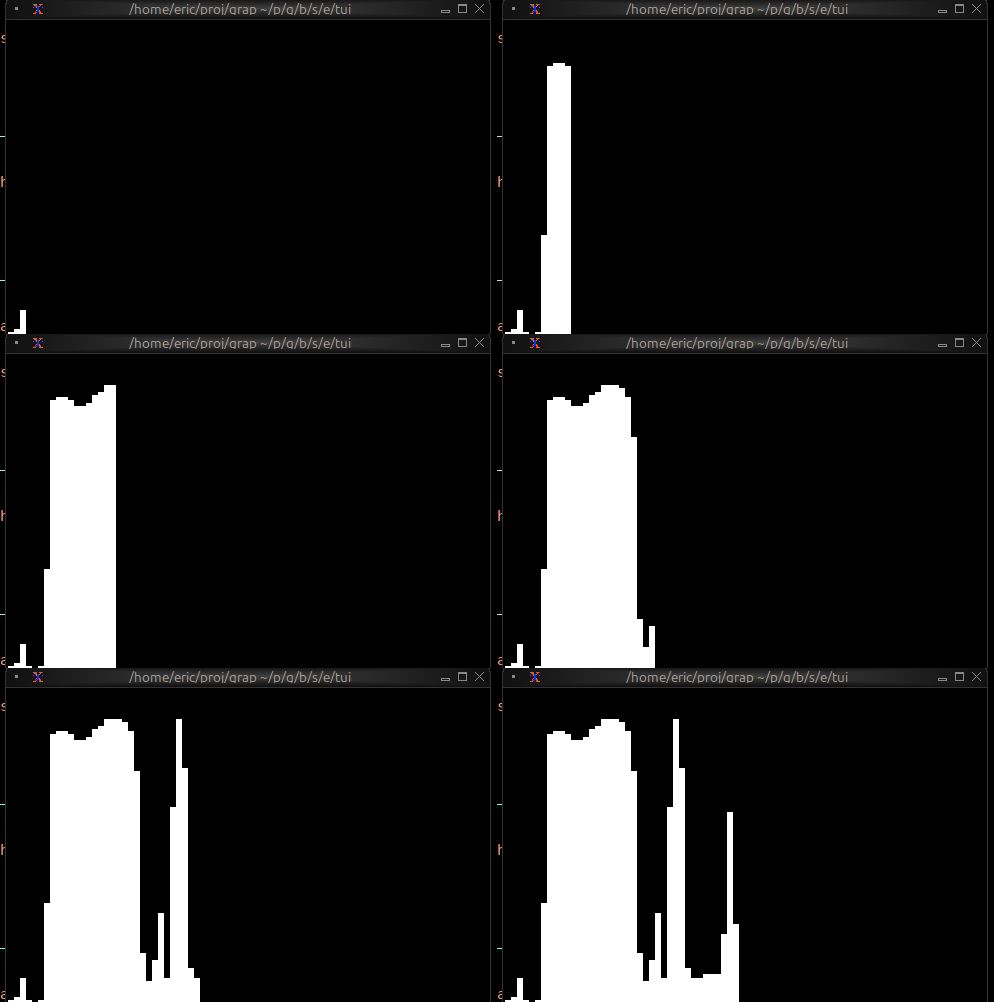
showing the output of the below shell pipeline during a netidx build,
```
awk '{ printf("/local/metrics/cpu|f64|%s\n", $6); fflush() }' | \
netidx publisher
```
## Use Cases
Sparklines are ideal for:
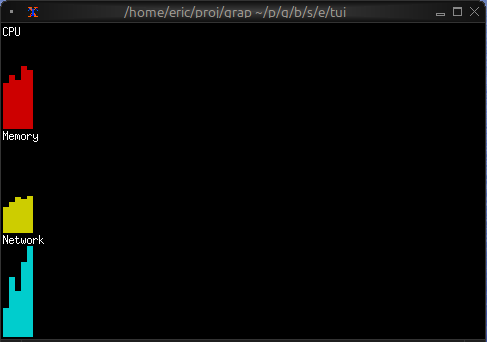
- System resource monitoring (CPU, memory, network)
- Real-time metrics dashboards
- Compact data visualization in lists or tables
- Rate of change visualization
## See Also
- [chart](chart.md) - For detailed charts with axes
- [gauge](gauge.md) - For single current value display
- [linegauge](linegauge.md) - For horizontal progress bars