# The Canvas Widget
The `canvas` widget provides a low-level drawing surface for custom graphics. You can draw lines, circles, rectangles, points, and text labels at specific coordinates, making it perfect for diagrams, plots, and custom visualizations.
## Interface
```graphix
type CanvasLine = {
color: Color,
x1: f64,
x2: f64,
y1: f64,
y2: f64
};
type CanvasCircle = {
color: Color,
radius: f64,
x: f64,
y: f64
};
type CanvasRectangle = {
color: Color,
height: f64,
width: f64,
x: f64,
y: f64
};
type CanvasPoints = {
color: Color,
coords: Array<(f64, f64)>
};
type CanvasLabel = {
line: Line,
x: f64,
y: f64
};
type CanvasShape = [
`Line(CanvasLine),
`Circle(CanvasCircle),
`Rectangle(CanvasRectangle),
`Points(CanvasPoints),
`Label(CanvasLabel)
];
val canvas: fn(
?#background_color: &[Color, null],
?#marker: &[Marker, null],
#x_bounds: &{ max: f64, min: f64 },
#y_bounds: &{ max: f64, min: f64 },
&Array<&CanvasShape>
) -> Tui;
```
## Parameters
- **background_color** - Background color for the canvas
- **marker** - Marker type: `Dot`, `Braille` (default), or `Block`
- **x_bounds** - X-axis range with `min` and `max` fields (required)
- **y_bounds** - Y-axis range with `min` and `max` fields (required)
## Shape Types
### Line
```graphix
`Line({color: `Red, x1: 0.0, y1: 0.0, x2: 10.0, y2: 5.0})
```
### Circle
```graphix
`Circle({color: `Blue, x: 5.0, y: 5.0, radius: 2.0})
```
### Rectangle
```graphix
`Rectangle({color: `Green, x: 2.0, y: 2.0, width: 3.0, height: 4.0})
```
### Points
```graphix
`Points({color: `Yellow, coords: [(1.0, 1.0), (2.0, 3.0), (3.0, 1.5)]})
```
### Label
```graphix
`Label({line: line("Hello"), x: 5.0, y: 0.5})
```
## Examples
### Basic Usage
```graphix
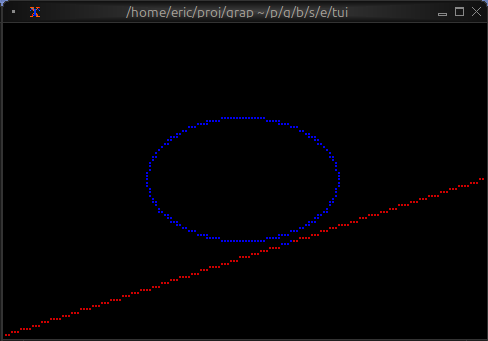
{{#include ../../examples/tui/canvas_basic.gx}}
```
### Function Plotting
```graphix
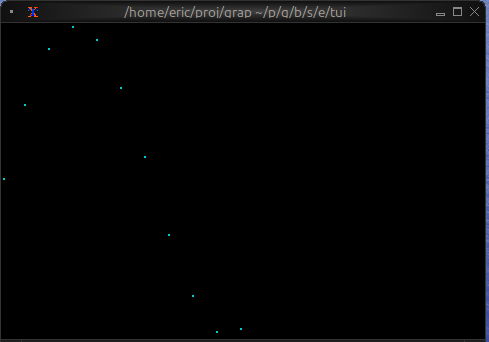
{{#include ../../examples/tui/canvas_plot.gx}}
```
### Network Diagram
```graphix
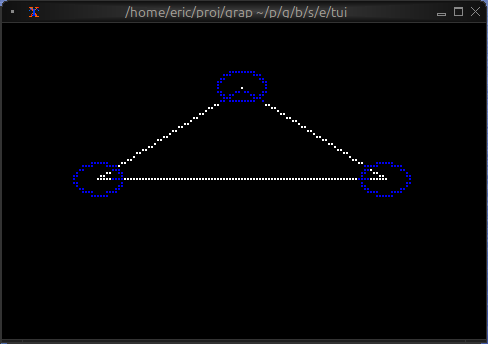
{{#include ../../examples/tui/canvas_network.gx}}
```
### Animated Graphics
```graphix
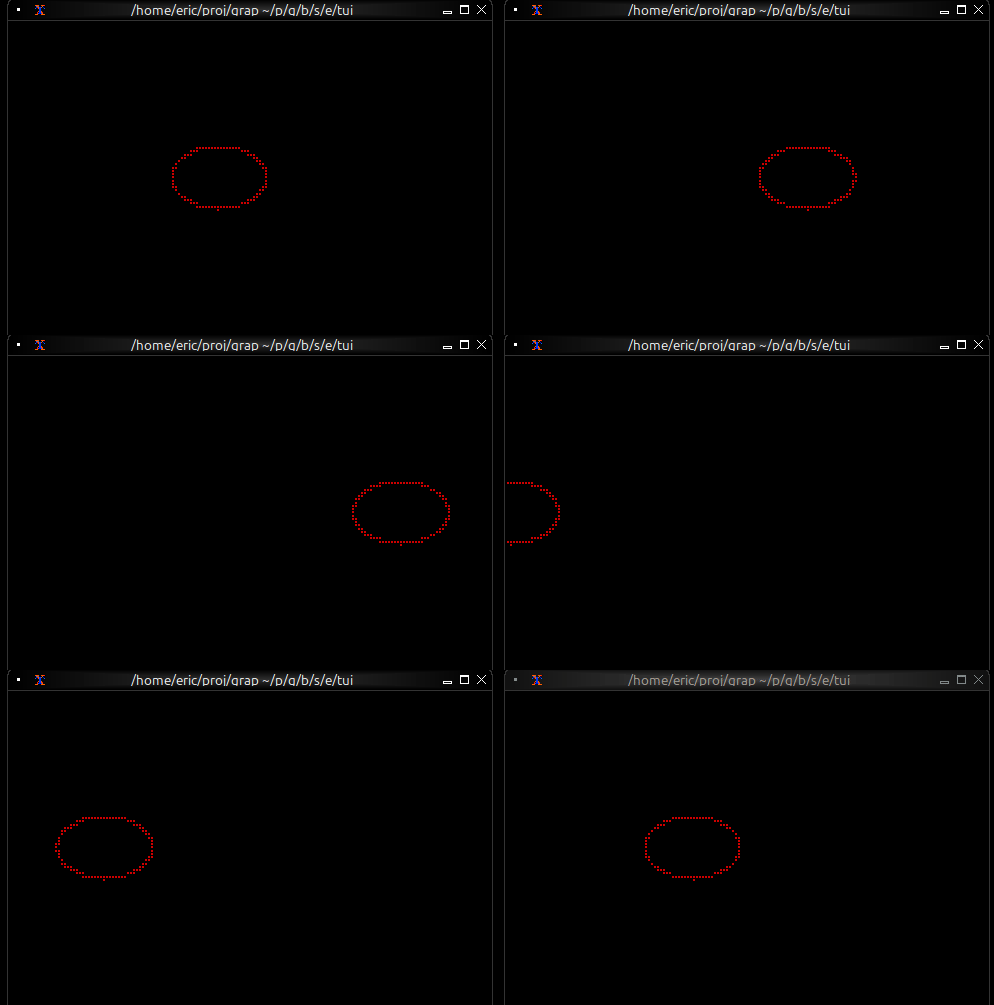
{{#include ../../examples/tui/canvas_animated.gx}}
```
## Marker Comparison
- **Braille**: Highest resolution, smoothest curves, best for detailed graphics
- **Dot**: Fast rendering, lower resolution, good for simple shapes
- **Block**: High contrast, blocky appearance, good for filled areas
## Coordinate System
- Origin (0, 0) is at the bottom-left
- X increases to the right
- Y increases upward
- Shapes outside bounds are clipped
## See Also
- [chart](chart.md) - For pre-built line charts
- [barchart](barchart.md) - For bar-based visualizations