# Debugging
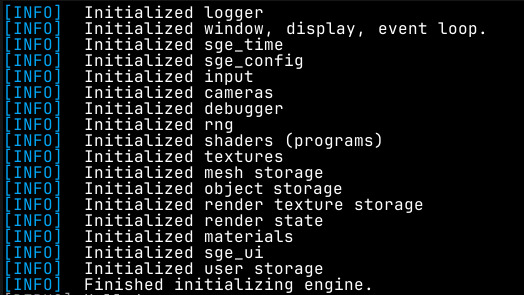
SGE comes with a set of tools for measuring performance and resource usage,
useful for checking for any inefficiencies or memory leaks.
There are functions for checking performance directly.
- [`avg_fps`](https://docs.rs/sge/latest/sge/prelude/debugging/fn.avg_fps.html)
- [`max_fps`](https://docs.rs/sge/latest/sge/prelude/debugging/fn.max_fps.html)
- [`min_fps`](https://docs.rs/sge/latest/sge/prelude/debugging/fn.min_fps.html)
- [`get_draw_calls`](https://docs.rs/sge/latest/sge/prelude/debugging/fn.get_draw_calls.html)
- [`get_drawn_objects`](https://docs.rs/sge/latest/sge/prelude/debugging/fn.get_drawn_objects.html)
- [`get_engine_time`](https://docs.rs/sge/latest/sge/prelude/debugging/fn.get_engine_time.html)
- [`get_index_count`](https://docs.rs/sge/latest/sge/prelude/debugging/fn.get_index_count.html)
- [`get_max_draw_calls`](https://docs.rs/sge/latest/sge/prelude/debugging/fn.get_max_draw_calls.html)
- [`get_max_drawn_objects`](https://docs.rs/sge/latest/sge/prelude/debugging/fn.get_max_drawn_objects.html)
- [`get_max_engine_time`](https://docs.rs/sge/latest/sge/prelude/debugging/fn.get_max_engine_time.html)
- [`get_max_index_count`](https://docs.rs/sge/latest/sge/prelude/debugging/fn.get_max_index_count.html)
- [`get_max_vertex_count`](https://docs.rs/sge/latest/sge/prelude/debugging/fn.get_max_vertex_count.html)
- [`get_vertex_count`](https://docs.rs/sge/latest/sge/prelude/debugging/fn.get_vertex_count.html)
See: [debugging module](https://docs.rs/sge/latest/sge/prelude/debugging/index.html)
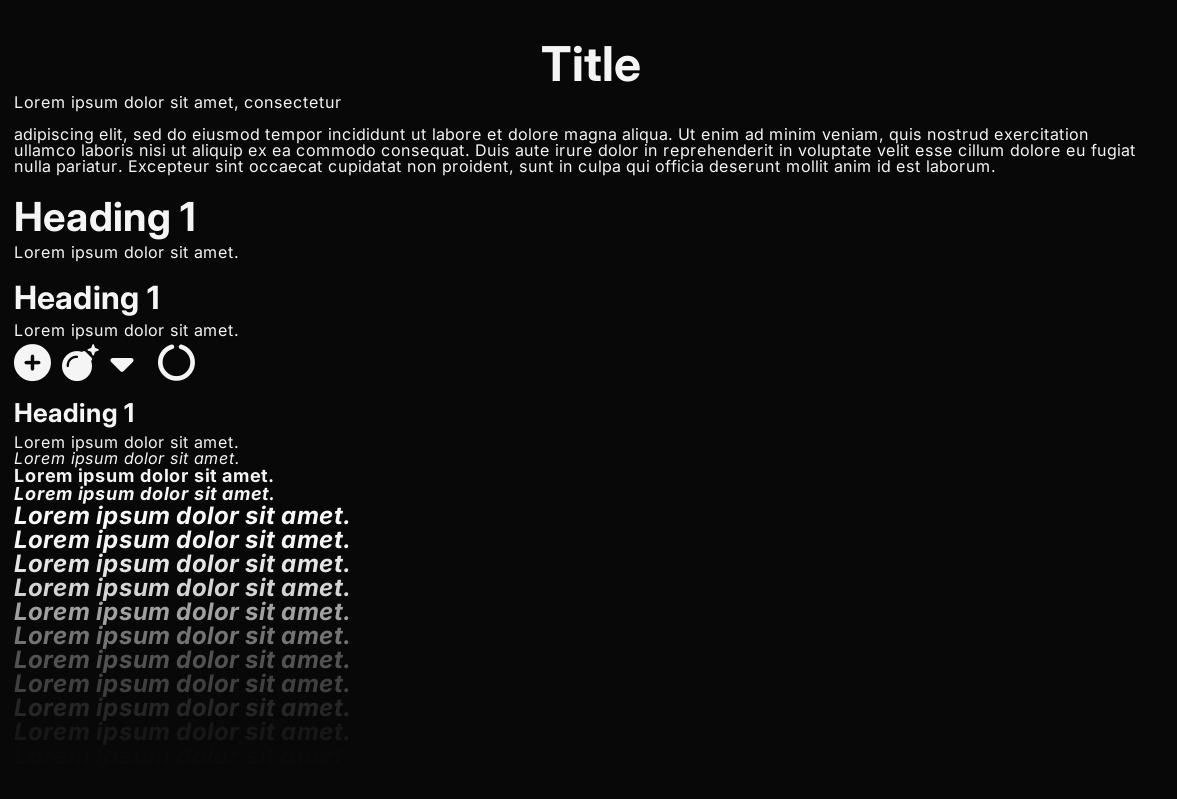
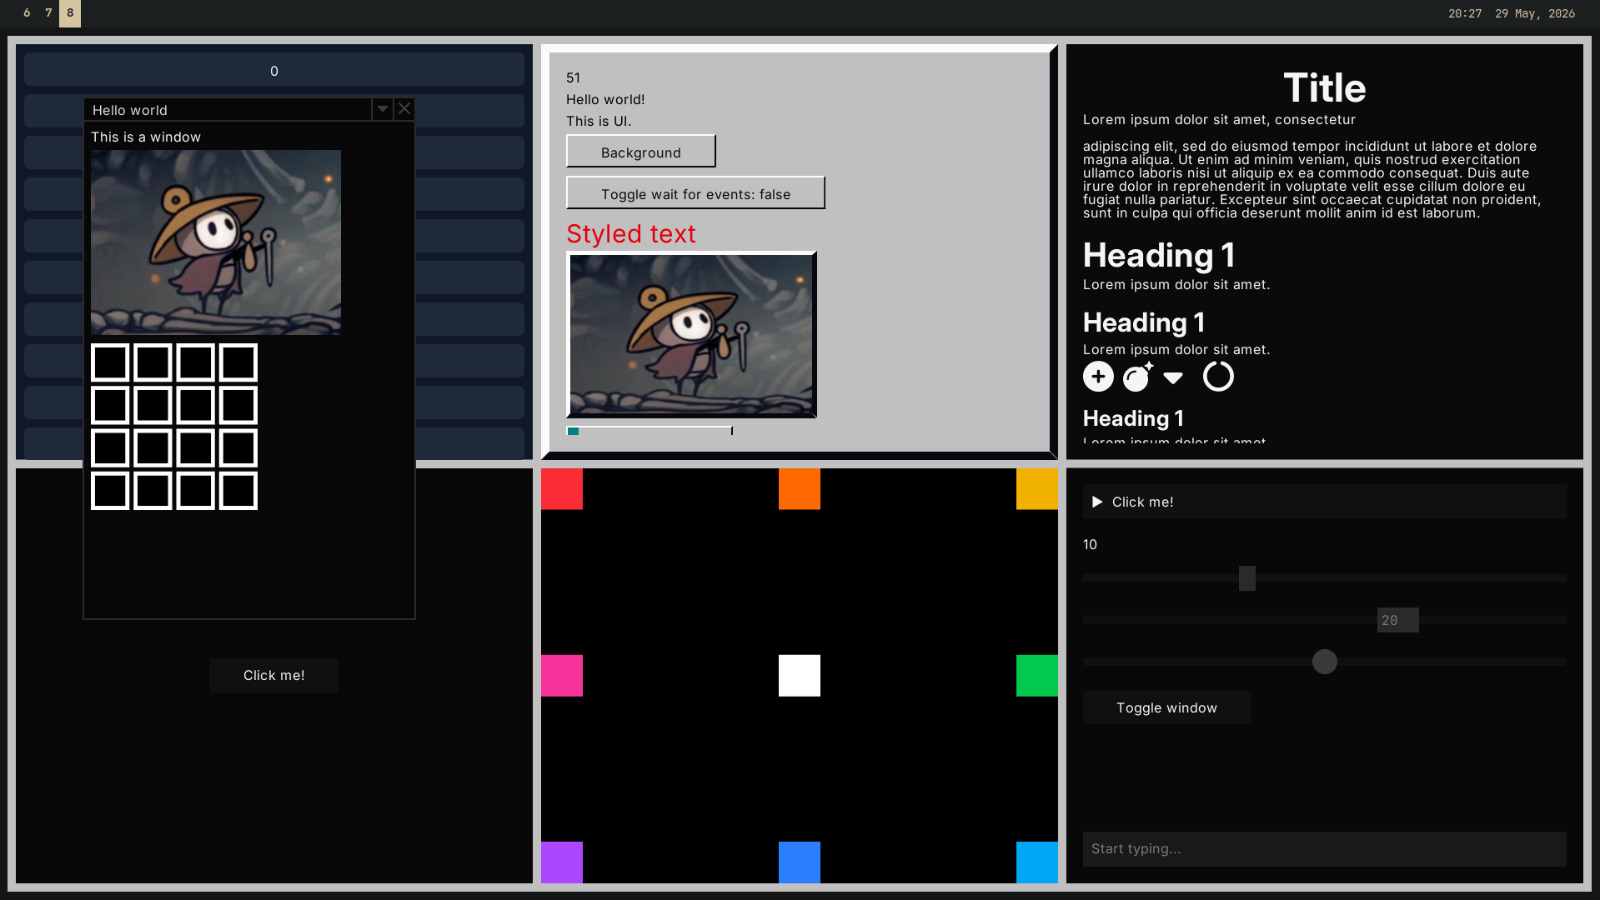
There are also some built-in debug visualisations such as drawing a window,
using the engine's built-in UI library, that shows graphs of the number of
vertices/indices drawn and lots of other information.
Use `draw_debug_info` for graphs, or `draw_simple_debug_info` for just numbers
(better performance).
---
See: [debug visualisations module](https://docs.rs/sge/latest/sge/prelude/debug_visualisations/index.html)