use inlier::api::estimate_line;
use nalgebra::DMatrix;
use plotters::prelude::*;
use rand::Rng;
fn main() -> Result<(), Box<dyn std::error::Error>> {
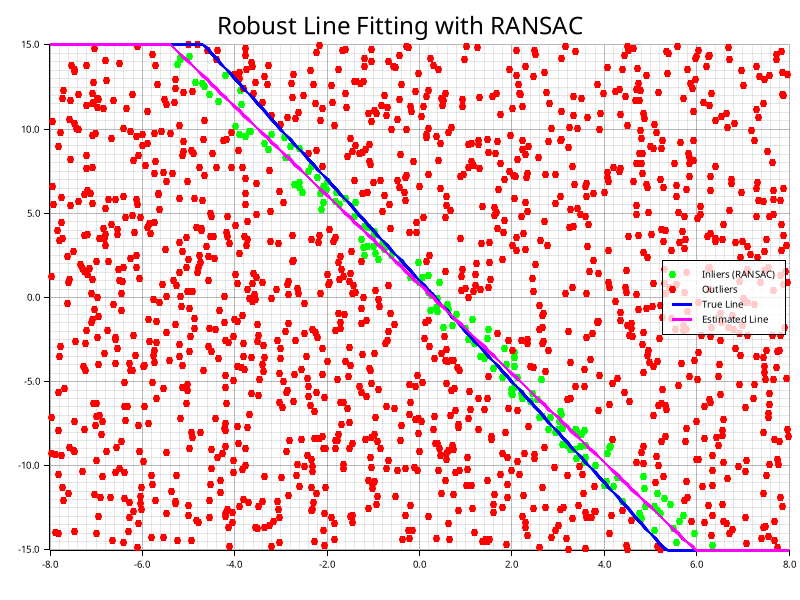
println!("=== Robust Line Fitting with Plotting ===\n");
let n_inliers = 50;
let n_outliers = 1500;
let n_total = n_inliers + n_outliers;
let mut rng = rand::rng();
let true_slope = -3.0;
let true_intercept = 1.0;
println!("True line: y = {:.2}x + {:.2}", true_slope, true_intercept);
let mut points = Vec::new();
for i in 0..n_inliers {
let x = (i as f64) * 0.2 - 5.0;
let y = true_slope * x + true_intercept + rng.random_range(-0.5..0.5);
points.push((x, y));
}
for _ in 0..n_outliers {
let x = rng.random_range(-8.0..8.0);
let y = rng.random_range(-15.0..15.0);
points.push((x, y));
}
use rand::seq::SliceRandom;
points.shuffle(&mut rng);
let mut points_matrix = DMatrix::<f64>::zeros(n_total, 2);
for (i, &(x, y)) in points.iter().enumerate() {
points_matrix[(i, 0)] = x;
points_matrix[(i, 1)] = y;
}
let threshold = 0.5; let result = estimate_line(&points_matrix, threshold, None)?;
println!("RANSAC Results:");
println!(
" Found {} inliers out of {} points",
result.inliers.len(),
n_total
);
println!(" Iterations: {}", result.iterations);
let root = BitMapBackend::new("examples/line_fitting_plot.png", (800, 600)).into_drawing_area();
root.fill(&WHITE)?;
let mut chart = ChartBuilder::on(&root)
.caption(
"Robust Line Fitting with RANSAC",
("sans-serif", 30).into_font(),
)
.margin(10)
.x_label_area_size(40)
.y_label_area_size(40)
.build_cartesian_2d(-8.0..8.0, -15.0..15.0)?;
chart.configure_mesh().draw()?;
chart
.draw_series(result.inliers.iter().filter_map(|&idx| {
if idx < points.len() {
let (x, y) = points[idx];
Some(Circle::new((x, y), 3, GREEN.filled()))
} else {
None
}
}))?
.label("Inliers (RANSAC)")
.legend(|(x, y)| Circle::new((x, y), 3, GREEN.filled()));
let outlier_indices: std::collections::HashSet<usize> =
result.inliers.iter().cloned().collect();
chart
.draw_series((0..n_total).filter_map(|i| {
if !outlier_indices.contains(&i) && i < points.len() {
let (x, y) = points[i];
Some(Circle::new((x, y), 3, RED.filled()))
} else {
None
}
}))?
.label("Outliers")
.legend(|(x, y)| Circle::new((x, y), 3, RED.filled()));
let true_line_points: Vec<(f64, f64)> = (0..=160)
.map(|i| {
let x = -8.0 + (i as f64) * 0.1;
(x, true_slope * x + true_intercept)
})
.collect();
chart
.draw_series(LineSeries::new(true_line_points, BLUE.stroke_width(2)))?
.label("True Line")
.legend(|(x, y)| PathElement::new(vec![(x, y), (x + 20, y)], BLUE.stroke_width(2)));
if let Some((slope, intercept)) = result.model.to_slope_intercept() {
let est_line_points: Vec<(f64, f64)> = (0..=160)
.map(|i| {
let x = -8.0 + (i as f64) * 0.1;
(x, slope * x + intercept)
})
.collect();
chart
.draw_series(LineSeries::new(est_line_points, MAGENTA.stroke_width(2)))?
.label("Estimated Line")
.legend(|(x, y)| PathElement::new(vec![(x, y), (x + 20, y)], MAGENTA.stroke_width(2)));
}
chart
.configure_series_labels()
.background_style(WHITE.mix(0.8))
.border_style(BLACK)
.draw()?;
root.present()?;
println!("\nPlot saved to: examples/line_fitting_plot.png");
Ok(())
}