# The Chart Widget
The `chart` widget renders line charts with multiple datasets, custom axes, labels, and styling. It's ideal for visualizing time series data, trends, sensor readings, and any numeric data relationships.
## Interface
```graphix
type GraphType = [
`Scatter,
`Line,
`Bar
];
type LegendPosition = [
`Top,
`TopRight,
`TopLeft,
`Left,
`Right,
`Bottom,
`BottomRight,
`BottomLeft
];
type Axis = {
bounds: {min: f64, max: f64},
labels: [Array<Line>, null],
labels_alignment: [Alignment, null],
style: [Style, null],
title: [Line, null]
};
val axis: fn(
?#labels: [Array<Line>, null],
?#labels_alignment: [Alignment, null],
?#style: [Style, null],
?#title: [Line, null],
{min: f64, max: f64}
) -> Axis;
type Dataset = {
data: &Array<(f64, f64)>,
graph_type: &[GraphType, null],
marker: &[Marker, null],
name: &[Line, null],
style: &[Style, null]
};
val dataset: fn(
?#marker: &[Marker, null],
?#graph_type: &[GraphType, null],
?#name: &[Line, null],
?#style: &[Style, null],
&Array<(f64, f64)>
) -> Dataset;
val chart: fn(
?#hidden_legend_constraints: &[LegendConstraints, null],
?#legend_position: &[LegendPosition, null],
?#style: &[Style, null],
?#x_axis: &[Axis, null],
?#y_axis: &[Axis, null],
&Array<Dataset>
) -> Tui;
```
## Parameters
### chart
- **style** - Background style for the chart area
- **x_axis** - X-axis configuration (required)
- **y_axis** - Y-axis configuration (required)
### axis
- **title** - Line for axis title
- **labels** - Array of lines displayed along axis
- **style** - Style for axis lines and ticks
### dataset
- **style** - Style for the dataset (line and markers)
- **graph_type** - `Line` or `Scatter`
- **marker** - `Dot`, `Braille`, or `Block`
- **name** - Line naming the dataset (for legends)
## Examples
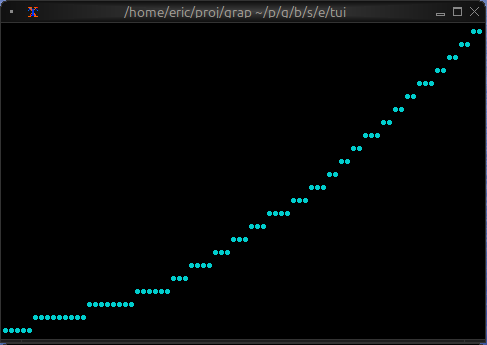
### Basic Usage
```graphix
{{#include ../../examples/tui/chart_basic.gx}}
```
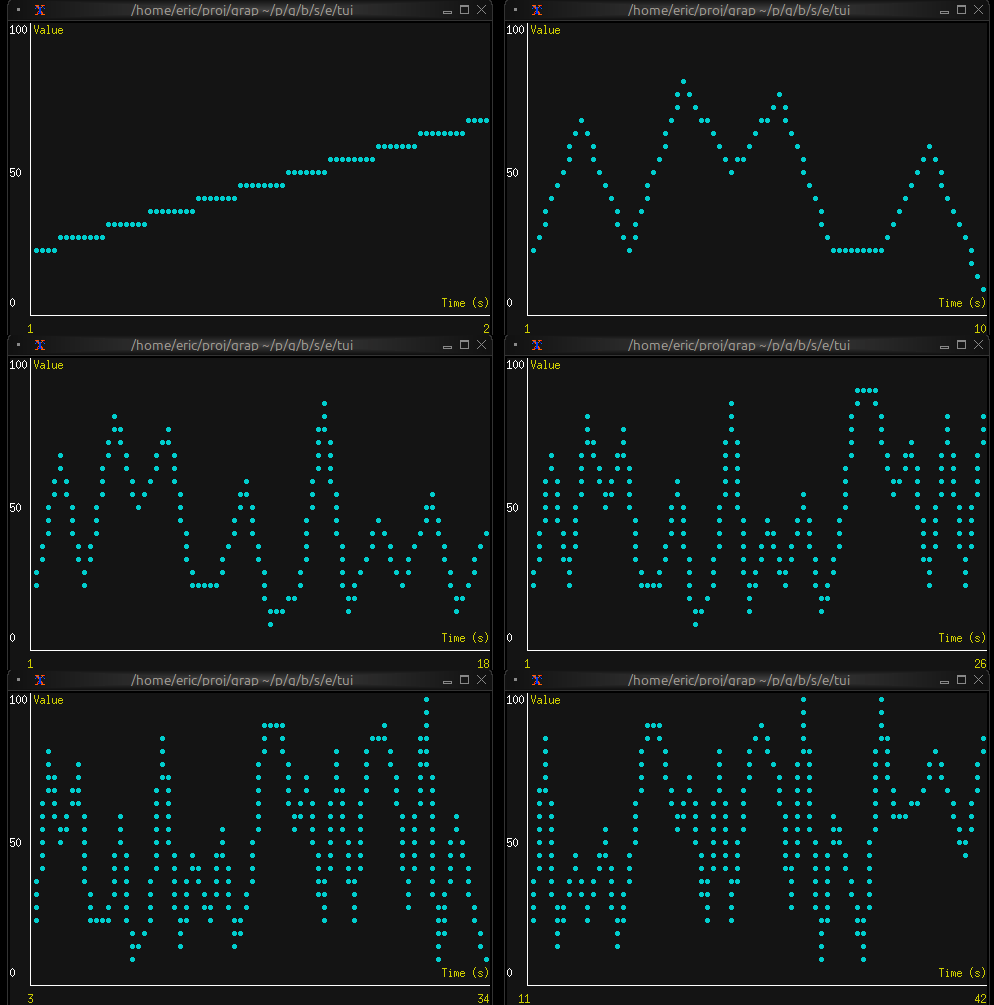
### Real-time Data Visualization
```graphix
{{#include ../../examples/tui/chart_realtime.gx}}
```
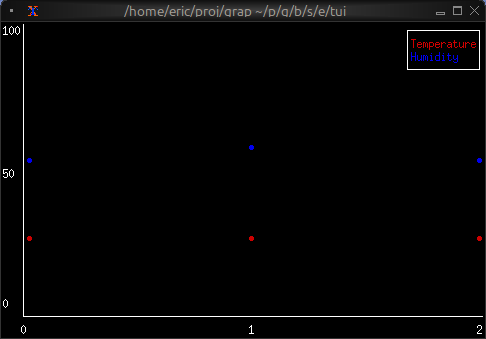
### Multiple Datasets
```graphix
{{#include ../../examples/tui/chart_multi.gx}}
```
## Marker Comparison
- **Dot**: Fastest, lowest resolution, good for dense data
- **Braille**: Smoothest curves, medium performance, best visual quality
- **Block**: High contrast, medium performance
## See Also
- [barchart](barchart.md) - For categorical data visualization
- [sparkline](sparkline.md) - For compact inline charts
- [canvas](canvas.md) - For custom graphics