1
2
3
4
5
6
7
8
9
10
11
12
13
14
15
16
17
18
19
20
21
22
23
24
25
26
27
28
29
30
31
32
33
34
35
36
37
38
39
40
41
42
43
44
45
46
47
48
49
50
51
52
53
54
55
56
57
58
59
60
61
62
63
64
65
66
67
68
69
70
71
72
73
74
75
76
77
78
79
80
81
82
83
84
85
86
87
88
89
90
91
92
93
94
95
96
97
98
99
100
101
102
103
104
105
106
107
108
109
110
111
112
113
114
115
116
117
118
119
120
121
122
123
124
125
126
127
128
129
130
131
132
133
134
135
136
137
138
139
140
141
142
143
144
145
146
147
148
149
150
151
152
153
154
155
156
157
158
159
160
161
162
163
164
165
166
167
168
169
170
171
172
173
174
175
176
177
178
179
180
181
182
183
184
185
186
187
188
189
190
191
192
193
194
195
196
197
198
199
200
201
202
203
204
205
206
207
208
209
210
211
212
213
214
215
216
217
218
219
220
221
222
223
224
225
226
227
228
229
230
231
232
233
234
235
236
237
238
239
240
241
242
243
244
245
246
247
248
249
250
251
252
253
254
255
256
257
258
259
260
261
262
263
264
265
266
267
268
269
270
271
272
273
274
275
276
277
278
279
280
281
282
283
284
285
286
287
288
289
290
291
292
293
294
295
296
297
298
299
300
301
302
303
304
305
306
307
308
309
310
311
312
313
314
315
316
317
318
319
320
321
322
323
324
325
326
327
328
329
330
331
332
//! The [`hexbin`](Axes::hexbin) plotting method on [`Axes`].
//!
//! Mirrors matplotlib's `Axes.hexbin`: the `(x, y)` points are aggregated into a
//! hexagonal tiling and each occupied hexagon is colored by the number of points
//! that fall in it. The tiling is produced by matplotlib's two-grid algorithm —
//! two rectangular grids offset by half a cell, with each point assigned to the
//! grid whose cell center is nearest under the hexagonal Voronoi metric. The
//! counts are colormapped through the default colormap exactly as
//! [`hist2d`](Axes::hist2d) does, and each occupied hexagon is emitted as a
//! filled [`Patch`].
use crate::artist::Patch;
use crate::core::color::{Colormap, LinearNorm, Normalize, Rgba, default_colormap};
use crate::figure::Axes;
impl Axes {
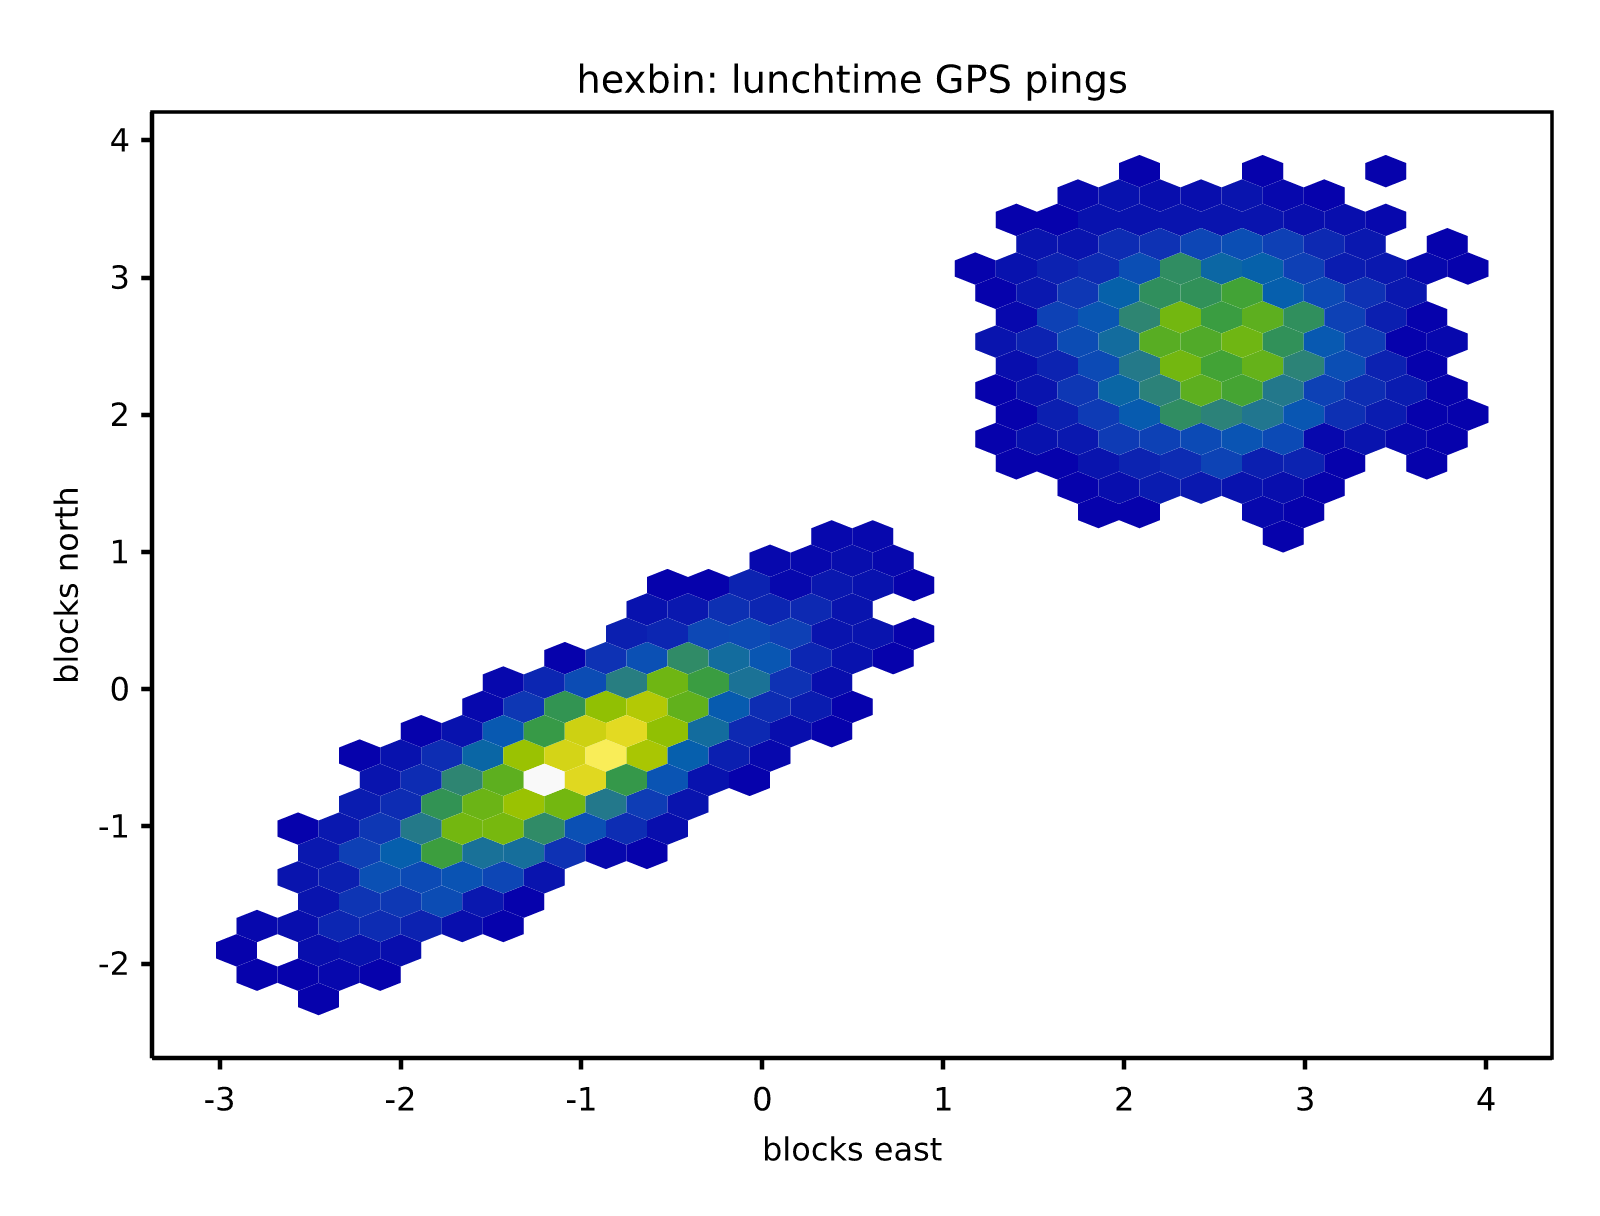
/// Draw a hexagonal-binning density plot of the points `(x, y)`.
///
/// The points are aggregated into a hexagonal tiling with `gridsize`
/// hexagons across the x direction (and a proportional number in y). Each
/// hexagon is colored by the count of points falling in it, via the
/// default colormap normalized over `[0, max_count]`; empty hexagons are
/// not drawn. The tiling follows matplotlib's two-grid algorithm: two
/// rectangular grids offset by half a cell are overlaid, and each point is
/// assigned to the grid whose cell center is nearest (which tessellates the
/// plane into hexagons). The axes data limits are expanded to the true data
/// extents `[xmin, xmax] x [ymin, ymax]`. Returns `&mut Self`.
///
/// 
///
/// # Panics
///
/// Panics if `x.len() != y.len()`, or if `gridsize` is `0`.
///
/// # Examples
///
/// ```
/// use rizzma::core::Bbox;
/// use rizzma::figure::Axes;
///
/// let mut ax = Axes::new(Bbox::from_extents(0.0, 0.0, 1.0, 1.0));
/// let x = [0.0, 1.0, 0.0, 1.0];
/// let y = [0.0, 0.0, 1.0, 1.0];
/// ax.hexbin(&x, &y, 4);
/// // The data limits cover the point extents, x in [0, 1], y in [0, 1]
/// // (the hexagons may overhang slightly, as in matplotlib).
/// let limits = ax.data_limits().expect("hexbin provides data limits");
/// assert!(limits.xmin() <= 0.0 && limits.xmax() >= 1.0);
/// assert!(limits.ymin() <= 0.0 && limits.ymax() >= 1.0);
/// ```
pub fn hexbin(&mut self, x: &[f64], y: &[f64], gridsize: usize) -> &mut Self {
assert_eq!(
x.len(),
y.len(),
"hexbin: x length {} must equal y length {}",
x.len(),
y.len()
);
assert!(gridsize > 0, "hexbin: gridsize must be non-zero");
if x.is_empty() {
return self;
}
// Data bounds, padded so a zero-width/height range stays finite.
let (mut xmin, mut xmax) = finite_extent(x);
let (mut ymin, mut ymax) = finite_extent(y);
if xmax <= xmin {
let eps = if xmin == 0.0 { 0.5 } else { xmin.abs() * 1e-6 };
xmin -= eps;
xmax += eps;
}
if ymax <= ymin {
let eps = if ymin == 0.0 { 0.5 } else { ymin.abs() * 1e-6 };
ymin -= eps;
ymax += eps;
}
let nx = gridsize;
let ny = ((gridsize as f64) / 3.0_f64.sqrt()).round().max(1.0) as usize;
let sx = (xmax - xmin) / nx as f64;
let sy = (ymax - ymin) / ny as f64;
// Grid 1 ("full"): (nx + 1) x (ny + 1), centers at (xmin + i*sx, ymin + j*sy).
// Grid 2 ("offset"): nx x ny, centers at (xmin + (i+0.5)*sx, ymin + (j+0.5)*sy).
let mut grid1 = vec![0.0_f64; (nx + 1) * (ny + 1)];
let mut grid2 = vec![0.0_f64; nx * ny];
for (&px, &py) in x.iter().zip(y.iter()) {
if !px.is_finite() || !py.is_finite() {
continue;
}
let fx = (px - xmin) / sx;
let fy = (py - ymin) / sy;
let i1 = fx.round();
let j1 = fy.round();
let i2 = fx.floor();
let j2 = fy.floor();
let d1 = (fx - i1).powi(2) + 3.0 * (fy - j1).powi(2);
let d2 = (fx - i2 - 0.5).powi(2) + 3.0 * (fy - j2 - 0.5).powi(2);
if d1 <= d2 {
let i = (i1 as i64).clamp(0, nx as i64) as usize;
let j = (j1 as i64).clamp(0, ny as i64) as usize;
grid1[j * (nx + 1) + i] += 1.0;
} else {
let i = (i2 as i64).clamp(0, nx as i64 - 1) as usize;
let j = (j2 as i64).clamp(0, ny as i64 - 1) as usize;
grid2[j * nx + i] += 1.0;
}
}
let max_count = grid1
.iter()
.chain(grid2.iter())
.cloned()
.fold(0.0_f64, f64::max);
let norm = LinearNorm::new(0.0, max_count);
let cmap = default_colormap();
// Unit hexagon outline (offsets relative to a center): pointy-top, with
// vertical flat edges of width sx and points at the top/bottom at ±sy/3.
// This is matplotlib's hexbin polygon; it tessellates exactly with the
// two grids offset by (sx/2, sy/2) — each cell's upper-right edge is
// shared with the offset cell's lower-left edge, so there are no seams
// and no overlaps.
let hexagon = [
[sx / 2.0, -sy / 6.0],
[sx / 2.0, sy / 6.0],
[0.0, sy / 3.0],
[-sx / 2.0, sy / 6.0],
[-sx / 2.0, -sy / 6.0],
[0.0, -sy / 3.0],
];
// Emit a filled hexagon for each occupied cell of both grids. The face
// and edge share a color so adjacent hexagons tile without seams.
for j in 0..=ny {
for i in 0..=nx {
let count = grid1[j * (nx + 1) + i];
if count <= 0.0 {
continue;
}
let cx = xmin + i as f64 * sx;
let cy = ymin + j as f64 * sy;
self.push_hexagon(&hexagon, cx, cy, cmap.sample(norm.normalize(count)));
}
}
for j in 0..ny {
for i in 0..nx {
let count = grid2[j * nx + i];
if count <= 0.0 {
continue;
}
let cx = xmin + (i as f64 + 0.5) * sx;
let cy = ymin + (j as f64 + 0.5) * sy;
self.push_hexagon(&hexagon, cx, cy, cmap.sample(norm.normalize(count)));
}
}
// Pin the data limits to the true data extents (hexagons may overhang).
self.include_data_bbox(xmin, ymin, xmax, ymax);
self
}
/// Push a single hexagon `Patch` translated to `(cx, cy)`, filled with
/// `color` (the edge shares the color so neighbors tile seamlessly).
fn push_hexagon(&mut self, hexagon: &[[f64; 2]; 6], cx: f64, cy: f64, color: Rgba) {
let verts: Vec<[f64; 2]> = hexagon.iter().map(|[dx, dy]| [cx + dx, cy + dy]).collect();
self.add_patch(
Patch::polygon(&verts)
.facecolor(Some(color))
.edgecolor(Some(color))
.linewidth(0.0),
);
}
}
/// The finite min and max of `data`, or `(0.0, 1.0)` when there is no finite
/// value (empty or all-NaN input).
fn finite_extent(data: &[f64]) -> (f64, f64) {
let mut min = f64::INFINITY;
let mut max = f64::NEG_INFINITY;
for &v in data {
if v.is_finite() {
min = min.min(v);
max = max.max(v);
}
}
if min <= max { (min, max) } else { (0.0, 1.0) }
}
#[cfg(test)]
mod tests {
use crate::core::Bbox;
use crate::figure::Axes;
#[test]
fn hexbin_conserves_total_count() {
// Every drawn hexagon corresponds to >= 1 point and each point is
// assigned to exactly one hexagon. The implementation accumulates one
// count per finite point across both grids; the strongest invariant is
// that the total recovered count equals the number of input points.
let mut x = Vec::new();
let mut y = Vec::new();
for i in 0..400 {
let t = i as f64;
x.push((t * 0.123).sin() * 3.0 + 5.0);
y.push((t * 0.077).cos() * 2.0 + 4.0);
}
assert_eq!(bin_total(&x, &y, 10), 400);
// The drawing path agrees: one patch per occupied hexagon, between 1 and
// the number of points.
let mut ax = Axes::new(Bbox::from_extents(0.0, 0.0, 1.0, 1.0));
ax.hexbin(&x, &y, 10);
assert!(!ax.patches.is_empty());
assert!(ax.patches.len() <= 400);
}
#[test]
fn hexbin_tight_cluster_fills_few_hexagons() {
let mut ax = Axes::new(Bbox::from_extents(0.0, 0.0, 1.0, 1.0));
// A tight cluster plus two far corners to set a wide extent. The cluster
// points all collapse into a small number of adjacent hexagons.
let mut x = vec![0.0, 10.0];
let mut y = vec![0.0, 10.0];
for _ in 0..50 {
x.push(5.0);
y.push(5.0);
}
ax.hexbin(&x, &y, 20);
// 52 points sit at only three locations -> at most 3 hexagons.
assert!(ax.patches.len() <= 3, "got {}", ax.patches.len());
assert!(!ax.patches.is_empty());
}
#[test]
fn hexbin_uniform_spread_fills_many_hexagons() {
let mut ax = Axes::new(Bbox::from_extents(0.0, 0.0, 1.0, 1.0));
let mut x = Vec::new();
let mut y = Vec::new();
for i in 0..20 {
for j in 0..20 {
x.push(i as f64);
y.push(j as f64);
}
}
ax.hexbin(&x, &y, 12);
// A dense uniform grid lights up many hexagons.
assert!(ax.patches.len() > 20, "got {}", ax.patches.len());
}
#[test]
fn hexbin_empty_input_draws_nothing() {
let mut ax = Axes::new(Bbox::from_extents(0.0, 0.0, 1.0, 1.0));
ax.hexbin(&[], &[], 8);
assert!(ax.patches.is_empty());
assert!(ax.data_limits().is_none());
}
#[test]
fn hexbin_data_limits_cover_extents() {
let mut ax = Axes::new(Bbox::from_extents(0.0, 0.0, 1.0, 1.0));
let x = [-2.0, 4.0, 1.0, 0.0];
let y = [10.0, 20.0, 15.0, 12.0];
ax.hexbin(&x, &y, 5);
let limits = ax.data_limits().expect("hexbin provides data limits");
// The limits cover the true data extents; hexagons may overhang a
// little (matplotlib does too), so the bounds are at least as wide.
assert!(limits.xmin() <= -2.0 && limits.xmax() >= 4.0);
assert!(limits.ymin() <= 10.0 && limits.ymax() >= 20.0);
}
/// Replays the binning purely to count point assignments, independent of the
/// drawing path, to validate count conservation: every finite point is
/// assigned to exactly one hexagon.
fn bin_total(x: &[f64], y: &[f64], gridsize: usize) -> usize {
let (mut xmin, mut xmax) = ext(x);
let (mut ymin, mut ymax) = ext(y);
if xmax <= xmin {
xmin -= 0.5;
xmax += 0.5;
}
if ymax <= ymin {
ymin -= 0.5;
ymax += 0.5;
}
let nx = gridsize;
let ny = ((gridsize as f64) / 3.0_f64.sqrt()).round().max(1.0) as usize;
let sx = (xmax - xmin) / nx as f64;
let sy = (ymax - ymin) / ny as f64;
let mut grid1 = vec![0.0_f64; (nx + 1) * (ny + 1)];
let mut grid2 = vec![0.0_f64; nx * ny];
for (&px, &py) in x.iter().zip(y.iter()) {
if !px.is_finite() || !py.is_finite() {
continue;
}
let fx = (px - xmin) / sx;
let fy = (py - ymin) / sy;
let i1 = fx.round();
let j1 = fy.round();
let i2 = fx.floor();
let j2 = fy.floor();
let d1 = (fx - i1).powi(2) + 3.0 * (fy - j1).powi(2);
let d2 = (fx - i2 - 0.5).powi(2) + 3.0 * (fy - j2 - 0.5).powi(2);
if d1 <= d2 {
let i = (i1 as i64).clamp(0, nx as i64) as usize;
let j = (j1 as i64).clamp(0, ny as i64) as usize;
grid1[j * (nx + 1) + i] += 1.0;
} else {
let i = (i2 as i64).clamp(0, nx as i64 - 1) as usize;
let j = (j2 as i64).clamp(0, ny as i64 - 1) as usize;
grid2[j * nx + i] += 1.0;
}
}
let sum: f64 = grid1.iter().chain(grid2.iter()).sum();
sum as usize
}
fn ext(data: &[f64]) -> (f64, f64) {
let mut min = f64::INFINITY;
let mut max = f64::NEG_INFINITY;
for &v in data {
if v.is_finite() {
min = min.min(v);
max = max.max(v);
}
}
(min, max)
}
}