1
2
3
4
5
6
7
8
9
10
11
12
13
14
15
16
17
18
19
20
21
22
23
24
25
26
27
28
29
30
31
32
33
34
35
36
37
38
39
40
41
42
43
44
45
46
47
48
49
50
51
52
53
54
55
56
57
58
59
60
61
62
63
64
65
66
67
68
69
70
71
72
73
74
75
76
77
78
79
80
81
82
83
84
85
86
87
88
89
90
91
92
93
94
95
96
97
98
99
100
101
102
103
104
105
106
107
108
109
110
111
112
113
114
115
116
117
118
119
120
121
122
123
124
125
126
127
128
129
130
131
132
133
134
135
136
137
138
139
140
141
142
143
144
145
146
147
148
149
150
151
152
153
154
155
156
157
158
159
160
161
162
163
164
165
166
167
168
169
170
171
172
173
174
175
176
177
178
179
180
181
182
183
184
185
186
187
188
189
190
191
192
193
194
195
196
197
198
199
200
201
202
203
204
205
206
207
208
209
210
211
212
213
214
215
216
217
218
219
220
221
222
223
224
225
226
227
228
229
230
231
232
233
234
235
236
237
238
239
//! The [`Axes::contourf`] filled-contour helper.
//!
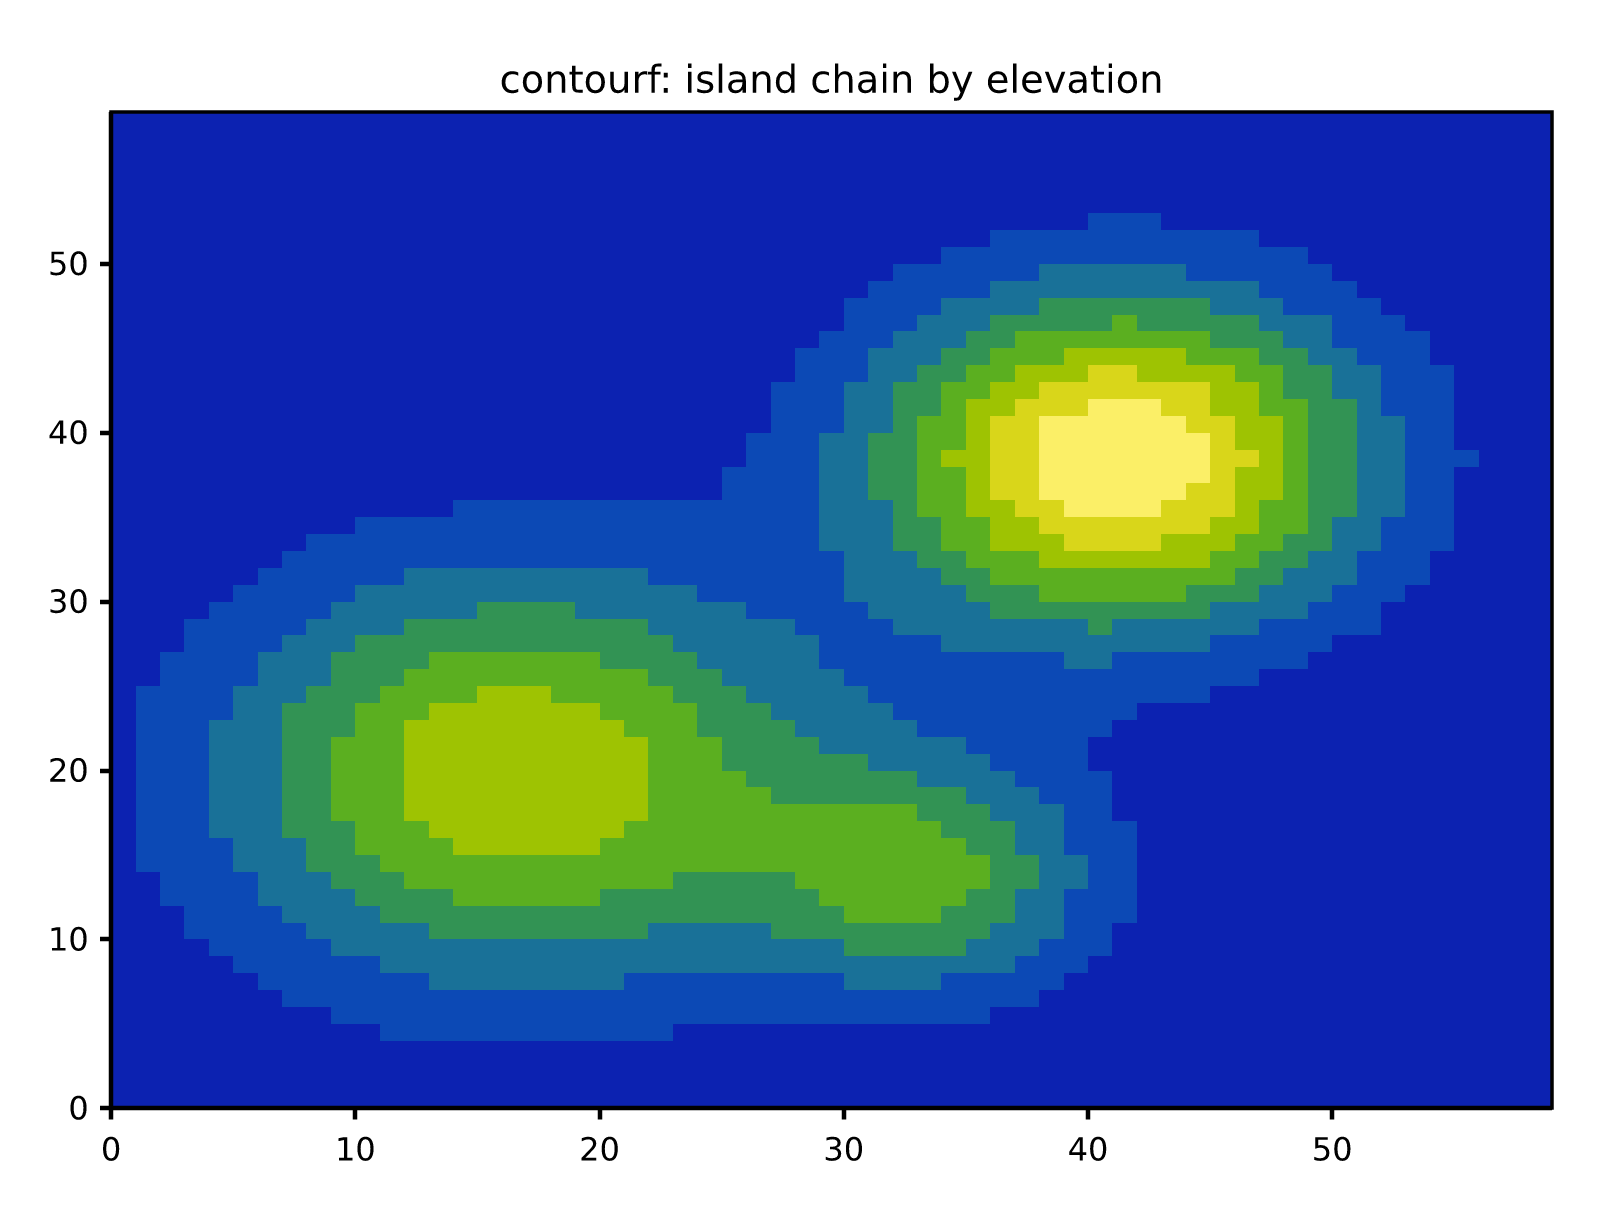
//! Mirrors matplotlib's `Axes.contourf` for the regular-grid case: it partitions
//! the value range `[zmin, zmax]` into a set of evenly-spaced bands and fills the
//! regions between successive contour levels with a color drawn from the
//! default colormap. Where [`contour`](super::Axes::contour) traces the level
//! *lines*, `contourf` fills the *bands* between them.
//!
//! The fill uses flat per-cell banding: each `2 x 2` grid cell (corners at
//! integer coordinates `x = 0..ncols-1`, `y = 0..nrows-1`) is emitted as a
//! filled quadrilateral colored by the band its mean corner value falls into.
//! Over a smooth field this reads as concentric colored contour bands. The grid
//! extent folds into [`data_limits`](super::Axes::data_limits) for autoscaling.
use crate::artist::QuadMesh;
use crate::core::color::{Colormap, LinearNorm, Normalize, default_colormap};
use crate::figure::Axes;
/// Default number of filled bands for [`Axes::contourf`].
const DEFAULT_N_LEVELS: usize = 8;
/// The finite min and max of `data`, or `(0.0, 1.0)` when there is no finite
/// value (empty or all-NaN input).
fn data_min_max(data: &[f64]) -> (f64, f64) {
let mut min = f64::INFINITY;
let mut max = f64::NEG_INFINITY;
for &v in data {
if v.is_finite() {
min = min.min(v);
max = max.max(v);
}
}
if min <= max { (min, max) } else { (0.0, 1.0) }
}
impl Axes {
/// Draw filled contours of row-major scalar `z` (`nrows x ncols`).
///
/// The grid values sit at integer coordinates (`x = 0..ncols-1`,
/// `y = 0..nrows-1`, so `z[j * ncols + i]` is the value at `(i, j)`). The
/// value range `[zmin, zmax]` (finite data min/max) is split into eight
/// evenly-spaced bands. Each `2 x 2` grid cell becomes a filled
/// quadrilateral colored by the band into which its mean corner value falls,
/// sampled from the default colormap through a [`LinearNorm`] over
/// `[zmin, zmax]`. Over a smooth field the cells read as concentric colored
/// contour bands. The filled mesh is stored as a [`QuadMesh`] (drawn beneath
/// lines and patches) and the grid extent folds into
/// [`data_limits`](Axes::data_limits).
///
/// A grid smaller than `2 x 2`, a length mismatch (`z.len() != nrows *
/// ncols`), or a flat field (`zmin == zmax`) draws nothing, though the grid
/// extent is still recorded when the grid is at least `1 x 1`. Nothing here
/// panics.
///
/// 
///
/// # Examples
///
/// ```
/// use rizzma::core::Bbox;
/// use rizzma::figure::Axes;
///
/// let mut ax = Axes::new(Bbox::from_extents(0.0, 0.0, 1.0, 1.0));
/// // A 3x3 ramp increasing along x; bands run vertically.
/// let z = [0.0, 1.0, 2.0, 0.0, 1.0, 2.0, 0.0, 1.0, 2.0];
/// ax.contourf(&z, 3, 3);
/// let limits = ax.data_limits().expect("contourf provides data limits");
/// // The grid spans x in [0, 2], y in [0, 2].
/// assert_eq!((limits.xmin(), limits.xmax()), (0.0, 2.0));
/// assert_eq!((limits.ymin(), limits.ymax()), (0.0, 2.0));
/// ```
pub fn contourf(&mut self, z: &[f64], nrows: usize, ncols: usize) -> &mut Self {
// Record the grid extent so autoscaling fits it even when nothing fills.
if ncols >= 1 && nrows >= 1 {
self.include_data_bbox(0.0, 0.0, (ncols - 1) as f64, (nrows - 1) as f64);
}
// Guard against mismatched or degenerate grids: draw nothing, no panic.
if z.len() != nrows * ncols || nrows < 2 || ncols < 2 {
return self;
}
let (zmin, zmax) = data_min_max(z);
if zmax <= zmin {
return self;
}
let norm = LinearNorm::new(zmin, zmax);
let cmap = default_colormap();
let span = zmax - zmin;
let n_bands = DEFAULT_N_LEVELS;
// One filled cell per 2x2 block: (nrows - 1) x (ncols - 1) cells, whose
// corners sit at the integer grid nodes.
let cell_rows = nrows - 1;
let cell_cols = ncols - 1;
// Grid corners at integer node coordinates, row-major:
// (cell_rows + 1) * (cell_cols + 1) = nrows * ncols points.
let mut coordinates = Vec::with_capacity(nrows * ncols);
for r in 0..nrows {
for c in 0..ncols {
coordinates.push([c as f64, r as f64]);
}
}
// Color each cell by the band its mean corner value falls into. The band
// is represented by its center value, mapped through the colormap so adjacent
// cells in the same band share exactly one color (flat banding).
let mut facecolors = Vec::with_capacity(cell_rows * cell_cols);
for r in 0..cell_rows {
for c in 0..cell_cols {
let tl = z[r * ncols + c];
let tr = z[r * ncols + c + 1];
let bl = z[(r + 1) * ncols + c];
let br = z[(r + 1) * ncols + c + 1];
let avg = (tl + tr + bl + br) / 4.0;
// Which band [0, n_bands) does this cell fall into?
let frac = (avg - zmin) / span;
let band = ((frac * n_bands as f64) as usize).min(n_bands - 1);
// Band center value, so the whole band is one flat color.
let band_value = zmin + (band as f64 + 0.5) / n_bands as f64 * span;
facecolors.push(cmap.sample(norm.normalize(band_value)));
}
}
let mesh = QuadMesh::new(cell_rows, cell_cols, coordinates, facecolors);
self.meshes.push(mesh);
self
}
}
#[cfg(test)]
mod tests {
use crate::core::Bbox;
use crate::core::color::Rgba;
use crate::figure::Axes;
/// A [`Renderer`](crate::render::Renderer) that records the fill color of
/// each `draw_path` call.
#[derive(Default)]
struct ColorRecorder {
fills: Vec<Option<Rgba>>,
}
impl crate::render::Renderer for ColorRecorder {
fn draw_path(
&mut self,
_gc: &crate::render::GraphicsContext,
_path: &crate::core::Path,
_transform: &crate::core::Affine2D,
fill: Option<Rgba>,
) {
self.fills.push(fill);
}
fn canvas_size(&self) -> (f64, f64) {
(100.0, 100.0)
}
}
fn approx(a: f64, b: f64) {
assert!((a - b).abs() < 1e-9, "expected {b}, got {a}");
}
/// Collect the per-cell fill colors of the axes' single mesh.
fn mesh_fills(ax: &Axes) -> Vec<Rgba> {
let mesh = ax.meshes.last().expect("contourf pushed a mesh");
let mut rec = ColorRecorder::default();
crate::artist::Artist::draw(mesh, &mut rec, &crate::core::Affine2D::identity());
rec.fills
.iter()
.map(|f| f.expect("filled cell has a color"))
.collect()
}
#[test]
fn filled_bands_span_the_value_range() {
let mut ax = Axes::new(Bbox::from_extents(0.0, 0.0, 1.0, 1.0));
// A 5-column ramp z = x in 0..4: low cells and high cells fall into
// different bands, so their fill colors differ.
let z: Vec<f64> = (0..2 * 5).map(|i| (i % 5) as f64).collect();
ax.contourf(&z, 2, 5);
let fills = mesh_fills(&ax);
assert!(!fills.is_empty(), "contourf emits filled cells");
// The lowest-valued cell and the highest-valued cell land in different
// color bands, so the min-band color differs from the max-band color.
assert_ne!(
fills.first().copied(),
fills.last().copied(),
"low and high bands must be colored differently"
);
}
#[test]
fn mismatched_length_draws_nothing() {
let mut ax = Axes::new(Bbox::from_extents(0.0, 0.0, 1.0, 1.0));
// z.len() = 3 but nrows * ncols = 4: draw nothing, no panic.
ax.contourf(&[0.0, 1.0, 2.0], 2, 2);
assert!(ax.meshes.is_empty(), "mismatched grid emits no mesh");
}
#[test]
fn empty_input_draws_nothing() {
let mut ax = Axes::new(Bbox::from_extents(0.0, 0.0, 1.0, 1.0));
ax.contourf(&[], 0, 0);
assert!(ax.meshes.is_empty(), "empty grid emits no mesh");
}
#[test]
fn sub_2x2_grid_draws_nothing_but_records_limits() {
let mut ax = Axes::new(Bbox::from_extents(0.0, 0.0, 1.0, 1.0));
ax.contourf(&[0.0, 1.0], 1, 2);
assert!(ax.meshes.is_empty(), "1-row grid emits no mesh");
}
#[test]
fn flat_field_draws_nothing() {
let mut ax = Axes::new(Bbox::from_extents(0.0, 0.0, 1.0, 1.0));
ax.contourf(&[3.0, 3.0, 3.0, 3.0], 2, 2);
assert!(ax.meshes.is_empty(), "flat field emits no mesh");
}
#[test]
fn data_limits_cover_the_grid() {
let mut ax = Axes::new(Bbox::from_extents(0.0, 0.0, 1.0, 1.0));
// 4-row, 5-column ramp; the grid spans x in [0, 4], y in [0, 3].
let (nr, nc) = (4usize, 5usize);
let z: Vec<f64> = (0..nr * nc).map(|i| (i % nc) as f64).collect();
ax.contourf(&z, nr, nc);
let e = ax.data_limits().expect("contourf records data limits");
approx(e.xmin(), 0.0);
approx(e.xmax(), (nc - 1) as f64);
approx(e.ymin(), 0.0);
approx(e.ymax(), (nr - 1) as f64);
}
}