1
2
3
4
5
6
7
8
9
10
11
12
13
14
15
16
17
18
19
20
21
22
23
24
25
26
27
28
29
30
31
32
33
34
35
36
37
38
39
40
41
42
43
44
45
46
47
48
49
50
51
52
53
54
55
56
57
58
59
60
61
62
63
64
65
66
67
68
69
70
71
72
73
74
75
76
77
78
79
80
81
82
83
84
85
86
87
88
89
90
91
92
93
94
95
96
97
98
99
100
101
102
103
104
105
106
107
108
109
110
111
112
113
114
115
116
117
118
119
120
121
122
123
124
125
126
127
128
129
130
131
132
133
134
135
136
137
138
139
140
141
142
143
144
145
146
147
148
149
150
151
152
153
154
155
156
157
158
159
160
161
162
163
164
165
166
167
168
169
170
171
172
173
174
175
176
177
178
179
180
181
182
183
184
185
186
187
188
189
190
191
192
193
194
195
196
197
198
199
200
201
202
203
204
205
206
207
208
209
210
211
212
213
214
215
216
217
218
219
220
221
222
223
224
225
226
227
228
229
230
231
232
233
234
235
236
237
238
239
240
241
242
243
244
245
246
247
248
249
250
251
252
253
254
255
256
257
258
259
260
261
262
263
264
265
266
267
268
269
270
271
272
273
274
275
276
277
278
279
280
281
282
283
284
285
286
287
288
289
290
291
292
293
294
295
296
297
298
299
300
301
302
303
304
305
306
307
308
309
310
311
312
313
314
315
316
317
318
319
320
321
322
323
324
325
326
327
328
329
330
331
332
333
334
335
336
337
338
339
340
341
342
343
344
345
346
347
348
349
350
351
352
353
354
355
356
357
358
359
360
361
362
363
364
365
366
367
368
369
370
371
372
373
374
375
376
377
378
379
380
381
382
383
384
385
386
387
388
389
390
391
//! Tier-1 plotting methods on [`Axes`].
//!
//! These mirror matplotlib's convenience plotting helpers, each translating its
//! arguments into [`Line2D`] / [`Patch`] artists (or, for the full-span
//! reference helpers, into draw-time-resolved spans stored on the [`Axes`]).
//! Keeping them here leaves [`axes.rs`](super::axes) focused on the core
//! coordinate/limit machinery.
use crate::artist::{Line2D, Patch};
use crate::core::color::Rgba;
use crate::figure::Axes;
use crate::figure::axes::{SpanLine, SpanOrientation, SpanRect};
/// Default width (in data units) of a vertical [`bar`](Axes::bar).
const DEFAULT_BAR_WIDTH: f64 = 0.8;
/// Default height (in data units) of a horizontal [`barh`](Axes::barh) bar.
const DEFAULT_BARH_HEIGHT: f64 = 0.8;
/// Default fill opacity for [`fill_between`](Axes::fill_between) regions.
const FILL_ALPHA: f64 = 0.4;
/// Default fill opacity for [`axhspan`](Axes::axhspan)/[`axvspan`](Axes::axvspan).
const SPAN_ALPHA: f64 = 0.5;
/// Expand `(x, y)` into a `"pre"` staircase polyline.
///
/// For `n >= 2` input points the result has `2 * n - 1` vertices: each `y[i]`
/// jumps in at the previous `x[i - 1]` and holds across to `x[i]`. Inputs are
/// assumed equal length and at least two points long.
fn step_pre(x: &[f64], y: &[f64]) -> (Vec<f64>, Vec<f64>) {
let n = x.len();
let mut sx: Vec<f64> = Vec::with_capacity(2 * n - 1);
let mut sy: Vec<f64> = Vec::with_capacity(2 * n - 1);
sx.push(x[0]);
sy.push(y[0]);
for i in 1..n {
// Rise to the new y at the previous x, then move across to x[i].
sx.push(x[i - 1]);
sy.push(y[i]);
sx.push(x[i]);
sy.push(y[i]);
}
(sx, sy)
}
impl Axes {
/// Draw a vertical bar chart: one rectangle per `(x, height)` pair.
///
/// Each bar is centered horizontally on its `x` value with the matplotlib
/// default width of `0.8`, rising from `0.0` to `height`. The face color is
/// taken from the next entry of the property cycle (advancing it once) and
/// the edge is black. Only the common prefix of `x` and `height` is used.
pub fn bar(&mut self, x: &[f64], height: &[f64]) {
// Bars grow from the zero baseline: pin it so the autoscale margin
// never floats them off the axis floor.
self.sticky_y.push(0.0);
self.bar_with(x, height, DEFAULT_BAR_WIDTH, 0.0);
}
/// Draw a vertical bar chart with an explicit `width` and `bottom`.
///
/// Like [`bar`](Axes::bar), but each rectangle spans
/// `x - width/2 ..= x + width/2` horizontally and `bottom ..= bottom +
/// height` vertically. The face color advances the property cycle once and
/// the edge is black.
pub fn bar_with(&mut self, x: &[f64], height: &[f64], width: f64, bottom: f64) {
let face = self.next_cycle_color();
for (&xc, &h) in x.iter().zip(height.iter()) {
let patch = Patch::rectangle(xc - width / 2.0, bottom, width, h)
.facecolor(Some(face))
.edgecolor(Some(Rgba::BLACK));
self.add_patch(patch);
}
}
/// Draw a horizontal bar chart: one rectangle per `(y, width)` pair.
///
/// Each bar is centered vertically on its `y` value with the matplotlib
/// default height of `0.8`, extending from `0.0` to `width`. The face color
/// advances the property cycle once and the edge is black. Only the common
/// prefix of `y` and `width` is used.
pub fn barh(&mut self, y: &[f64], width: &[f64]) {
self.barh_with(y, width, DEFAULT_BARH_HEIGHT, 0.0);
}
/// Draw a horizontal bar chart with an explicit `height` and `left`.
///
/// Each rectangle spans `left ..= left + width` horizontally and
/// `y - height/2 ..= y + height/2` vertically.
pub fn barh_with(&mut self, y: &[f64], width: &[f64], height: f64, left: f64) {
// Horizontal bars grow from `left`: pin the baseline in x.
self.sticky_x.push(left);
let face = self.next_cycle_color();
for (&yc, &w) in y.iter().zip(width.iter()) {
let patch = Patch::rectangle(left, yc - height / 2.0, w, height)
.facecolor(Some(face))
.edgecolor(Some(Rgba::BLACK));
self.add_patch(patch);
}
}
/// Fill the region between the curves `(x, y1)` and `(x, y2)`.
///
/// Builds one closed [`Patch::polygon`] tracing `(x, y1)` left-to-right then
/// `(x, y2)` right-to-left. The default face is a semi-transparent C0 blue
/// (alpha `0.4`) with no edge. Only the common prefix of the three slices is
/// used.
pub fn fill_between(&mut self, x: &[f64], y1: &[f64], y2: &[f64]) {
let face = self
.cycle_color(self.prop_cycle_index)
.with_alpha(FILL_ALPHA);
self.fill_between_face(x, y1, y2, face);
}
/// Fill the region between the curves `(x, y1)` and `(x, y2)` with an
/// explicit face `color`.
///
/// Like [`fill_between`](Axes::fill_between), but the property cycle is
/// not consulted and `color` is used exactly as given (no alpha is
/// applied; pass a translucent [`Rgba`] for the usual see-through band).
///
/// ```
/// use rizzma::core::{Bbox, Rgba};
/// use rizzma::figure::Axes;
///
/// let mut ax = Axes::new(Bbox::from_extents(0.0, 0.0, 1.0, 1.0));
/// let x = [0.0, 1.0, 2.0];
/// let lo = [0.0, 1.0, 0.5];
/// let hi = [1.0, 2.0, 1.5];
/// ax.fill_between_with_color(&x, &lo, &hi, Rgba::RED.with_alpha(0.3));
/// let limits = ax.data_limits().expect("the band contributes data limits");
/// assert_eq!((limits.ymin(), limits.ymax()), (0.0, 2.0));
/// ```
pub fn fill_between_with_color(&mut self, x: &[f64], y1: &[f64], y2: &[f64], color: Rgba) {
self.fill_between_face(x, y1, y2, color);
}
/// Shared body of the `fill_between` family: one closed polygon tracing
/// `(x, y1)` forward then `(x, y2)` back, filled with `face`, no edge.
/// Only the common prefix of the three slices is used.
fn fill_between_face(&mut self, x: &[f64], y1: &[f64], y2: &[f64], face: Rgba) {
let n = x.len().min(y1.len()).min(y2.len());
if n == 0 {
return;
}
let mut points: Vec<[f64; 2]> = Vec::with_capacity(2 * n);
for i in 0..n {
points.push([x[i], y1[i]]);
}
for i in (0..n).rev() {
points.push([x[i], y2[i]]);
}
let patch = Patch::polygon(&points)
.facecolor(Some(face))
.edgecolor(None);
self.add_patch(patch);
}
/// Fill the region between the curve `(x, y1)` and the line `y = 0`.
///
/// A convenience wrapper over [`fill_between`](Axes::fill_between) with the
/// lower curve fixed at zero.
pub fn fill_between_y0(&mut self, x: &[f64], y1: &[f64]) {
let zeros = vec![0.0; x.len().min(y1.len())];
self.fill_between(x, y1, &zeros);
}
/// Plot `y` against `x` as a piecewise-constant ("staircase") line.
///
/// Uses matplotlib's default `"pre"` step style: the value of `y[i]`
/// extends back to `x[i-1]`, so the vertical jump happens at the left edge
/// of each interval. Returns a mutable reference to the pushed [`Line2D`].
/// With fewer than two points the line is added unchanged.
pub fn step(&mut self, x: &[f64], y: &[f64]) -> &mut Line2D {
let n = x.len().min(y.len());
if n < 2 {
return self.plot(&x[..n], &y[..n]);
}
let (sx, sy) = step_pre(&x[..n], &y[..n]);
self.plot(&sx, &sy)
}
/// Draw a horizontal line segment at each value in `y`, from `xmin` to
/// `xmax`.
///
/// Each value yields one black [`Line2D`] segment.
pub fn hlines(&mut self, y: &[f64], xmin: f64, xmax: f64) {
for &yc in y {
self.add_line(Line2D::new(vec![xmin, xmax], vec![yc, yc]));
}
}
/// Draw a vertical line segment at each value in `x`, from `ymin` to `ymax`.
///
/// Each value yields one black [`Line2D`] segment.
pub fn vlines(&mut self, x: &[f64], ymin: f64, ymax: f64) {
for &xc in x {
self.add_line(Line2D::new(vec![xc, xc], vec![ymin, ymax]));
}
}
/// Add a full-width horizontal reference line at `y`.
///
/// The line spans the full resolved x range at draw time using the axes'
/// theme text color and a `1.0`-point width.
pub fn axhline(&mut self, y: f64) {
self.axhline_with(y, self.annotation_color, 1.0);
}
/// Add a styled full-width horizontal reference line at `y`.
///
/// The line is resolved against the current x limits at draw time.
///
/// 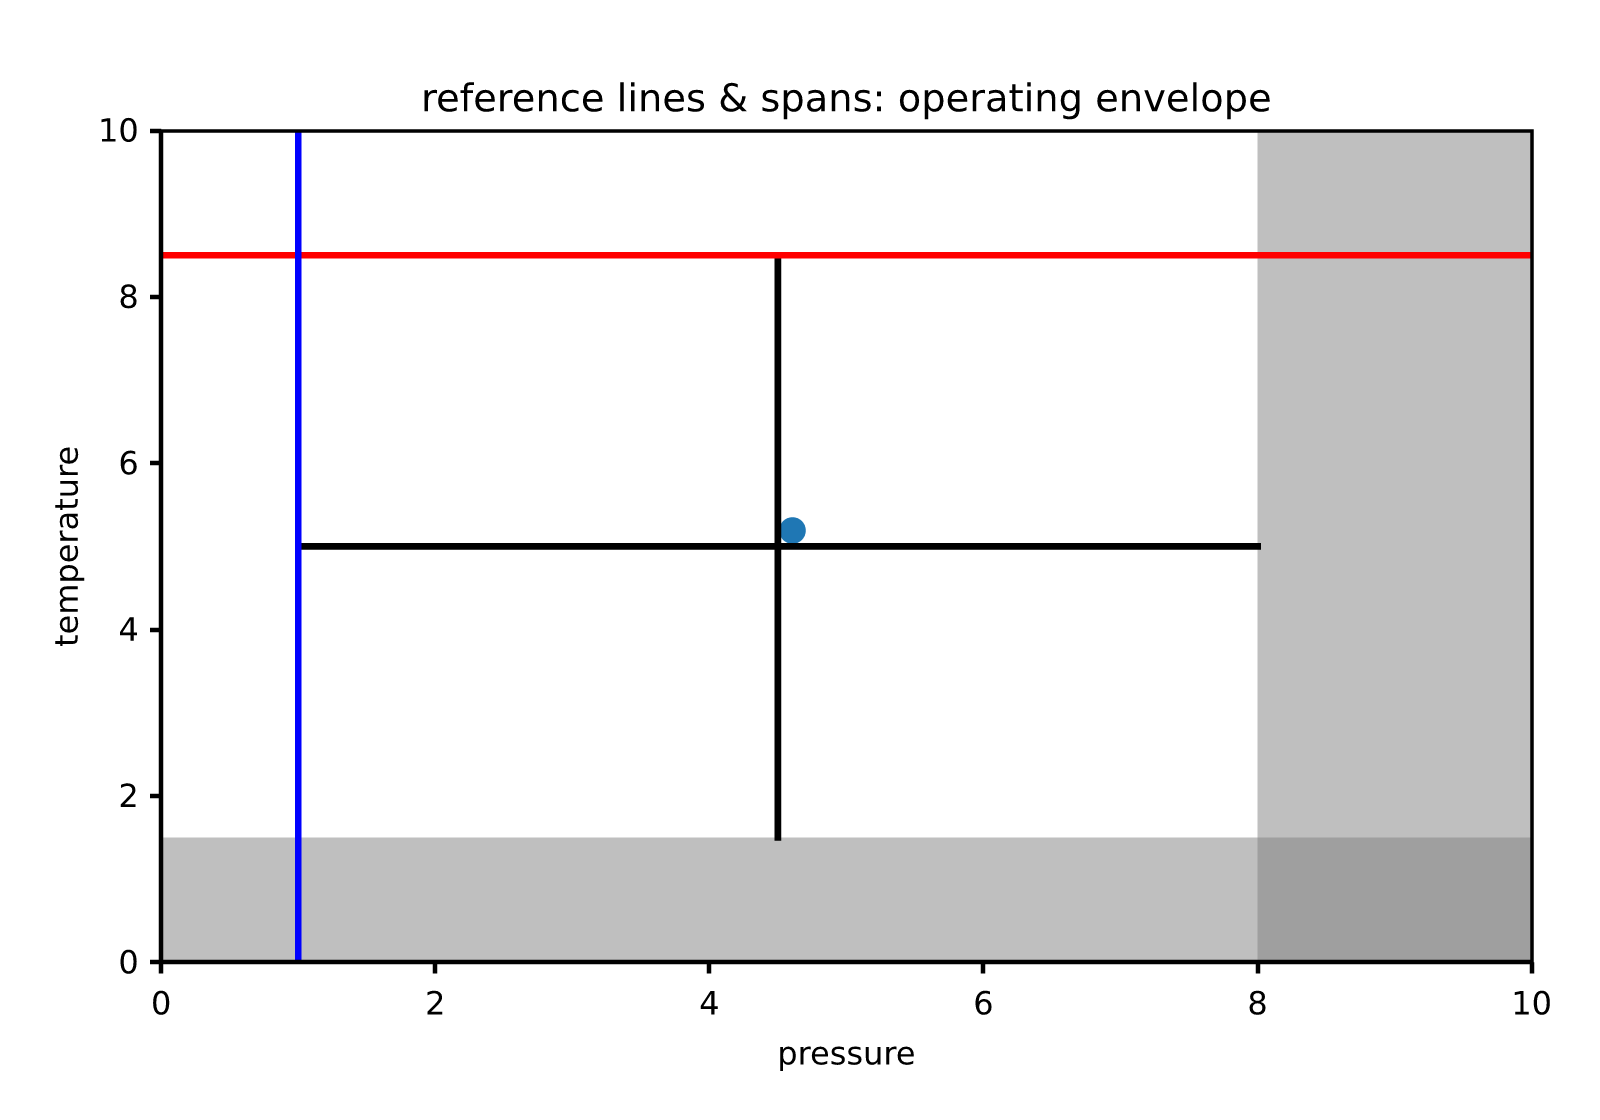
///
/// ```no_run
/// use rizzma::{Figure, core::Rgba};
/// let mut fig = Figure::new(4.0, 3.0);
/// fig.add_subplot(1, 1, 1).axhline_with(0.5, Rgba::RED, 2.0);
/// fig.save_png("reference_line.png")?;
/// # Ok::<(), Box<dyn std::error::Error>>(())
/// ```
pub fn axhline_with(&mut self, y: f64, color: Rgba, linewidth: f64) {
self.span_lines.push(SpanLine {
orientation: SpanOrientation::Horizontal,
value: y,
color,
linewidth,
});
}
/// Add a full-height vertical reference line at `x`.
///
/// The line spans the full resolved y range at draw time using the axes'
/// theme text color and a `1.0`-point width.
pub fn axvline(&mut self, x: f64) {
self.axvline_with(x, self.annotation_color, 1.0);
}
/// Add a styled full-height vertical reference line at `x`.
///
/// The line is resolved against the current y limits at draw time.
pub fn axvline_with(&mut self, x: f64, color: Rgba, linewidth: f64) {
self.span_lines.push(SpanLine {
orientation: SpanOrientation::Vertical,
value: x,
color,
linewidth,
});
}
/// Add a full-width horizontal shaded band between `ymin` and `ymax`.
///
/// The band spans the full resolved x range at draw time with a
/// semi-transparent gray fill.
pub fn axhspan(&mut self, ymin: f64, ymax: f64) {
self.span_rects.push(SpanRect {
orientation: SpanOrientation::Horizontal,
lo: ymin,
hi: ymax,
facecolor: Rgba::new(0.5, 0.5, 0.5, SPAN_ALPHA),
});
}
/// Add a full-height vertical shaded band between `xmin` and `xmax`.
///
/// The band spans the full resolved y range at draw time with a
/// semi-transparent gray fill.
pub fn axvspan(&mut self, xmin: f64, xmax: f64) {
self.span_rects.push(SpanRect {
orientation: SpanOrientation::Vertical,
lo: xmin,
hi: xmax,
facecolor: Rgba::new(0.5, 0.5, 0.5, SPAN_ALPHA),
});
}
}
#[cfg(test)]
mod tests {
use super::*;
use crate::artist::Artist;
use crate::core::Bbox;
#[test]
fn fill_between_with_color_uses_the_color_verbatim() {
let mut ax = Axes::new(Bbox::from_extents(0.0, 0.0, 1.0, 1.0));
let x = [0.0, 1.0, 2.0];
let lo = [0.0, 1.0, 0.5];
let hi = [1.0, 2.0, 1.5];
let ink = Rgba::RED.with_alpha(0.3);
ax.fill_between_with_color(&x, &lo, &hi, ink);
assert_eq!(ax.patches.len(), 1);
assert_eq!(ax.patches[0].face(), Some(ink));
// The default variant still tints the cycle color instead.
ax.fill_between(&x, &lo, &hi);
assert_eq!(
ax.patches[1].face(),
Some(ax.cycle_color(0).with_alpha(FILL_ALPHA))
);
}
fn approx(a: f64, b: f64) {
assert!((a - b).abs() < 1e-9, "expected {b}, got {a}");
}
#[test]
fn bar_adds_one_rectangle_per_height_with_correct_extents() {
let mut ax = Axes::new(Bbox::from_extents(0.0, 0.0, 1.0, 1.0));
let x = [0.0, 1.0, 2.0];
let h = [1.0, 3.0, 2.0];
ax.bar(&x, &h);
assert_eq!(ax.patches.len(), 3);
for (i, p) in ax.patches.iter().enumerate() {
let e = p.data_extents().expect("rectangle has extents");
// x - width/2 .. x + width/2 with the default width of 0.8.
approx(e.xmin(), x[i] - 0.4);
approx(e.xmax(), x[i] + 0.4);
// 0 .. h.
approx(e.ymin(), 0.0);
approx(e.ymax(), h[i]);
}
}
#[test]
fn fill_between_adds_one_polygon_covering_the_data() {
let mut ax = Axes::new(Bbox::from_extents(0.0, 0.0, 1.0, 1.0));
let x = [0.0, 1.0, 2.0];
let y1 = [1.0, 2.0, 1.5];
let y2 = [0.0, 0.5, -1.0];
ax.fill_between(&x, &y1, &y2);
assert_eq!(ax.patches.len(), 1);
let p = &ax.patches[0];
// The polygon is closed (first vertex repeated at the end).
let verts = p.path().vertices();
assert_eq!(verts.first(), verts.last());
let e = p.data_extents().expect("polygon has extents");
approx(e.xmin(), 0.0);
approx(e.xmax(), 2.0);
approx(e.ymin(), -1.0);
approx(e.ymax(), 2.0);
}
#[test]
fn step_pre_produces_expected_staircase_vertex_count() {
let x = [0.0, 1.0, 2.0, 3.0];
let y = [0.0, 1.0, 0.0, 1.0];
let (sx, sy) = step_pre(&x, &y);
// "pre" expands n points into 2n - 1 vertices.
assert_eq!(sx.len(), 2 * x.len() - 1);
assert_eq!(sy.len(), 2 * x.len() - 1);
}
#[test]
fn step_adds_a_single_line_through_axes() {
let mut ax = Axes::new(Bbox::from_extents(0.0, 0.0, 1.0, 1.0));
ax.step(&[0.0, 1.0, 2.0], &[0.0, 1.0, 0.0]);
assert_eq!(ax.lines.len(), 1);
}
#[test]
fn axhline_and_axvline_store_spans() {
let mut ax = Axes::new(Bbox::from_extents(0.0, 0.0, 1.0, 1.0));
ax.axhline(0.5);
ax.axvline(1.0);
assert_eq!(ax.span_lines.len(), 2);
assert_eq!(ax.span_lines[0].color, Rgba::BLACK);
assert_eq!(ax.span_lines[0].linewidth, 1.0);
}
#[test]
fn reference_lines_follow_theme_and_accept_explicit_style() {
let mut ax = Axes::new(Bbox::from_extents(0.0, 0.0, 1.0, 1.0));
ax.apply_rcparams(&crate::core::RcParams::dark());
ax.axhline(0.5);
ax.axvline_with(1.0, Rgba::RED, 3.5);
assert_eq!(
ax.span_lines[0].color,
crate::core::RcParams::dark().text_color
);
assert_eq!(ax.span_lines[1].color, Rgba::RED);
assert_eq!(ax.span_lines[1].linewidth, 3.5);
}
#[test]
fn axhspan_stores_a_span_rect() {
let mut ax = Axes::new(Bbox::from_extents(0.0, 0.0, 1.0, 1.0));
ax.axhspan(0.2, 0.4);
assert_eq!(ax.span_rects.len(), 1);
}
}