# Tutorial: a data-analytics spreadsheet
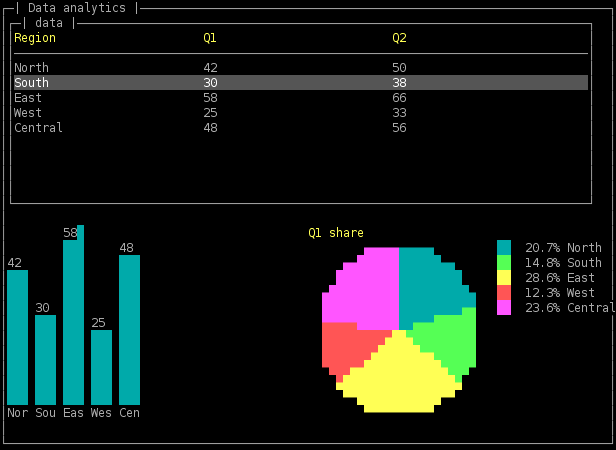
This guide builds a small terminal spreadsheet that loads a CSV, shows it in a
[`Table`](crate::Table), and summarises a column as a **histogram**
([`Barchart`](crate::Barchart)) and a **pie chart** ([`Piechart`](crate::Piechart))
— with **live editing** so changing a value redraws the charts.
The full, runnable source is [`examples/spreadsheet.rs`]; run it with
`cargo run --example spreadsheet` (optionally passing a CSV path). Here we walk
through it block by block.
[`examples/spreadsheet.rs`]: https://github.com/stricaud/gtcaca/blob/main/src/bindings/rust/gtcaca/examples/spreadsheet.rs
## 1. Hold the data
A spreadsheet is a grid of strings plus a header row. Keep it behind
`Rc<RefCell<…>>` so both the table's model and the event loop can reach it:
```rust
use std::cell::RefCell;
use std::rc::Rc;
struct Sheet {
headers: Vec<String>,
rows: Vec<Vec<String>>,
}
impl Sheet {
fn column_values(&self, col: usize) -> Vec<f32> {
self.rows.iter()
.map(|r| r.get(col).and_then(|c| c.parse().ok()).unwrap_or(0.0))
.collect()
}
fn labels(&self) -> Vec<String> {
self.rows.iter().map(|r| r.first().cloned().unwrap_or_default()).collect()
}
}
```
The first column is treated as a category *label*; the rest are numbers we can
chart.
## 2. Bridge the data to the Table
[`Table`](crate::Table) is *virtual*: it renders through a
[`TableModel`](crate::TableModel), asking for the row/column counts and each
cell on demand, so it never copies the grid and scales to huge sheets.
```rust
use gtcaca::TableModel;
# use std::{cell::RefCell, rc::Rc};
# struct Sheet { headers: Vec<String>, rows: Vec<Vec<String>> }
struct SheetModel(Rc<RefCell<Sheet>>);
impl TableModel for SheetModel {
fn row_count(&self) -> i64 { self.0.borrow().rows.len() as i64 }
fn headers(&self) -> Vec<String> { self.0.borrow().headers.clone() }
fn cell(&self, row: i64, col: i32) -> String {
self.0.borrow().rows.get(row as usize)
.and_then(|r| r.get(col as usize)).cloned().unwrap_or_default()
}
}
```
## 3. Lay out the window
Open the toolkit and split the inner rectangle: the table on top, the two charts
side by side underneath. [`Window::content`](crate::Window::content) returns the
inner area so you never hand-compute `x + 1` / `width - 2`.
```rust,no_run
# use gtcaca::{Gtcaca, Application, Window};
# fn f() -> Result<(), gtcaca::Error> {
let ctx = Gtcaca::init()?;
let app = Application::new(&ctx, "gtcaca spreadsheet");
let win = Window::fullscreen(&app, Some("Data analytics"));
let area = win.content(1);
let table_h = (area.height / 2).max(6);
let charts_y = area.y + table_h + 1;
let charts_h = (area.y + area.height - charts_y).max(6);
let half_w = area.width / 2;
# Ok(()) }
```
## 4. Create the widgets
```rust,no_run
# use gtcaca::{Table, Barchart, Piechart, color, Window, TableModel};
# fn f(win: &Window, model: Box<dyn TableModel>, area: gtcaca::Rect,
# table_h: i32, charts_y: i32, charts_h: i32, half_w: i32) {
let table = Table::new(win, area.x, area.y, area.width, table_h, model);
table.set_title("data");
let bars = Barchart::new(win, area.x, charts_y, half_w, charts_h);
bars.set_color(color::CYAN);
let pie = Piechart::new(win, area.x + half_w + 1, charts_y, area.width - half_w - 1, charts_h);
# }
```
## 5. Feed the charts from a column
One function recomputes both charts. The values/labels are copied into the
widgets, so there are no lifetimes to track. The bar chart shows the magnitude
per category; the pie shows the same numbers as proportions of the whole.
```rust
# use gtcaca::{Barchart, Piechart};
# use std::cell::RefCell;
# struct Sheet;
# impl Sheet { fn column_values(&self, _c: usize) -> Vec<f32> { vec![] }
# fn labels(&self) -> Vec<String> { vec![] } }
fn refresh_charts(sheet: &RefCell<Sheet>, bars: &Barchart, pie: &Piechart, col: usize) {
let s = sheet.borrow();
let values = s.column_values(col);
let labels = s.labels();
let refs: Vec<&str> = labels.iter().map(|s| s.as_str()).collect();
bars.set_data(&values, &refs);
pie.set_data(&values, &refs);
}
```
## 6. The render + input loop
Paint exactly the widgets you want — [`Gtcaca::clear`](crate::Gtcaca::clear),
`paint` each widget, [`Gtcaca::flush`](crate::Gtcaca::flush) — then block for a
key. The table consumes the arrows via [`Widget::send_key`](crate::Widget::send_key);
you handle the rest.
```rust,no_run
# use gtcaca::{Gtcaca, Widget, key};
# fn f(ctx: &Gtcaca, win: &impl Widget, table: &impl Widget,
# bars: &impl Widget, pie: &impl Widget) {
loop {
ctx.clear();
win.paint();
table.paint();
bars.paint();
pie.paint();
ctx.flush();
let Some(k) = gtcaca::poll_key(-1) else { continue };
match k {
k if k == b'q' as i32 => break,
key::UP | key::DOWN | key::LEFT | key::RIGHT => { table.send_key(k); }
_ => {}
}
}
# }
```
## 7. Edit a cell live
Pressing Enter edits the current cell with an [`Entry`](crate::Entry) minibuffer;
committing rewrites the value and recomputes the charts — a live analytics view.
[`Table::current_row`](crate::Table::current_row) /
[`current_col`](crate::Table::current_col) say which cell is selected.
```rust,no_run
# use gtcaca::{Gtcaca, Entry, Widget, key};
# fn edit(ctx: &Gtcaca, win: &impl Widget, table: &impl Widget,
# prompt: &Entry, set_cell: impl Fn(usize, usize, &str), refresh: impl Fn()) {
# let (row, col) = (0usize, 0usize);
prompt.set_text("current value");
prompt.set_focus(true);
loop {
ctx.clear();
win.paint(); table.paint(); prompt.paint();
ctx.flush();
let Some(k) = gtcaca::poll_key(-1) else { continue };
match k {
key::RETURN => { set_cell(row, col, &prompt.text()); break }
key::ESCAPE => break,
_ => { prompt.send_key(k); } // the Entry edits the text for us
}
}
prompt.set_focus(false);
refresh(); // redraw the histogram + pie from the new number
# }
```
That's the whole app: *model → widgets → recompute on change → custom draw
loop*. It's the same shape carscal (a full packet analyzer) uses at scale.


