
ruviz
High-performance 2D and 3D plotting for Rust. One builder, 29 plot types
(33 with the 3d feature), PNG / SVG / PDF output.




Demo
https://github.com/user-attachments/assets/bce842b5-50d8-43e4-893d-074bf6738975
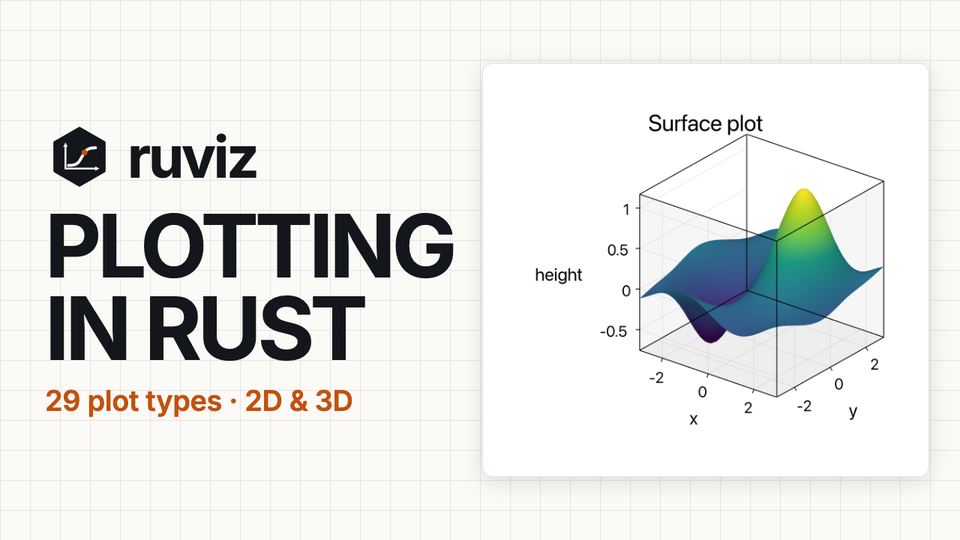
A 77-second tour: 29 plot types from one builder, the built-in themes, Typst mathematics and CJK text, 3D and animation, and the Python and WebAssembly bindings. Every figure in it is real ruviz output.
Install
[]
= "0.9.0"
Hello, plot
use *;

The one pattern
Plot::new() → series method(s) → setters → .save(path). That is the whole
API. There is no separate figure or axes object.
- Every call returns the builder, so the chain never branches.
- A setter placed after a series method styles that series (
.label,.color,.line_width,.marker). Plot-level setters (.title,.legend,.theme,.xlim) apply to the whole plot, wherever you put them. - Starting another series — or calling
.save()/.render()— finishes the previous series for you. Nothing to close.
use *;
Series methods
Every series method, complete. The one catalogued type missing here is
fill_between, which is an annotation rather than a series — see Styling.
&x / &data accept any numeric slice or Vec (&[f64],
&Vec<f64>, and ndarray / polars / nalgebra types with the matching feature).
Grid data differs by plot: heatmap takes nested rows (&Vec<Vec<f64>>), while
contour takes a flat row-major &Vec<f64> of x.len() * y.len() values.
| Call | Draws |
|---|---|
.line(&x, &y) |
line plot |
.scatter(&x, &y) |
scatter plot |
.bar(&["A", "B"], &values) |
bar chart |
.histogram(&data) |
histogram |
.boxplot(&data) |
box plot |
.heatmap(&data_2d) |
heatmap |
.kde(&data) |
kernel density estimate |
.ecdf(&data) |
empirical CDF |
.violin(&data) |
violin plot |
.boxen(&data) |
letter-value (boxen) plot |
.rug(&data) |
rug marks |
.strip(&categories, &values) |
categorical strip plot |
.swarm(&categories, &values) |
non-overlapping swarm plot |
.grouped_bar(&cats, &[("Q1", &q1), ("Q2", &q2)]) |
bars side by side per category |
.stacked_bar(&cats, &[("Q1", &q1), ("Q2", &q2)]) |
bars stacked per category |
.stacked_area(&x, &[("solar", &s), ("wind", &w)]) |
stacked areas over numeric x |
.pie(&values).labels(&["A", "B"]) |
pie chart |
.donut(&values) |
donut chart |
.radar(&labels).add_series("P1", &values) |
radar chart (repeat add_series) |
.polar_line(&r, &theta) |
polar line |
.contour(&x, &y, &z_flat) |
contour lines |
.area(&x, &y, baseline) |
filled area |
.hexbin(&x, &y) |
hexagonal binning |
.step(&x, &y, StepWhere::Pre) |
step plot (Pre / Post / Mid) |
.stem(&x, &y, baseline) |
stem plot |
.error_bars(&x, &y, &err) / .error_bars_xy(&x, &y, &xerr, &yerr) |
error bars, symmetric or on both axes |
.quiver(&x, &y, &u, &v) |
vector field |
.dendrogram(&linkage) |
hierarchical clustering tree |
Every one of them takes the same chain shape:
.<series>(..).label(..).color(..).legend_best().save(..).
Styling
| Scope | Setters |
|---|---|
| Series | .label("name") .color(c) .alpha(0.5) .line_width(2.0) .line_style(LineStyle::Dashed) |
| Point series | .marker(MarkerStyle::Circle) .marker_size(6.0) |
| Plot | .title(..) .xlabel(..) .ylabel(..) .grid(true) .xlim(0.0, 10.0) .ylim(..) |
| Plot | .xscale(AxisScale::Log) .yscale(..) .size(w, h) .size_px(w, h) .dpi(300) .font_family("Arial") |
| Legend | .legend(LegendPosition::UpperLeft) or .legend_best() |
| Annotations | .text(x, y, "note") .arrow(x1, y1, x2, y2) .hline(y) .vline(x) .fill_between(&x, &y1, &y2) |
Colors: Color::BLUE (and RED, GREEN, BLACK, WHITE, ORANGE, …),
Color::from_rgb(31, 119, 180), Color::from_hex("#1f77b4")?,
Color::from_palette(0) for the theme's cycle.
Markers: Circle, Square, Triangle, TriangleDown, Diamond, Plus,
Cross, Star.
Themes for .theme(..): Theme::light() (default), dark(), seaborn(),
publication(), minimal(), presentation(), ieee(), nature(),
paul_tol(), colorblind_friendly(). Theme::seaborn() reproduces
seaborn.set_theme(), and Theme::builder() customizes any of them.
See styling guide.
Math and CJK text: enable the typst-math feature and call .typst(true);
titles and labels then accept Typst math such as "$f(x) = e^(-x)$".
See QUICKSTART.
Output
| Call | Result |
|---|---|
.save("plot.png") |
PNG file |
.export_svg("plot.svg") |
SVG file (no feature flag needed) |
.save_pdf("plot.pdf") |
PDF file (pdf feature) |
.render() |
in-memory Image |
.render_png_bytes() |
Vec<u8> of PNG bytes |
.render_to_svg() |
SVG String |
On wasm targets use the in-memory calls (render_png_bytes, render_to_svg)
rather than the file-path ones.
Subplots
subplots(rows, cols, width, height) returns a SubplotFigure. Convert each
plot with .into() and place it by index:
use *;
plots::composite::jointplot(&x, &y, w, h) and pairplot(&columns, w, h)
also return a SubplotFigure.
3D (3d feature)
3D plots start from free functions — there is no Plot3D type:
scatter3d(&x, &y, &z), line3d(..), surface(&x, &y, &z_2d),
wireframe(..). They take .title(), .xlabel(), .zlabel() and .save()
like a 2D plot.
use *;
Gotchas
- No
Plot3D. Use the free functions above. fill_betweenis an annotation, not a series. It returns the plot, so it takes plot-level setters (.title), not series ones (.label).- Not available at all: 2D KDE, regression and residual plots have no builder method; Sankey diagrams and streamplots are not implemented. Anything outside the series table cannot be drawn.
- The top-level
line()/scatter()/bar()functions and theruviz::simplemodule are deprecated — use thePlotchain (migration note). - Build with
--release; debug builds are far slower.
Feature flags
Defaults: ndarray_support, parallel.
| Feature | Adds |
|---|---|
3d |
3D scatter, line, surface, wireframe |
ndarray_support / polars_support / nalgebra_support |
data-type support (aliases: ndarray, polars, nalgebra) |
pdf |
PDF export |
typst-math |
Typst text and math rendering |
interactive |
interactive window (alias: window); interactive-gpu adds GPU |
animation |
GIF recording |
gpu |
GPU types and .gpu(true) |
parallel / simd / performance |
threaded 3D rasterization, SIMD paths |
serde |
serializable themes and config |
full |
broad native feature set |
SVG export is always compiled in; the svg feature gates nothing. parallel
affects the software 3D rasterizer, not the 2D raster path — measure before
enabling performance (benchmarks).
Beyond the Rust crate
| GUI adapters | egui · Iced · Slint · GPUI |
| Bindings | Python · WebAssembly · JS/TS package |
Documentation
- Quick Start · User Guide · API docs
- Gallery — every plot type with runnable source
- Migrating from matplotlib or seaborn
- Examples:
cargo run --release --example doc_line_plot(seeexamples/)
License
Licensed under either of Apache-2.0 or MIT, at your option.