1
2
3
4
5
6
7
8
9
10
11
12
13
14
15
16
17
18
19
20
21
22
23
24
25
26
27
28
29
30
31
32
33
34
35
36
37
38
39
40
41
42
43
44
45
46
47
48
49
50
51
52
53
54
55
56
57
58
59
60
61
62
63
64
65
66
67
68
69
70
71
72
73
74
75
76
77
78
79
80
81
82
83
84
85
86
87
88
89
90
91
92
93
94
95
96
97
98
99
100
101
102
103
104
105
106
107
108
109
110
111
112
113
114
115
116
117
118
119
120
121
122
123
124
125
126
127
128
129
130
131
132
133
134
135
136
137
138
139
140
141
142
143
144
145
146
147
148
149
150
151
152
153
154
155
156
157
158
159
160
161
162
163
164
165
166
167
168
169
170
171
172
173
174
175
176
177
178
179
180
181
182
183
184
185
186
187
188
189
190
191
192
193
194
195
196
197
198
199
200
201
202
203
204
205
206
207
208
209
210
211
212
213
214
215
//! The [`Axes::pcolormesh`] colormapped-mesh helper.
//!
//! Mirrors matplotlib's `Axes.pcolormesh` for the regular-grid case: it builds a
//! unit `nrows x ncols` grid, colormaps the row-major cell values through a
//! [`LinearNorm`] and the default colormap, stores the resulting [`QuadMesh`]
//! on the axes, and returns a mutable handle. Meshes draw beneath the other
//! artists (see [`Axes::draw`](super::Axes::draw)) and their data-space extent
//! participates in autoscaling.
use crate::artist::QuadMesh;
use crate::core::color::{Colormap, LinearNorm, Normalize, default_colormap};
use crate::figure::Axes;
/// The finite min and max of `data`, or `(0.0, 1.0)` when there is no finite
/// value (empty or all-NaN input).
fn data_min_max(data: &[f64]) -> (f64, f64) {
let mut min = f64::INFINITY;
let mut max = f64::NEG_INFINITY;
for &v in data {
if v.is_finite() {
min = min.min(v);
max = max.max(v);
}
}
if min <= max { (min, max) } else { (0.0, 1.0) }
}
impl Axes {
/// Draw row-major scalar `c` (`nrows x ncols`) as a colormapped quad mesh.
///
/// The mesh is laid out on a regular unit grid (`x = 0..=ncols`,
/// `y = 0..=nrows`), so cell `(r, col)` spans data rectangle
/// `[col, col + 1] x [r, r + 1]`. The cell values `c` (row-major,
/// `c[r * ncols + col]`) are normalized through a [`LinearNorm`] with
/// `vmin`/`vmax` set to the finite data min/max, then mapped through the
/// default colormap to per-cell face colors. To retune the colors, build a
/// fresh [`QuadMesh`] and overwrite the returned handle.
///
/// The returned handle exposes the [`QuadMesh`] builder setters
/// ([`with_edgecolor`](QuadMesh::with_edgecolor),
/// [`with_zorder`](QuadMesh::with_zorder), …) for in-place restyling, e.g.
/// `*ax.pcolormesh(&c, nr, nc) = mesh.with_edgecolor(Some(Rgba::BLACK))`.
///
// TODO: a `pcolor`-style variant taking explicit x/y corner coordinates (an
// irregular grid) is a follow-up.
///
/// # Panics
///
/// Panics if `c.len()` is not exactly `nrows * ncols`.
///
/// # Examples
///
/// ```
/// use rizzma::core::Bbox;
/// use rizzma::figure::Axes;
///
/// let mut ax = Axes::new(Bbox::from_extents(0.0, 0.0, 1.0, 1.0));
/// // A 2x3 field; the unit grid spans x in [0, 3], y in [0, 2].
/// let c = [0.0, 1.0, 2.0, 3.0, 4.0, 5.0];
/// ax.pcolormesh(&c, 2, 3);
/// let limits = ax.data_limits().expect("mesh provides data limits");
/// assert_eq!((limits.xmin(), limits.xmax()), (0.0, 3.0));
/// assert_eq!((limits.ymin(), limits.ymax()), (0.0, 2.0));
/// ```
pub fn pcolormesh(&mut self, c: &[f64], nrows: usize, ncols: usize) -> &mut QuadMesh {
assert_eq!(
c.len(),
nrows * ncols,
"pcolormesh: c length {} must equal nrows * ncols = {}",
c.len(),
nrows * ncols
);
// Regular unit grid corners, row-major: (nrows + 1) * (ncols + 1) points.
let mut coordinates = Vec::with_capacity((nrows + 1) * (ncols + 1));
for r in 0..=nrows {
for col in 0..=ncols {
coordinates.push([col as f64, r as f64]);
}
}
// Colormap the cell values through LinearNorm + viridis.
let (vmin, vmax) = data_min_max(c);
let norm = LinearNorm::new(vmin, vmax);
let cmap = default_colormap();
let facecolors = c.iter().map(|&v| cmap.sample(norm.normalize(v))).collect();
let mesh = QuadMesh::new(nrows, ncols, coordinates, facecolors);
self.meshes.push(mesh);
self.meshes.last_mut().expect("just pushed a mesh")
}
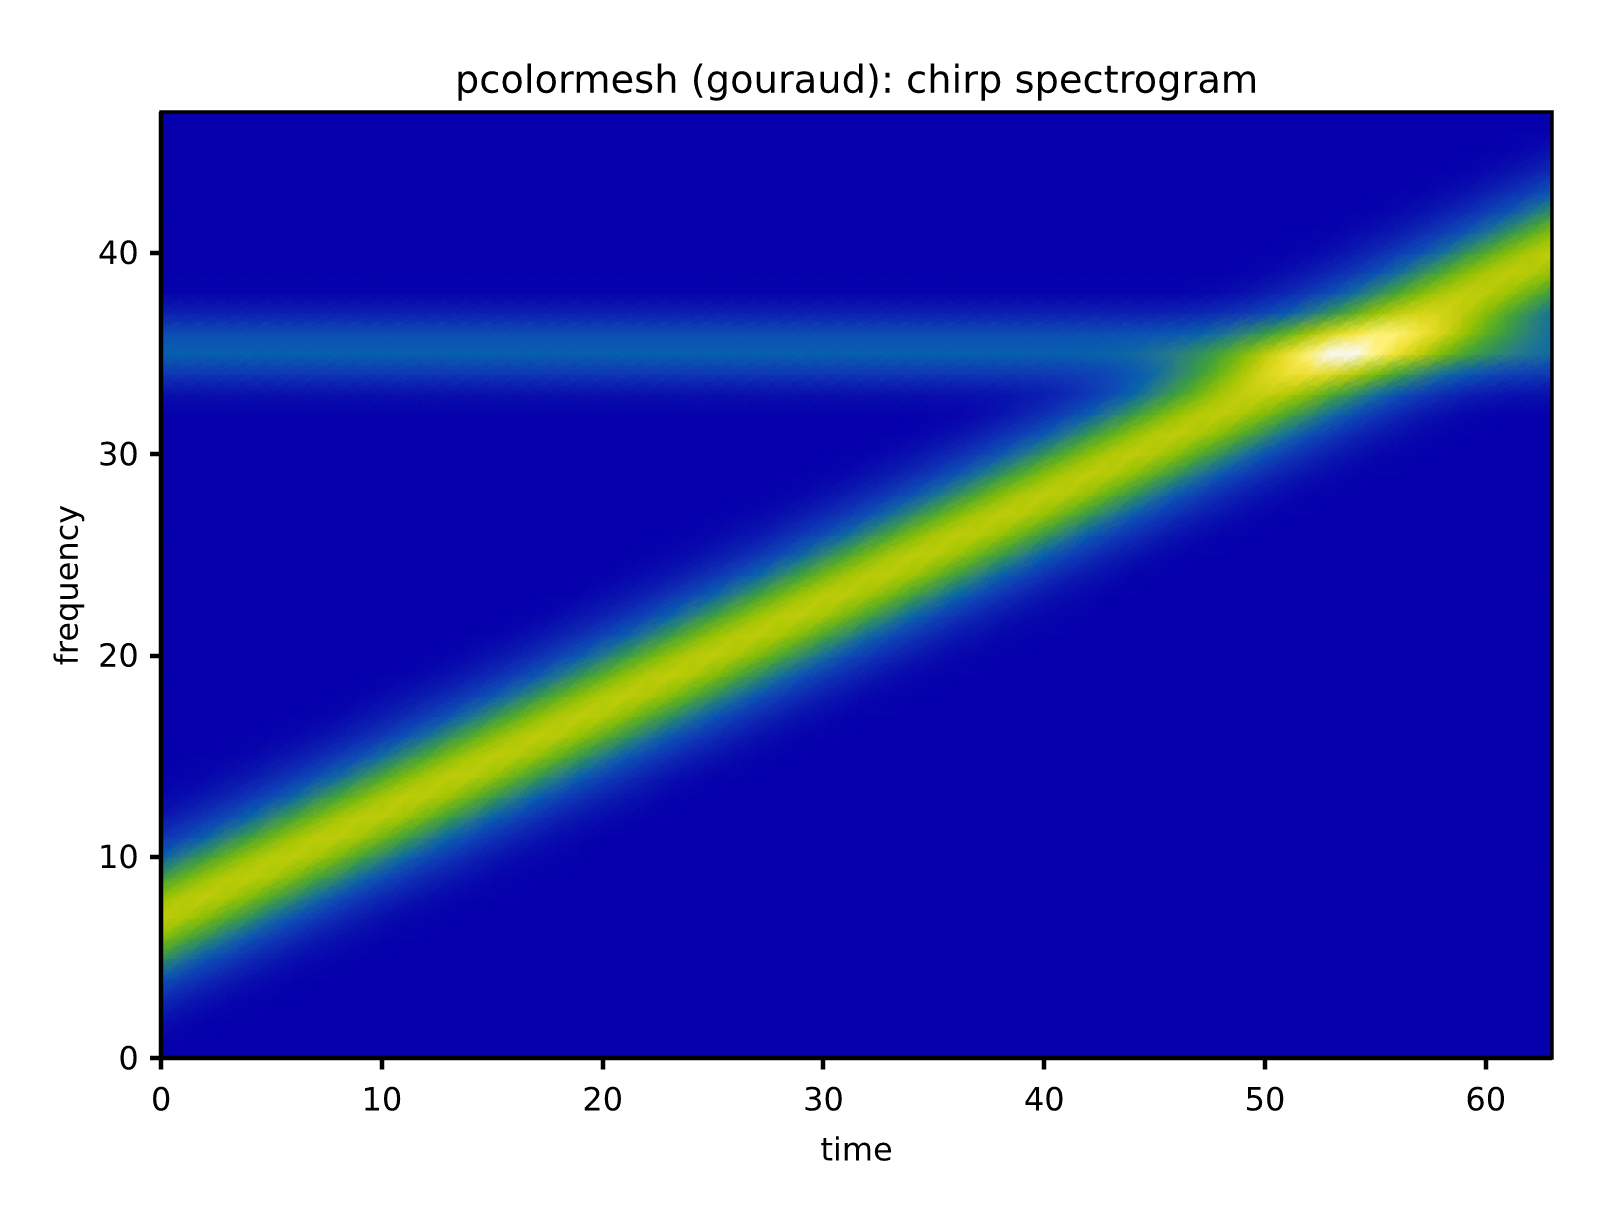
/// Draw a smoothly shaded pseudocolor mesh (matplotlib's
/// `pcolormesh(..., shading="gouraud")`).
///
/// Unlike [`pcolormesh`](Axes::pcolormesh), `c` is **vertex-centered**: the
/// row-major `nrows x ncols` values sit at the grid *corners* (integer
/// coordinates `x = 0..ncols-1`, `y = 0..nrows-1`), yielding
/// `(nrows - 1) x (ncols - 1)` cells whose colors interpolate smoothly
/// between the corner values instead of flat per-cell blocks. Values map
/// through a [`LinearNorm`] and the default colormap. Gouraud cells draw no
/// edges.
///
/// 
///
/// # Panics
///
/// Panics if `c.len()` is not exactly `nrows * ncols` or the grid is
/// smaller than `2 x 2`.
///
/// # Examples
///
/// ```
/// use rizzma::core::Bbox;
/// use rizzma::figure::Axes;
///
/// let mut ax = Axes::new(Bbox::from_extents(0.0, 0.0, 1.0, 1.0));
/// // 2x2 corner values: one smoothly shaded cell.
/// ax.pcolormesh_gouraud(&[0.0, 1.0, 2.0, 3.0], 2, 2);
/// let limits = ax.data_limits().expect("mesh provides data limits");
/// assert_eq!((limits.xmin(), limits.xmax()), (0.0, 1.0));
/// ```
pub fn pcolormesh_gouraud(&mut self, c: &[f64], nrows: usize, ncols: usize) -> &mut QuadMesh {
assert_eq!(
c.len(),
nrows * ncols,
"pcolormesh_gouraud: c length {} must equal nrows * ncols = {}",
c.len(),
nrows * ncols
);
assert!(
nrows >= 2 && ncols >= 2,
"pcolormesh_gouraud: needs at least a 2 x 2 grid of corner values"
);
// Corners at the value positions themselves: the cells sit between
// them, (nrows - 1) x (ncols - 1).
let (cell_rows, cell_cols) = (nrows - 1, ncols - 1);
let mut coordinates = Vec::with_capacity(nrows * ncols);
for r in 0..nrows {
for col in 0..ncols {
coordinates.push([col as f64, r as f64]);
}
}
let (vmin, vmax) = data_min_max(c);
let norm = LinearNorm::new(vmin, vmax);
let cmap = default_colormap();
let vertex_colors: Vec<_> = c.iter().map(|&v| cmap.sample(norm.normalize(v))).collect();
// Flat facecolors are required by the constructor but unused in
// gouraud mode.
let facecolors = vec![crate::core::color::Rgba::TRANSPARENT; cell_rows * cell_cols];
let mesh = QuadMesh::new(cell_rows, cell_cols, coordinates, facecolors)
.with_vertex_colors(vertex_colors);
self.meshes.push(mesh);
self.meshes.last_mut().expect("just pushed a mesh")
}
}
#[cfg(test)]
mod tests {
use crate::core::Bbox;
use crate::core::color::{Colormap, default_colormap};
use crate::figure::Axes;
#[test]
fn pcolormesh_sets_data_limits_to_grid() {
let mut ax = Axes::new(Bbox::from_extents(0.0, 0.0, 1.0, 1.0));
// A 2-row, 3-column field; the unit grid spans x in [0, 3], y in [0, 2].
ax.pcolormesh(&[0.0, 1.0, 2.0, 3.0, 4.0, 5.0], 2, 3);
let limits = ax.data_limits().expect("mesh provides data limits");
assert_eq!((limits.xmin(), limits.xmax()), (0.0, 3.0));
assert_eq!((limits.ymin(), limits.ymax()), (0.0, 2.0));
}
#[test]
fn min_and_max_cells_get_default_cmap_endpoints() {
let mut ax = Axes::new(Bbox::from_extents(0.0, 0.0, 1.0, 1.0));
// 2x2 with min = 0.0 (cell 0) and max = 3.0 (cell 3).
ax.pcolormesh(&[0.0, 1.0, 2.0, 3.0], 2, 2);
let cm = default_colormap();
let lo = cm.sample(0.0);
let hi = cm.sample(1.0);
let mesh = &ax.meshes[0];
let mut r = ColorRecorder::default();
crate::artist::Artist::draw(mesh, &mut r, &crate::core::Affine2D::identity());
// The first cell holds the minimum -> cmap(0); the last -> cmap(1).
assert_eq!(r.fills.first().copied().flatten(), Some(lo));
assert_eq!(r.fills.last().copied().flatten(), Some(hi));
}
/// A [`Renderer`] that records the fill color of each `draw_path` call.
#[derive(Default)]
struct ColorRecorder {
fills: Vec<Option<crate::core::color::Rgba>>,
}
impl crate::render::Renderer for ColorRecorder {
fn draw_path(
&mut self,
_gc: &crate::render::GraphicsContext,
_path: &crate::core::Path,
_transform: &crate::core::Affine2D,
fill: Option<crate::core::color::Rgba>,
) {
self.fills.push(fill);
}
fn canvas_size(&self) -> (f64, f64) {
(100.0, 100.0)
}
}
}