1
2
3
4
5
6
7
8
9
10
11
12
13
14
15
16
17
18
19
20
21
22
23
24
25
26
27
28
29
30
31
32
33
34
35
36
37
38
39
40
41
42
43
44
45
46
47
48
49
50
51
52
53
54
55
56
57
58
59
60
61
62
63
64
65
66
67
68
69
70
71
72
73
74
75
76
77
78
79
80
81
82
83
84
85
86
87
88
89
90
91
92
93
94
95
96
97
98
99
100
101
102
103
104
105
106
107
108
109
110
111
112
113
114
115
116
117
118
119
120
121
122
123
124
125
126
127
128
129
130
131
132
133
134
135
136
137
138
139
140
141
142
143
144
145
146
147
148
149
150
151
152
153
154
155
156
157
158
159
160
//! Multi-series grouped bar plotting on [`Axes`]:
//! [`grouped_bar`](Axes::grouped_bar).
//!
//! Mirrors matplotlib's grouped-bar idiom: several data series share a set of
//! groups, and within each group the series' bars sit side by side. Each bar is
//! translated into a [`Patch`] rectangle stored on the [`Axes`], so its extent
//! feeds autoscaling via [`data_limits`](Axes::data_limits). It lives alongside
//! the other plotting helpers but is split out to keep
//! [`plotting`](super::plotting) focused on the Tier-1 line/patch methods.
use crate::artist::Patch;
use crate::core::color::Rgba;
use crate::figure::Axes;
/// Total width (in data units) occupied by all bars of one group, leaving a
/// `0.2` gap between adjacent groups (matplotlib's grouped-bar convention).
const GROUP_WIDTH: f64 = 0.8;
impl Axes {
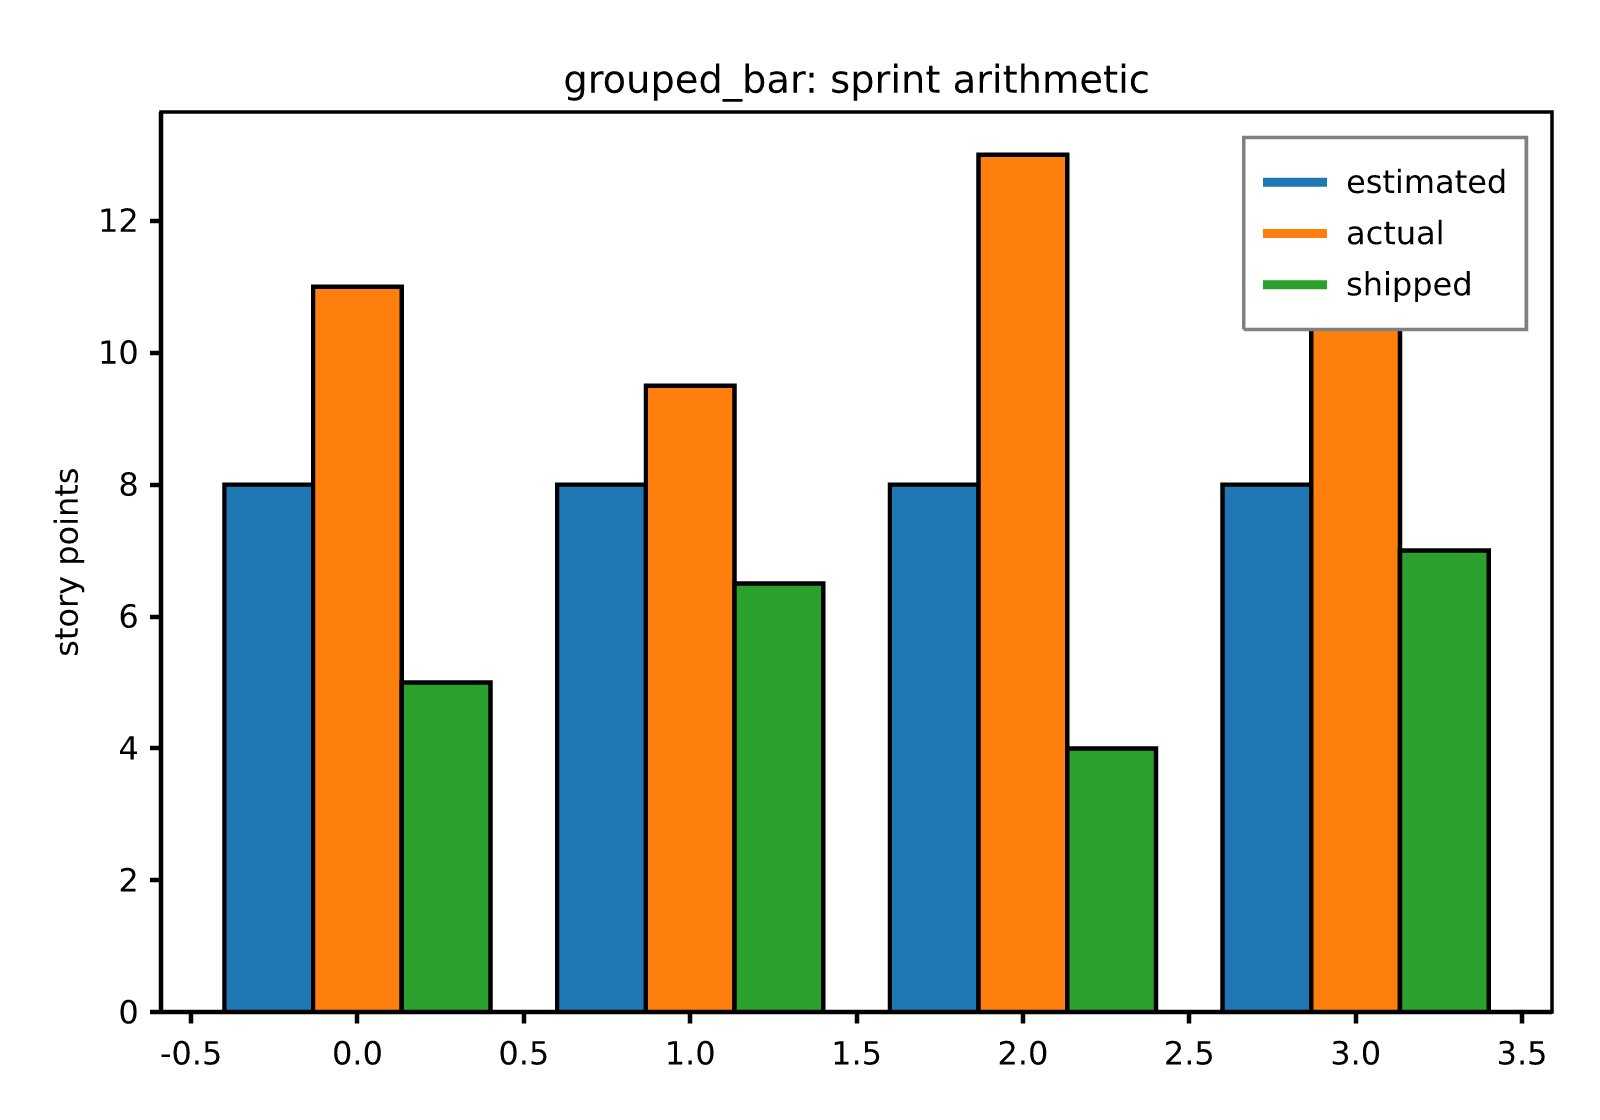
/// Draw a multi-series grouped bar chart.
///
/// `series` holds `M` data series, each with one value per group. The groups
/// are centered at `x = 0, 1, 2, …`; only the common prefix length `N` of the
/// series is used (ragged input is clamped, never panicking). The total group
/// width is `0.8`, so each bar is `0.8 / M` wide; within group `i`, series
/// `j`'s bar is centered at `x = i + (j - (M - 1)/2) * bar_width`, rising from
/// `0.0` to `series[j][i]` (negative values draw downward). Series `j` takes
/// property-cycle color `j`, advancing the cycle once per series, with a black
/// edge. The bars fold into [`data_limits`](Axes::data_limits) so autoscale
/// fits the full grouping. Empty input draws nothing.
///
/// 
///
/// ```
/// use rizzma::core::Bbox;
/// use rizzma::figure::Axes;
///
/// let mut ax = Axes::new(Bbox::from_extents(0.0, 0.0, 1.0, 1.0));
/// let a = [1.0, 2.0, 3.0];
/// let b = [3.0, 2.0, 1.0];
/// ax.grouped_bar(&[&a, &b]);
/// let limits = ax.data_limits().expect("grouped_bar contributes data limits");
/// // Two series of width 0.4 each; the leftmost bar edge sits at -0.4.
/// assert!((limits.xmin() - -0.4).abs() < 1e-9);
/// assert_eq!(limits.ymin(), 0.0);
/// assert_eq!(limits.ymax(), 3.0);
/// ```
pub fn grouped_bar(&mut self, series: &[&[f64]]) -> &mut Self {
let m = series.len();
if m == 0 {
return self;
}
// Common group count: the shortest series (clamp ragged input).
let n = series.iter().map(|s| s.len()).min().unwrap_or(0);
if n == 0 {
return self;
}
let bar_width = GROUP_WIDTH / m as f64;
let offset0 = (m as f64 - 1.0) / 2.0;
for (j, s) in series.iter().enumerate() {
let face = self.next_cycle_color();
for (i, &h) in s.iter().take(n).enumerate() {
let center = i as f64 + (j as f64 - offset0) * bar_width;
let patch = Patch::rectangle(center - bar_width / 2.0, 0.0, bar_width, h)
.facecolor(Some(face))
.edgecolor(Some(Rgba::BLACK));
self.add_patch(patch);
}
}
self
}
}
#[cfg(test)]
mod tests {
use super::*;
use crate::core::Bbox;
fn approx(a: f64, b: f64) {
assert!((a - b).abs() < 1e-9, "expected {b}, got {a}");
}
#[test]
fn grouped_bar_produces_m_times_n_patches() {
let mut ax = Axes::new(Bbox::from_extents(0.0, 0.0, 1.0, 1.0));
let a = [1.0, 2.0, 3.0, 4.0];
let b = [4.0, 3.0, 2.0, 1.0];
let c = [2.0, 2.0, 2.0, 2.0];
ax.grouped_bar(&[&a, &b, &c]);
// 3 series × 4 groups = 12 bars.
assert_eq!(ax.patches.len(), 12);
}
#[test]
fn grouped_bar_bar_width_is_group_over_m() {
let mut ax = Axes::new(Bbox::from_extents(0.0, 0.0, 1.0, 1.0));
let a = [1.0, 1.0];
let b = [1.0, 1.0];
let c = [1.0, 1.0];
let d = [1.0, 1.0];
ax.grouped_bar(&[&a, &b, &c, &d]);
// M = 4 → bar width = 0.8 / 4 = 0.2.
let bbox = ax.patches[0].path().get_extents();
approx(bbox.width(), GROUP_WIDTH / 4.0);
}
#[test]
fn grouped_bar_series_are_horizontally_offset() {
let mut ax = Axes::new(Bbox::from_extents(0.0, 0.0, 1.0, 1.0));
let a = [5.0, 5.0];
let b = [5.0, 5.0];
let c = [5.0, 5.0];
ax.grouped_bar(&[&a, &b, &c]);
// Bars are emitted series-major: series 0 fills the first N patches,
// series 1 the next N, etc. In group 0, series 0's bar must sit left of
// series (M-1)'s bar.
let first_series_group0 = ax.patches[0].path().get_extents();
let last_series_group0 = ax.patches[2 * 2].path().get_extents();
assert!(
first_series_group0.xmin() < last_series_group0.xmin(),
"series 0 should be left of the last series within a group"
);
}
#[test]
fn grouped_bar_negative_value_draws_downward() {
let mut ax = Axes::new(Bbox::from_extents(0.0, 0.0, 1.0, 1.0));
let a = [-3.0];
ax.grouped_bar(&[&a]);
let e = ax
.data_limits()
.expect("grouped_bar contributes data limits");
// A negative height extends the rectangle below the baseline.
approx(e.ymin(), -3.0);
approx(e.ymax(), 0.0);
}
#[test]
fn grouped_bar_ragged_input_clamps_to_shortest() {
let mut ax = Axes::new(Bbox::from_extents(0.0, 0.0, 1.0, 1.0));
let a = [1.0, 2.0, 3.0];
let b = [4.0, 5.0];
ax.grouped_bar(&[&a, &b]);
// N = min(3, 2) = 2 groups, so 2 series × 2 = 4 bars (no panic).
assert_eq!(ax.patches.len(), 4);
}
#[test]
fn grouped_bar_empty_input_draws_nothing() {
let mut ax = Axes::new(Bbox::from_extents(0.0, 0.0, 1.0, 1.0));
ax.grouped_bar(&[]);
assert!(ax.patches.is_empty());
let empty: [f64; 0] = [];
ax.grouped_bar(&[&empty]);
assert!(ax.patches.is_empty());
}
}