
RadBeeper
A GQ GMC-320 Plus Geiger–Müller counter on the desk, read from Alpine Linux — and from Copal, its distillation.
MIT · 0.1.0 · cargo install radbeeper · one dependency, and it is libc
The program is a Rust crate at the root of this repository — Cargo.toml,
Cargo.lock, src/. The one-file python3 original is still here beside it:
it is the oracle the port is checked against byte for byte, and it still owns
export, site, recompute, window, --plain and --source sim, which
have no Rust counterpart yet. (hotplug did until it was ported — it is the
verb the desktop autostart runs.) §10
is the whole arrangement.
You need a GQ GMC-320 Plus plugged into a USB port. The counter is a
USB-serial device: plug it into a machine running Alpine — including a VM the
counter is shared into over USB pass-through — switch the counter on, and
RadBeeper finds it, shows what it is counting, pulls the history it recorded
while nobody was watching, and builds a web page out of the result. Fork this
repository, drop your own logs into logs/, and a GitHub Action regenerates
that page on every push. §1 is the full list of what has to
be true; the Python program's --source sim draws the whole monitor with no
hardware at all.
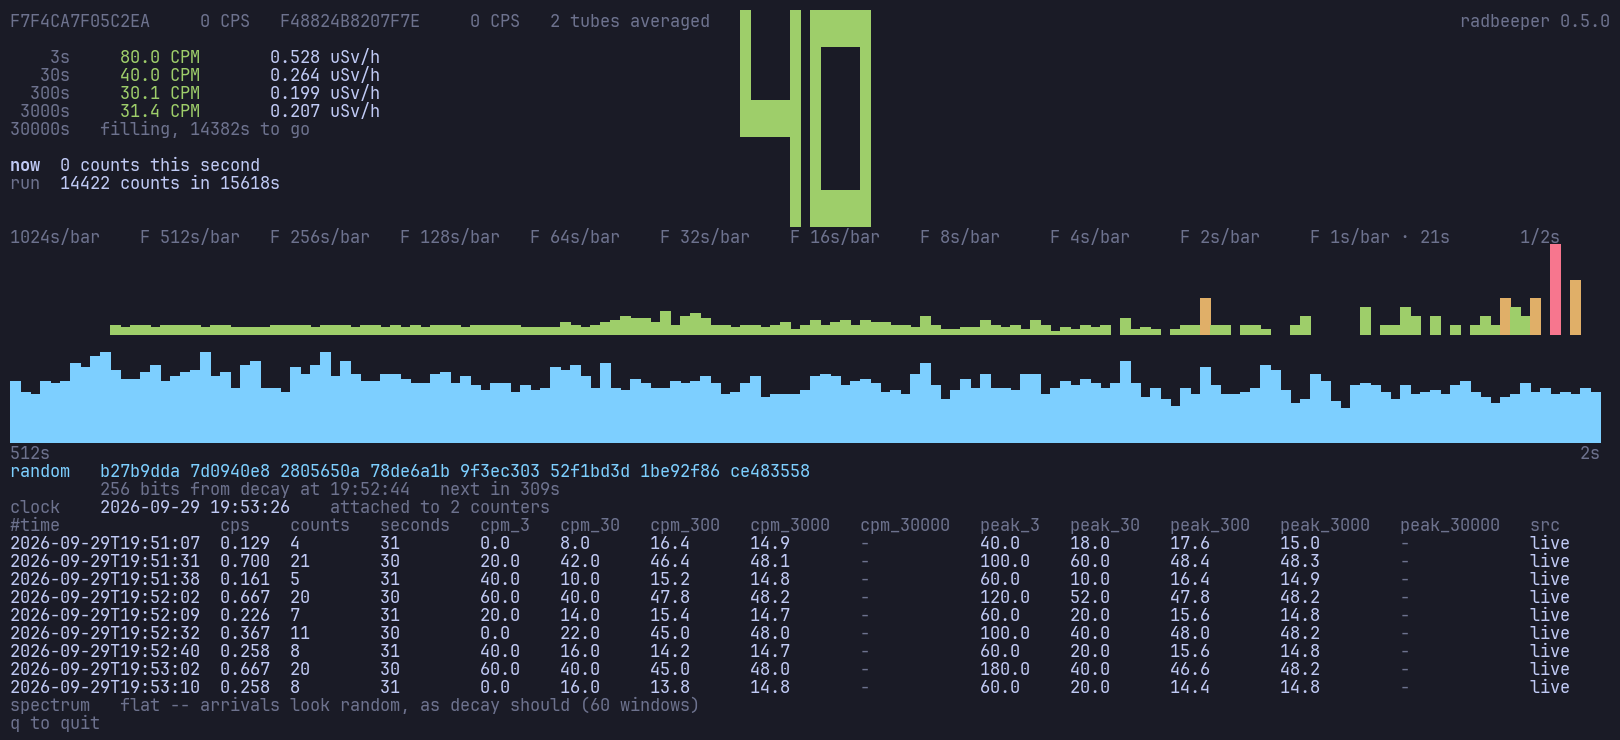
Twenty seconds of it, at ten times speed. Seconds 300 to 320 of a real session against the counter these logs came from, one frame a second:

The 3-second window swings between 0 and 120 CPM while the 5-minute one moves between 40.0 and 41.2 — which is the whole argument for keeping five of them. The 5-minute window arrives two seconds in, at 302 s, having had nothing to say until then; the 50-minute one is still counting down and will be for another forty-five minutes, and the working-day window will be for another eight hours. The bars recolour as individual seconds land, the spectrum stays flat, and there is no random line yet — the pool is still measuring the source, and its countdown ticks from 187 s to 165 s across these twenty seconds.
Fast track
No packages and nothing to compile — the install is a copy of one stdlib Python
file. The dialout line is not optional: the serial node is root:dialout and
RadBeeper does not want root.
Then, with the GMC-320 Plus plugged in and switched on:
That is the whole of it. If probe finds nothing it says which of four things
went wrong, and they have four different fixes — §1 is the
list of what has to be true. No counter yet?
radbeeper --source sim --sim-cpm 400 watch draws the entire monitor against a
synthetic Poisson background, which is a real one: decay is a Poisson process.
That verb is the Python program's — a cargo install radbeeper does not carry
it. What the Rust build has instead is tests/fake_gmc.py, which puts a
counter on a pseudo-terminal and exercises the serial path as well as the
display: python3 tests/fake_gmc.py --cpm 400, then radbeeper -d /dev/pts/N watch.
1. What you need
A GQ GMC-320 Plus, plugged into USB. That is the hardware, and there is no
substitute for it in software: RadBeeper reads a real tube over a real serial
port, and every number on the screen comes off the wire. Without a counter
plugged in there is nothing to read — though --source sim will draw the whole
monitor against a synthetic Poisson background if you want to see it working
before yours arrives.
| The counter | A GQ GMC-320 Plus. The 320 is what this was written against and what every screenshot here is. A GMC-300 works — RadBeeper tries its 57600 baud as well as the 320's 115200 — and a 500 or 600 will be found and read, but its tube is not an M4011, so give it --cpm-per-usvh (see The tube factor). |
| The cable | The USB cable that came with it. The socket on the counter is USB-C on a Plus and micro-B on older units, and it is easy to grab a charge-only cable by mistake: one that carries no data leaves you at Troubleshooting case 1 with nothing plugged in as far as Linux is concerned. |
| The counter, switched on | The USB-serial chip inside is powered by the counter, not by the bus. A 320 that is off, or flat, enumerates as nothing. |
A kernel with ch341 |
The 320 Plus presents as a CH340 USB-serial device. linux-lts and linux-rpi carry the driver; Alpine's linux-virt does not, which is the single most common reason a counter that is plugged in cannot be found. Copal installs the linux-lts Alpine package, so a Copal machine has the driver already. |
Membership of dialout |
The serial node is root:dialout and RadBeeper does not want root. |
Plug it in, and Linux should say so:
| If /dev/ttyUSB0 is there, you are done — radbeeper probe in §3
will identify it. If it is not, Troubleshooting names the four
things it can be and they have four different fixes.
USB pass-through counts. These logs were taken from a 320 Plus shared into a
VM, and the counter cannot tell the difference. What the VM's kernel needs is the
same ch341 — pass the device through to a guest running linux-virt and it will
never appear, no matter how correct the pass-through is. This is exactly the
trap Copal avoids by installing the linux-lts Alpine package rather than
the virt kernel a VM image would otherwise default to: the counter appears
because the driver is there to claim it.
2. Install
No packages, no build. The program is one stdlib Python file and the install is a copy:
make install takes PREFIX=. On Alpine you need python3 and nothing more.
There is a native build too — cargo install radbeeper, or a static binary off
the releases page for a machine with no toolchain — and it is now the
implementation. probe, cpm, watch, service, random, backfill, log and hotplug
are native; export, site, recompute, --plain and --source sim are
still the Python and are the reason it is still here.
§10 is that story.
Add yourself to dialout, or the serial node will not open:
3. Find the counter
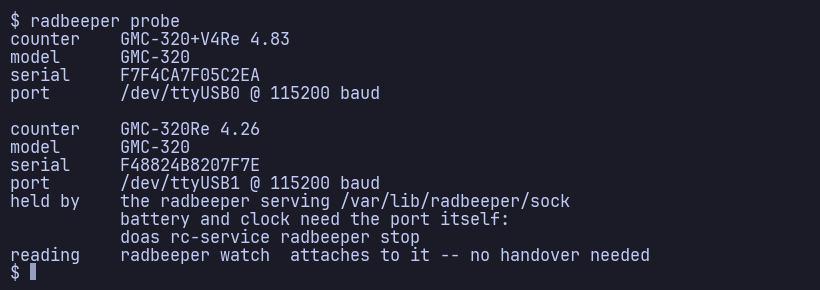
If it finds nothing, the message says which of four things went wrong, because they have four different fixes — see Troubleshooting.
4. Watch it
Five panels, top to bottom.
The number, big
The 30-second CPM in twelve-row block digits, to the right of the serial. 3 s is too jumpy to read as a headline and 300 s too slow to react to anything you are doing with your hands, so the middle window is the one that gets the size. The three horizontal bars are drawn two rows thick — a one-row bar between three-row uprights reads as a scratch at this scale. It needs no font: the digits are made from the same block glyph the charts are.
Five averages, because one is not enough
The counter's own reading is a rolling 60-second count: one number, one time constant, one question answered. RadBeeper counts the blips itself and keeps five windows at once, each a factor of ten apart. The row labels are seconds — that is what the program is actually averaging over — so here is what each of them is in units anybody thinks in:
| Window | In plain time | What it is for |
|---|---|---|
| 3 s | three seconds | Too short to be a measurement. On a 40 CPM background it swings between 0 and 80, because at this rate three seconds is two counts. Watch it to see a source come and go under your hand; do not write it down |
| 30 s | half a minute | The shortest window that is a count rather than a flicker. Settled enough to compare two places, quick enough to follow your hands. This is the number in the big digits, and the one radbeeper cpm reports |
| 300 s | five minutes | A number worth writing down |
| 3000 s | fifty minutes | What the background here actually is, once the day's traffic through the room has averaged out |
| 30000 s | 8 h 20 m — a working day | Not a slower answer to the same question: the only window that spans a shift. A day that was different is visible against it as a difference |
Each is ten times the one above, and ten times is roughly what it takes for the next one to be telling you something the last one wasn't. Going further would be free — the windows keep running sums, so a span costs the same eight microseconds a sample whatever its length — but 300000 s is three and a half days, and nothing on a desk stays still that long.
radbeeper cpm no longer asks the counter for its own number. <GETCPM>>
returns the device's internal 60-second count, and that is a different time
constant from everything else here: the big digits are the 30 s window, so the
two disagreed by more than the noise with neither of them wrong. cpm now
counts the blips itself and prints its own 30 s average, on the same terms as
every other window — nothing until it is full, a note on stderr while it waits,
and the answer alone on stdout so it still pipes.
--spans takes the list, so --spans 1,10,60 is a different set of three
questions. Every window is a column in the log, whatever you choose. The
animation at the top is twenty seconds of exactly this: the
3-second window swinging 0 to 80 while the 300-second one holds 41.
A window shows nothing until it is full, and says how long it still needs:

A three-second CPM built from one sample is twenty times noisier than it looks, and drawing it as though it were settled is how a 25 CPM background reads as 60 and somebody goes hunting for a leak.
The counts, five rows of them
One column per second, five rows tall. One row of block glyphs has eight levels, which is enough to say something happened and not enough to say how much; five rows have forty. Coloured by the same calm / raised / high bands as the numbers above it — a column is one second, so its count times sixty is the rate it implies, and a spike that reads red up there reads red down here without anyone converting in their head.
The spectrum, where flat is the good answer

Radioactive decay is a Poisson process, and the power spectrum of a Poisson process is flat — white noise, every frequency carrying the same expected power. A healthy counter watching background therefore produces no shape at all, and that featureless strip is the useful result: a statement that nothing periodic is happening.
It earns its place on the other case. A peak means something is arriving on a schedule, and decay does not have a schedule — mains hum on the tube's supply, a fan carrying a source past, a loose connector, firmware that batches its reporting. In the time domain every one of those looks exactly like more counts.
It accumulates. One periodogram of a Poisson process is flat in expectation and violently noisy in fact — every bin an exponential variable whose standard deviation equals its own mean. Averaging N of them divides that scatter by √N, so a real line climbs out of the grass while the grass settles. Windows are half-overlapped (Welch rather than Bartlett), which gets two averages out of each window's data instead of one.
Sigma alone is not a reason to believe anything, and this is the trap the panel is most likely to fall into. Sigma is computed for one bin, but the eye picks the tallest of 127, and the largest of many draws is far bigger than any single draw. One bin of an N-window average is Gamma(N)/N; asking how high B draws of it reach means solving N(r − 1 − ln r) = ln B, and expanding that gives
chance max ≈ 1 + √(2·ln B / N) + ⅔·ln B / N
At two windows that is 5.4×. So a bin at 4.9×, reading as a confident five sigma, is below what a perfectly healthy counter produces every time you look. At twenty-eight windows the same arithmetic gives 1.86×, and 4.9× is then overwhelming. The headline compares against that:
spectrum   flat -- arrivals look random, as decay should (28 windows)
spectrum   peak at 8s, 9.4x the mean (chance gives 1.86x), 7.2 sigma
The leading term is the square root, and leaving it out cost a year of false alarms. This used to compute the bar as 1 + ln(B)/N, which is the correct answer for one periodogram — a single bin of white noise is exponential, and the largest of B of those does land near ln(B) above the mean — and the wrong one for an average of N, whose tail is not exponential at all. The two agree only at N = 1. Everywhere else the old form was too low, and it got worse the longer you watched: the bar sinks like 1/N while the real peak only sinks like 1/√N, so the two cross over.
Measured against a null built from this counter's own recorded counts, resampled i.i.d. so the spectrum is flat by construction and every flag is a false one:
| Watching for | Old bar | Real median peak | Called suspect |
|---|---|---|---|
| 30 minutes | 2.13× | 2.51× | 33% |
| 1 hour | 1.52× | 1.97× | 64% |
| 2 hours | 1.25× | 1.64× | 80% |
The longer the session, the more reliably it cried wolf — and a health check that fires four times in five on healthy hardware is not a health check, it is a decoration. "Called suspect" is the rule the panel actually applies, which wants a peak at 1.25× the bar rather than merely above it; that margin is the only reason the first row is a third and not a half, given that the median peak has already overtaken the old bar. With the square-root term restored the same null stays under 1% at every length.
Raising the bar did not cost the detection it is there for. The same null with a period-8 s source added on top — Poisson arrivals at a fraction of the background rate, which for this counter is 0.73 counts a second, about 44 CPM:
| Source at | Peak after 30 min | Called at 30 min | at 1 h | at 2 h |
|---|---|---|---|---|
| 0.2 × background | 2.7× | 2% | 2% | 11% |
| 0.3 × background | 3.0× | 19% | 50% | 92% |
| 0.4 × background | 4.5× | 65% | 98% | 100% |
| 0.5 × background | 6.4× | 95% | 100% | 100% |
The detection floor is a real number, and it sits between a third and a half
of background. Half the counts arriving on a schedule is unmissable inside
half an hour. A fifth of them is invisible at every length, and no threshold
would fix that: half an hour at 44 CPM is thirteen hundred arrivals, and the
line is not in them to be found. radbeeper and the Rust build were both wrong
in the same way and are both fixed; chance_max()'s two quoted values, 5.4×
and 1.86×, have a test pinning them in each.
Resolution grows with time, because it has to. Frequency resolution is 1/T for an observation of length T — you cannot resolve a 512-second period in 128 seconds of listening. Rather than pick one, RadBeeper runs a ladder: 128, 256 and 512 seconds side by side, fed the same samples. The 128 answers after two minutes; the 512 takes eight and a half but resolves four times as finely, and by the time it has anything to say it is the better answer. It costs about ten kilobytes, fixed for the life of the process.
The axis runs from long periods on the left to short on the right (2 s, the Nyquist limit), and the bars are coloured by significance rather than height.
The random line
256 bits of hex, out of decay timing, refreshed whenever the pool has earned them — see §6.
Line output, for a pipe or a log
--plain gives one line per second instead of the full-screen monitor, and is
what you get automatically when stdout is not a terminal:

No counter on the desk?
Every command runs against a built-in source, and it is a real one — decay is a Poisson process, so the simulator draws Poisson samples. Variance equals the mean, which is exactly the property that makes the 3-second average jump and the 300-second one sit still.
5. Log it to disk
One row every 30 seconds into a dated file per counter:
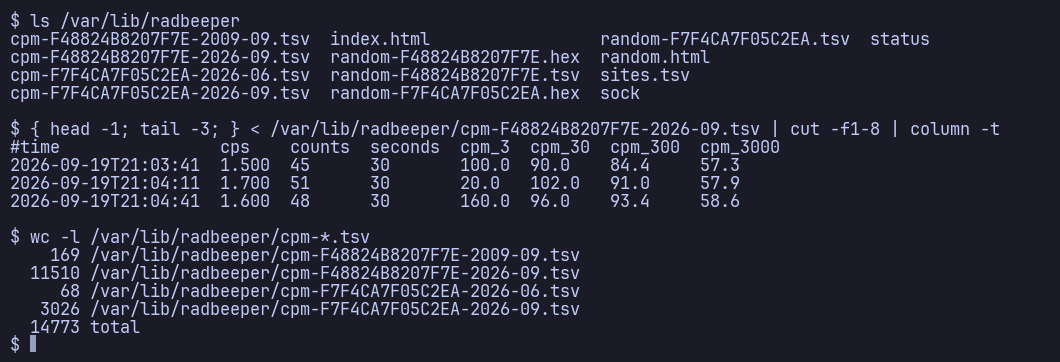
| Column | |
|---|---|
time |
first and big-endian, so sort cpm-*.tsv is chronological with no flags |
cps |
counts per one second, whatever the row spacing |
counts, seconds |
so the division can be checked, and a short row is obviously short |
cpm_3 … cpm_3000 |
one column per window, empty until that window is full |
peak_3 … peak_3000 |
the highest each window reached since the last row |
src |
live if this machine measured it, flash if reconstructed |
site |
where the counter was at that row's own time |
The peaks are the point. A row carrying only the averages as they stood at the instant it was written would miss a source that came and went between two rows — which is the one event actually worth having a log for.
Tabs are invisible and that matters here, because an empty field is not a zero — it is a window that was not full yet:

State lives in /var/log/radbeeper when that is writable and
~/.local/share/radbeeper when it is not. Files rotate by month and by counter
(cpm-<serial>-YYYY-MM.tsv), which needs no cron entry and nothing that renames
a file while a service is appending to it.
As a boot service
Copal — the Alpine distillation this was
written on — carries RadBeeper as stage 10, which installs an OpenRC service and
a udev rule alongside the linux-lts kernel that makes the counter visible in
the first place. Dormant is the normal state: with no counter plugged in the service writes down why and exits
0 — a stopped service, not a crash loop.
radbeeper hotplug is the other half: it sits in your desktop session and opens
the monitor when a counter appears — at login if one is already there, and on
plug-in at any point after.
6. Random numbers out of decay
The moment a nucleus decays is not determined by anything, which makes a counter the textbook hardware entropy source.
b17c9c60 d5deeb7b 4b102dfc bec14efc b523818b 18d3ada0 582bd912 e61ff856

  256 bits, min-entropy 258 measured, from 448 seconds at 0.68 counts/s
  440 bits is what a Poisson model would have claimed for the same 448 seconds
  spectrum flat -- the source looks like decay
  recorded in /var/log/radbeeper/random-F48824B8207F7E.tsv
That second line is the point: on this run the model would have handed over the same sixty-four characters after 260 seconds and called them 256 bits.
Three ways this normally goes wrong, and what is done instead.
Not from the FFT. A transform is linear and invertible — it moves information about, it does not make any. Worse, these coefficients come from a mean-subtracted, Hann-tapered window, so neighbouring bins are correlated by construction. Bits pulled from them would look beautiful and carry far less than they appear to. The entropy is in the counts; the spectrum is a view of them.
Not by XOR and rotation. Shifting and XOR-ing a block rearranges what is in it. A block holding twenty bits of entropy holds twenty bits after any amount of barrel-shifting, while looking more and more convincing. The tool for condensing a lot of weakly-random data into a little strongly-random data is a cryptographic hash — SHA-256 is in the standard library and is faster than the shifting.
Not proven by a flat spectrum. Flatness is necessary and nowhere near sufficient: a counter, an LFSR and a square wave at the Nyquist rate all pass it. It is used as a health check — a peak means something periodic is contaminating the arrivals — and an emission is marked suspect when it fails. Nor does the spectrum add anything: the FFT is a deterministic function of the same samples, and H∞(f(X)) ≤ H∞(X) for any deterministic f.
The bits are measured, not modelled — and the model was wrong. This used to compute min-entropy as −log₂ max_k P(k) for Poisson at the observed rate, which is the textbook thing to do and is not what the data supports. Across 1,128 recorded samples from a GMC-320Re the variance is 2.54× the mean; Poisson requires 1.00. Empty seconds are 36% more common than the model allows and the tail runs far past it — five counts in a second happens fourteen times too often. Every pool is over-dispersed on its own, so it is not a mixture of quiet and busy periods, and high seconds fall next to each other about 1.6× as often as independence permits. Ground-level coincidences will do that.
Over-dispersion piles the distribution onto its mode, and the mode is exactly what min-entropy is about, so the model was claiming 1.15 bits a second where the samples support 0.62. What is used now is NIST SP 800-90B's most-common- value estimator: the observed frequency of the commonest value, pushed to the far end of its 99% confidence interval so the entropy is a lower bound rather than a point estimate.
| Poisson model | measured | |
|---|---|---|
| bits per second | 1.150 | 0.618 |
| seconds for 256 bits | 223 | ≈ 415 |
A line therefore arrives about half as often as it used to, and the number on it is one the data will support. A dead counter never becomes ready, however long it sits there — and neither does a counter stuck at exactly one count a second, which the Poisson model would have credited with half a bit a second for having an ordinary-looking mean.
There is a page for this. radbeeper export writes
random.html beside the index: the counts drawn against the model, the bits
accumulating second by second with the target line across them, what the serial
link's one-second resolution costs, and every emission with the counts behind
it.
What the interface costs. <HEARTBEAT1>> gives two bytes once per second
and nothing finer, so one sample is one integer and that is the entire raw
material. If the link reported the time of each arrival instead, the gap
between two would be exponential, and quantised to a millisecond it would carry
about 10 bits per arrival — roughly 8 bits a second at this background,
against the 0.62 actually available. GQ's protocol has no such message:
<GETCPS>> and the heartbeat both answer with a count, never a timestamp. The
limit is the interface, not the tube.
Reproducible is not the same as predictable. The counts behind each line are
written beside it in random-<serial>.tsv, so anyone can recompute it and check
it was not invented:
That is an audit trail. It says nothing about the next line, which comes from decays that have not happened yet.
Treat this as a good physical entropy source, not a certified one. It has not been through a statistical test battery, and 256 bits of accounted min-entropy is a claim about the model of the source, not a proof about the output.
7. Backfill from the counter's own memory
The counter records to its flash whether or not anything is listening. When the service starts it reads the tail of that flash and fills the log's gaps.
- One row per slot. A row is identified by the log interval it falls in, so a backfill can never write over a live measurement, and a slot with no evidence stays absent. Nothing is interpolated across a gap.
- The counter's second is measured, not assumed. It is 1.011 of ours on the unit this was written against — 39 seconds of drift an hour — so the spacing is taken from each pair of timestamps in the recording.
- The flash is a ring. On a counter that has been running a while there is no unwritten byte in it: the newest sample sits just before the write pointer. Reading the physical tail would hand back the oldest hours while claiming they were the newest.
8. Say where it is
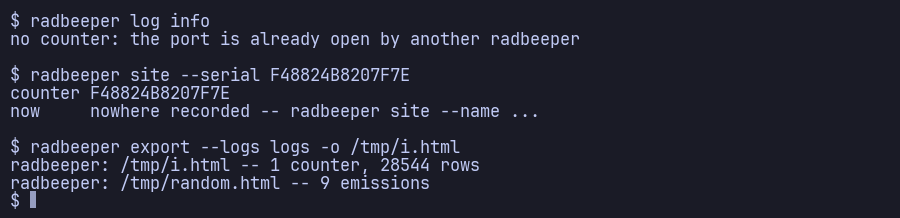
A reading without a place is half a measurement, and these get carried about — so
the place is a property of a serial number over time, appended to sites.tsv
and never overwritten. A reading from last Tuesday resolves to where the counter
was last Tuesday.
It records a name and nothing finer, on purpose. These logs get published; a place name is what a reader needs, while a decimal fix is a street address for whoever is holding the counter. Nothing is assumed either: until you record a place, the column is empty.
9. Publish it
One self-contained page: a how-to, summary cards, a log-scale plot of counts per minute by the hour, a by-day table and the latest rows. No JavaScript, no web fonts, no CDN — the chart is SVG the program draws itself, and the full record is one link away as the file it already lives in.
random.html is written beside it whenever there are emissions to account
for, and the index links to it. It is the one claim on the front page a reader
cannot check by looking — 256 bits out of decay — so the audit gets its own
page: the counts drawn against the Poisson model that used to be assumed, the
bits accumulating second by second with the target across them, what the serial
link's one-second resolution costs against timestamped arrivals, and every line
emitted with the counts behind it. --no-random-page turns it off.
To put it on the web: fork this repository, copy your cpm-*.tsv,
random-*.tsv and sites.tsv into logs/, and push.
.github/workflows/pages.yml rebuilds both pages and commits them back, so
GitHub Pages serves them with no build step. There is nothing to install in the
workflow — the generator is this same file, which is also why the pages cannot
drift from the log format.
10. The native build
This is where new work goes now. The one-file Python is the original, and
it is now the archive: it is kept as the differential oracle, as the owner of
the parts that have no Rust counterpart yet, and because it runs on a fresh Pi
with python3 and nothing else. Every top-level function and class in it carries
a # PORT: line saying which Rust file and which Rust name replaced it, or
saying plainly that nothing has:
# PORT: replaced by src/analysis.rs :: Ladder (renamed) -- new/add/best, …
# PORT: NOT PORTED. `export` is the largest thing still owned by this file.
The renames all run one way, towards shorter names inside a module that already
names the subject — SpectrumLadder → analysis::Ladder, LogWriter →
log::Writer, log_header → log::header, write_entropy →
entropy::write_record, spans_arg → parse_spans. Everything else kept its
name; classes became structs with the same methods. The one shape change worth
knowing is Counter.samples(), a generator, becoming
Counter::next_sample(timeout), which is pulled rather than yielded.
That is the whole install: crates.io builds it and drops the binary in
~/.cargo/bin/radbeeper, which cargo already put on your PATH. Nothing is
installed system-wide and nothing needs root.
No toolchain on the machine? Take a static binary from the releases — musl, so one file runs on Alpine, on Debian and on a Pi with no libc to match:
v=0.1.0; t=aarch64-unknown-linux-musl # or x86_64-…, armv7-…, arm-… for a Zero
Every release is cut from a tag by .github/workflows/release.yml — the tag
has to match the version in the manifest or nothing is published, and crates.io
is reached over GitHub's OIDC identity rather than an API key stored here.
RELEASING.md is the procedure.
This repository is that crate. Cargo.toml, Cargo.lock and src/ sit
at the root, which is where copal-build and every other tree in this account
put them; the crate carries the read side natively: probe, cpm
and the full monitor — the same five time constants, coloured counts chart,
accumulating spectrum ladder and twelve-row digits. One dependency, libc,
because a serial port is termios and termios is libc; the FFT, the digits and
the drawing are arithmetic and escape codes.
The one-file Python program is still at the root beside it, still runnable,
and its own targets are prefixed: make py-test, make py-check,
make py-install.
A full probe against the counter takes 82 ms and the binary is 400 KB.
Going native, one piece at a time
service, backfill, export, site, random, recompute and hotplug
are still Python, and the binary says so if you ask it for one. They are being
ported. Two implementations of a file format is how a file format acquires
two dialects, so the port is arranged around one rule: nothing counts as
ported until both programs produce the same characters on the same input.
tests/test_differential.py is that rule. It drives
examples/format_oracle.rs and the Python's own functions with identical
directives and compares the output byte for byte — not equivalent, identical.
It skips rather than fails where there is no Rust toolchain, because the
Python suite has to run on a machine with nothing installed.
There is a second half to it, and it is the one that matters more: the Rust
service is run against the counter and the Python's own reader parses what
it wrote — same header, same columns, same meaning for an empty field, one
row per slot across a restart, and the file still chronological under plain
sort. Comparing strings tests one end of a format. Reading the file with the
other implementation tests both.
radbeeper service --logs DIR is what makes that testable at all; without it
the only way to exercise the logger is against the machine's real log.
The entropy pool was the one place a difference would have been silent. A
log row that disagrees between the two is at least visible in the file; a
digest that disagrees is sixty-four characters of hex that look exactly as
random either way, and the only thing that would ever notice is somebody
running --check a year later and being told their audit trail is a lie. So
the Rust recomputes every line this counter has ever emitted — real
emissions recorded by the Python before any of the Rust existed — and gets the
same digests. If its SHA-256, its NUL framing, its integer formatting of the
opened second or its nibble packing were off by one byte, not one of them
would match.
is empty, character for character. SHA-256 is written out by hand — sixty
lines, no dependency — and checked against the FIPS 180-4 vectors, the
million-a vector and the 55/56-byte cases that catch a padding path which
has only ever seen one block.
The Rust monitor also has the random line and its countdown now, which it never had at all.
The history decoder is where GQ's document is wrong twice, so it gets the
most testing of anything here: thirteen constructed images covering truncation
mid-record, corrupt timestamps, notes, erased flash, marker bytes appearing as
ordinary counts and the measured-interval median — and then
tests/fixtures/flash-gmc320re.bin, 16 KiB cut out of this counter's own
flash at a timestamp marker. 82,084 records off a 96 KiB read decode
identically in both. Then the whole chain end to end: backfill --image
through both command lines, into a fresh log, and the two files compared byte
for byte — 394 rows, decoder to merge, identical.
It earned its place on the first run. Python's %g — which formats the
seconds column and every span in the header, and which Rust has no formatter
for — picks scientific notation from the exponent the value has after
rounding to six significant figures. Taking it from the unrounded value prints
999999.5 as 1000000 where C and Python print 1e+06. One character, in a
column nobody reads, in a file whose one promise is that sort on it is
chronological.
| native now | probe, cpm (its own 30 s window, not the device's 60 s one), watch, service, random, random --check, backfill and log info/log pull; the log format; the entropy pool, the SP 800-90B estimator and SHA-256; the history decoder with both corrections to GQ's published format, the wrapped-ring search and the measured sample intervals; local time, which Rust's standard library does not have at all |
| next | export — the two pages. Biggest and most mechanical, and the only one with no correctness risk beyond "the HTML differs" |
| the rule | one dependency, still libc. It has strftime, strptime and mktime, so the port does not need a date crate; the one primitive that must be written out is SHA-256 |
Nothing about this is a reason to hurry the Python out: it runs on a machine with no toolchain and no network, which is the whole reason it has no dependencies.
Where the speed actually was. The monitor's budget is one sample a second
and Python used a fraction of a percent of it, so this is about start-up and
footprint rather than throughput. The one genuinely slow path was backfill,
and that was an algorithm — fixed in the Python for a 7× win before any of this
was written.
Troubleshooting
1. No serial node. /dev/ttyUSB* does not exist. Four causes, in the order
they are worth checking — the first three are the counter's end and cost nothing
to rule out (§1):
- The counter is switched off. Its USB-serial chip runs off the counter's own battery, not the bus, so a flat or powered-down 320 enumerates as nothing.
- A charge-only USB cable. Very common, and indistinguishable from a dead
port until you try another cable.
dmesgstays silent. - Nothing is actually plugged in. Worth the glance.
- The running kernel has no USB-serial driver. Alpine's
linux-virtships none — noch341, nousbserial— so a counter plugged into a VM running it can never appear as/dev/ttyUSB0, anddmesgis silent because nothing ever claims the device.linux-ltsandlinux-rpicarry the drivers, and Copal installslinux-lts, so this case does not arise there:apk add linux-ltsand reboot is the fix on a plain Alpine that has it wrong.
dmesg | tail separates them: a working cable into a switched-on counter on a
kernel with ch341 says ch341-uart converter now attached to ttyUSB0. Silence
means the device was never seen; a ch341 line with no node means the driver is
missing.
2. Permission denied. The node is root:dialout. doas adduser $USER dialout, then log in again.
3. Something is there but is not a GMC. A CH340 is a generic USB-serial cable and plenty of things that are not Geiger counters use one.
4. The port is busy. Only one program can read a serial device sensibly — two
readers share the bytes between them and neither is told — so RadBeeper locks the
port. doas rc-service radbeeper stop hands it over. The service waits on the
lock rather than giving up, so the log picks up again by itself when you close
the monitor.
Reference
Commands
probe |
find the counter and say what it is |
watch |
the monitor; --plain for line output |
cpm |
one 30-second average, for a script. Takes 30 s, and says so |
service |
monitor and log; dormant when there is nothing to read |
hotplug |
sit in the session, open the monitor on plug-in |
backfill |
fill the log's gaps from the counter's flash |
random |
256 bits from decay timing, with the accounting for it |
recompute |
fill long-window columns in existing logs from their own counts |
site |
where a counter is, and where it has been |
export |
build index.html from the logs |
log info / log pull |
how much history flash, and download it |
Options: --source sim, --sim-cpm, --seed, --spans 3,30,300,
--cpm-per-usvh, --log-every, --duration, --clock-offset,
--backfill-bytes, --max-gap, --entropy-bits, --device, --baud.
The tube factor
µSv/h is CPM divided by a number that belongs to the tube, not the counter.
The default, 151.5, is the M4011 in a GMC-320. A 500 with a different tube needs a
different number, which is why it is --cpm-per-usvh and not a constant buried in
the arithmetic.
Protocol
Commands are ASCII <NAME>>; replies are raw bytes with no framing, so every read
asks for an exact count and times out rather than blocking.
| Command | Reply |
|---|---|
<GETVER>> |
14 bytes, e.g. GMC-320Re 4.26 |
<GETSERIAL>> |
7 bytes |
<GETCPM>> |
2 bytes, big-endian |
<GETCPS>> |
2 bytes, mask 0x3FFF |
<HEARTBEAT1>> |
then 2 bytes every second until <HEARTBEAT0>> |
<GETVOLT>> |
1 byte, tenths of a volt |
<GETDATETIME>> |
7 bytes |
<SPIR[addr][len]>> |
len bytes of history flash |
Baud is 115200 on the 320 and 57600 on the 300; RadBeeper tries both.
There is no pyserial. Alpine packages it, but this runs on a Pi Zero with 512 MB
and on a fresh install with no network, and a serial port is thirty lines of
termios.
Two corrections to GQ's published history format, both measured against a full
1 MiB image from a GMC-320Re 4.26. The datetime record is nine bytes, not ten.
And 55 AA 01 is a three-byte marker carrying no payload, not a two-byte
count: reading it as one invented 1,701 readings between 256 and 21,930 counts per
second on a tube that saturates three orders of magnitude below that. log pull
writes the raw flash image before decoding it, which is why both were fixable
against data already on disk.
Speed
The monitor's budget is one sample a second and it uses a fraction of a percent of
it — a 512-point FFT is 0.5 ms, once every few minutes. The one place that ever
mattered was backfill, and it turned out to be an algorithm rather than a
language: each window re-summed its own tail on every sample, O(samples × window),
which cost 16.5 s to turn 850,000 samples into 28,000 rows — 765 million
additions. Keeping a running sum and subtracting what falls out the back is O(1)
per sample. Same output, byte for byte, in 2.3 s instead of 16.5.
Tests
tests/fake_gmc.py serves a fake GMC-320 on a pseudo-terminal, so the serial path
— termios, exact-length reads, command framing, the heartbeat stream, the chunked
history download — is tested without a counter on the desk. It also runs
standalone:
The full-screen monitor is tested too, on a 132×46 pty, because it only runs when stdout is a terminal and two bugs shipped in the part nothing was executing.
The screenshots
Every image in docs/screenshots is a recording, not a picture. tools/record.py
runs the program under a pseudo-terminal, logs every byte it writes with a
timestamp, and replays that through a small VT emulator into a grid of cells,
which is then drawn with one rectangle per block glyph and one glyph per
character. tools/promo.py drives it.
Two consequences worth having. A screenshot cannot claim something the
program does not do — the log-format shot found that busybox sed ignores
\x escapes, because the recording showed the escape instead of the arrow.
And the monitor shots are one session: the hero, the filling shot, the
spectrum strip and the twenty-second animation are four moments of the same
380-second run against the counter, so the numbers in them agree with each
other because they are the same numbers.
tools/record.py inventory <cast> prints the escape sequences a recording
actually contains. The emulator implements that list and nothing else, so a
future ncurses emitting something new shows up there rather than as a quietly
wrong pixel.
And it is tested, in tests/test_record.py, because a bug in a terminal
emulator does not raise an exception — it publishes a picture of something the
program never drew. One did: on a screen busy enough for ncurses to decide
scrolling was cheaper than redrawing, it emits CSI T inside a scroll region,
and an emulator that ignores DECSTBM puts every row below the scroll point in
the wrong place. It drew the random line five rows up, on top of the spectrum.
The program was correct; the picture of it was not.
MIT License — Copyright (c) 2026 Paul Richeson