<!DOCTYPE html>
<html lang="en">
<head>
<meta charset="UTF-8">
<title>Plox Graph</title>
<script src="https://cdn.plot.ly/plotly-2.32.0.min.js"></script>
<style>
body { font-family: sans-serif; margin: 20px; }
html, body {
height: auto;
overflow-y: scroll;
}
.plot-panel { margin-bottom: 10px; }
.plot-controls {
display: flex;
justify-content: space-between;
align-items: center;
font-family: sans-serif;
margin-bottom: 5px;
}
.plot-title {
font-weight: bold;
font-size: 14px;
white-space: nowrap;
}
.plot-toolbar {
display: flex;
gap: 4px;
}
.plot-toolbar button {
background: white;
border: 1px solid black;
padding: 3px 6px;
font-family: monospace;
font-size: 12px;
cursor: pointer;
transition: background 0.2s ease;
}
.plot-toolbar button:hover {
background: black;
color: white;
}
</style>
</head>
<body>
<div id="plot-container">
<div class="plot-wrapper" data-panel-id="plot0">
<div class="plot-controls">
<div class="plot-title"></div>
<div class="plot-toolbar">
<button onclick="toggleScale('plot0', this)" title="Toggle Y axis scale (log or lin)">Lin</button>
<button onclick="moveUp('plot0')" title="Move this plot up">↑</button>
<button onclick="moveDown('plot0')" title="Move this plot down">↓</button>
<button onclick="toggleVisibility('plot0', this)" title="Hide or show this plot">Hide</button>
</div>
</div>
<div id="plot0" class="plot-panel"></div>
</div>
</div>
<script>
function toggleVisibility(id, buttonEl) {
const plotEl = document.getElementById(id);
const isVisible = plotEl.style.display !== 'none';
plotEl.style.display = isVisible ? 'none' : '';
buttonEl.textContent = isVisible ? 'Show' : 'Hide';
}
function toggleScale(id, buttonEl) {
const current = buttonEl.textContent.toLowerCase();
const newScale = current === 'lin' ? 'log' : 'linear';
Plotly.relayout(id, {
'yaxis.type': newScale,
'yaxis.autorange': true
}).then(() => {
buttonEl.textContent = newScale === 'linear' ? 'Lin' : 'Log';
}).catch(err => {
console.error("Scale toggle failed:", err);
alert("Could not switch scale. Ensure all Y values are > 0 for log.");
});
}
function moveDown(id) {
const wrapper = document.querySelector(`[data-panel-id="${id}"]`);
const container = document.getElementById("plot-container");
if (!wrapper || wrapper.parentNode !== container) return;
const next = wrapper.nextElementSibling;
if (!next) return;
container.insertBefore(wrapper, next.nextElementSibling);
}
function moveUp(id) {
const wrapper = document.querySelector(`[data-panel-id="${id}"]`);
const container = document.getElementById("plot-container");
if (!wrapper || wrapper.parentNode !== container) return;
const prev = wrapper.previousElementSibling;
if (prev) container.insertBefore(wrapper, prev);
}
function makeLayout(title, scale, xrange) {
const layout = {
// title: { text: title, font: { size: 14 } },
margin: { l: 50, r: 30, t: 30, b: 30 },
height: 400,
showlegend: true,
legend: { orientation: "h", x: 0, y: -0.3 },
hoverlabel: { namelength: -1 },
yaxis: {
title: "Y Axis 1",
type: scale,
side: "left"
},
yaxis2: {
title: "Y Axis 2",
type: scale,
overlaying: "y",
side: "right"
}
};
if (xrange) {
layout.xaxis = { range: xrange };
}
return layout;
}
// OMG :)
function enableGlobalCursorLine(plotIds) {
console.log("enableGlobalCursorLine called with plots:", plotIds);
let currentLineX = null;
plotIds.forEach(sourceId => {
const sourceEl = document.getElementById(sourceId);
if (!sourceEl) {
console.warn(`Plot element with id "${sourceId}" not found.`);
return;
}
sourceEl.addEventListener('mousemove', event => {
const bbox = sourceEl.getBoundingClientRect();
const xPixel = event.clientX - bbox.left;
const yPixel = event.clientY - bbox.top;
const layout = sourceEl._fullLayout;
if (!layout) {
console.warn(`_fullLayout not available for plot "${sourceId}"`);
return;
}
const xaxis = layout.xaxis;
if (!xaxis) {
console.warn(`xaxis not found in _fullLayout for plot "${sourceId}"`);
return;
}
// Check if cursor is inside the x axis range in pixels
if (xPixel < xaxis._offset || xPixel > xaxis._offset + xaxis._length) {
// Outside plot x axis area
// console.log(`Cursor outside x axis range on plot "${sourceId}": xPixel=${xPixel}`);
return;
}
// Convert pixel to data coordinate
let xValue;
try {
// Use Plotly's internal methods to convert pixel to data
// c2d = coordinate to data, p2c = pixel to coordinate
if (typeof xaxis.p2c === 'function' && typeof xaxis.c2d === 'function') {
const coord = xaxis.p2c(xPixel - xaxis._offset);
xValue = xaxis.c2d(coord);
} else {
xValue = xaxis.p2d ? xaxis.p2d(xPixel - xaxis._offset) : null;
}
} catch (err) {
console.error("Error converting pixel to x value:", err);
return;
}
if (!xValue) {
console.warn(`Could not determine xValue under cursor for plot "${sourceId}"`);
return;
}
// For date axes, xValue is milliseconds since epoch or Date object
// Normalize to ISO string for Plotly shape x0/x1
let xISO;
if (typeof xValue === "number") {
xISO = new Date(xValue).toISOString();
} else if (xValue instanceof Date) {
xISO = xValue.toISOString();
} else if (typeof xValue === "string") {
xISO = xValue; // assume ISO string
} else {
console.warn(`Unexpected xValue type for plot "${sourceId}":`, xValue);
return;
}
// Avoid redundant relayout calls if line is already at this position
if (currentLineX === xISO) {
//console.log("Line already at this position:", xISO);
return;
}
currentLineX = xISO;
// console.log(`Cursor at pixel ${xPixel}, xValue: ${xValue}, xISO: ${xISO}`);
plotIds.forEach(id => {
Plotly.relayout(id, {
shapes: [{
type: 'line',
x0: xISO,
x1: xISO,
yref: 'paper',
y0: 0,
y1: 1,
line: { color: 'black', width: 1, dash: 'dot' },
layer: 'above'
}]
}).catch(err => {
console.error(`Error updating shape on plot "${id}":`, err);
});
});
});
sourceEl.addEventListener('mouseleave', () => {
// console.log(`Mouse left plot "${sourceId}", removing vertical line.`);
plotIds.forEach(id => {
Plotly.relayout(id, { shapes: [] }).catch(err => {
console.error(`Error removing shapes on plot "${id}":`, err);
});
});
currentLineX = null;
});
});
}
const config = {
displaylogo: false,
modeBarButtonsToRemove: ['select2d', 'lasso2d', 'autoScale2d'],
responsive: true
};
const plotPromises = [];
plotPromises.push(Plotly.newPlot(
"plot0",
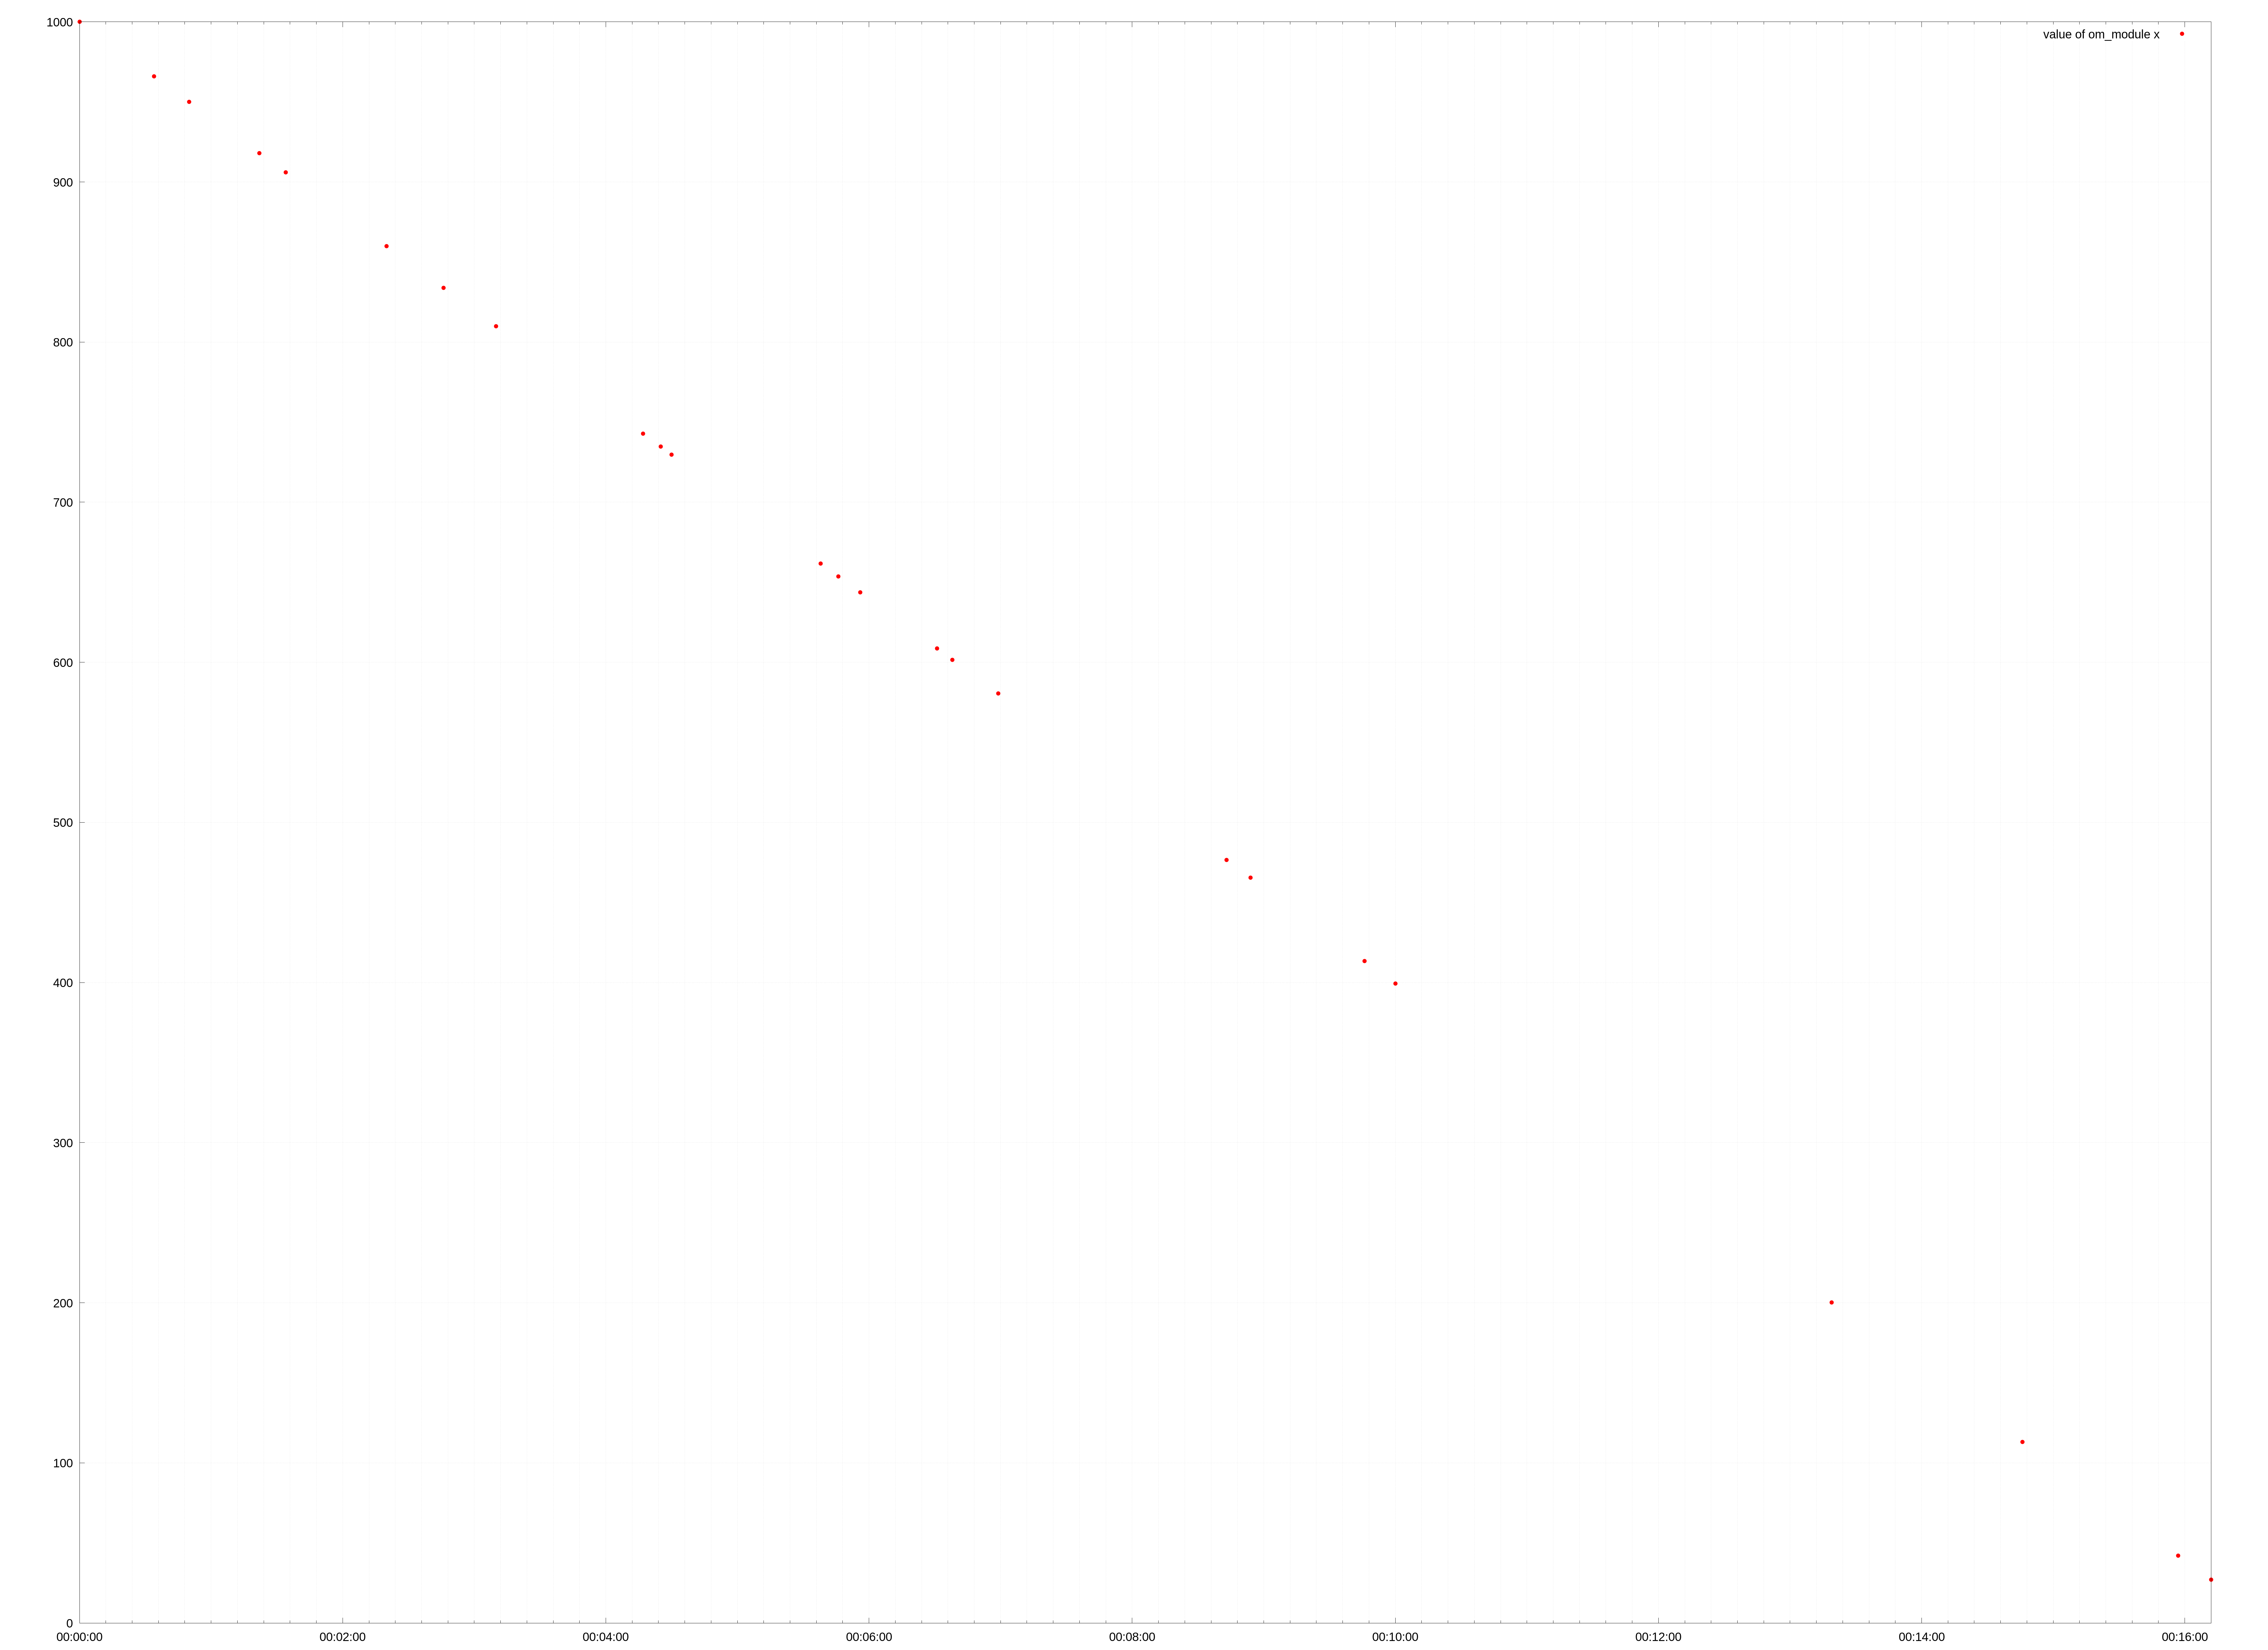
[{"type":"scatter","name":"value of om_module x","mode":"lines+markers","x":["2020-01-01 00:00:00.000","2020-01-01 00:00:34.000","2020-01-01 00:00:50.000","2020-01-01 00:01:22.000","2020-01-01 00:01:34.000","2020-01-01 00:02:20.000","2020-01-01 00:02:46.000","2020-01-01 00:03:10.000","2020-01-01 00:04:17.000","2020-01-01 00:04:25.000","2020-01-01 00:04:30.000","2020-01-01 00:05:38.000","2020-01-01 00:05:46.000","2020-01-01 00:05:56.000","2020-01-01 00:06:31.000","2020-01-01 00:06:38.000","2020-01-01 00:06:59.000","2020-01-01 00:08:43.000","2020-01-01 00:08:54.000","2020-01-01 00:09:46.000","2020-01-01 00:10:00.000","2020-01-01 00:13:19.000","2020-01-01 00:14:46.000","2020-01-01 00:15:57.000","2020-01-01 00:16:12.000"],"y":[1000.0,965.97,949.95,917.92,905.91,859.86,833.83,809.81,742.74,734.73,729.73,661.66,653.65,643.64,608.61,601.6,580.58,476.48,465.47,413.41,399.4,200.2,113.11,42.04,27.03],"yaxis":"y","marker":{"size":4},"line":{"width":0.5}}],
makeLayout(
"",
"linear",
["2020-01-01 00:00:00","2020-01-01 00:16:12"]
),
config
));
const plots = ["plot0"];
Promise.all(plotPromises).then(() => {
enableGlobalCursorLine(plots);
});
const isSyncing = {};
plots.forEach(id => isSyncing[id] = false);
plots.forEach(sourceId => {
const sourceEl = document.getElementById(sourceId);
const others = plots.filter(id => id !== sourceId);
sourceEl.on('plotly_relayout', e => {
if (isSyncing[sourceId]) return;
// console.log(`Relayout event on ${sourceId}:`, e);
let range = null;
if (Array.isArray(e['xaxis.range'])) {
// Case: Reset axes
range = e['xaxis.range'];
} else if (e['xaxis.range[0]'] && e['xaxis.range[1]']) {
// Case: manual zoom/pan
range = [e['xaxis.range[0]'], e['xaxis.range[1]']];
}
if (range) {
others.forEach(targetId => {
isSyncing[targetId] = true;
Plotly.relayout(targetId, { 'xaxis.range': range }).then(() => {
isSyncing[targetId] = false;
});
});
}
if (e['xaxis.autorange']) {
console.log(`Relayout event on ${sourceId}:`, e);
others.forEach(targetId => {
isSyncing[targetId] = true;
Plotly.relayout(targetId, { 'xaxis.autorange': true }).then(() => {
isSyncing[targetId] = false;
});
});
}
});
});
</script>
</body>
</html>