set terminal pngcairo enhanced font 'arial,10' fontscale 3.0 size 7560, 5500
set output './tests/.output/basic.png'
set linetype 1 lc rgb "red" dt 1 pt 7 lw 2.0 ps 4.0
set linetype 2 lc rgb "blue" dt 1 pt 9 lw 2.0 ps 4.0
set linetype 3 lc rgb "dark-green" dt 1 pt 5 lw 2.0 ps 4.0
set linetype 4 lc rgb "purple" dt 1 pt 13 lw 2.0 ps 4.0
set linetype 5 lc rgb "cyan" dt 1 pt 1 lw 2.0 ps 4.0
set linetype 6 lc rgb "goldenrod" dt 1 pt 3 lw 2.0 ps 4.0
set linetype 7 lc rgb "brown" dt 1 pt 6 lw 2.0 ps 4.0
set linetype 8 lc rgb "olive" dt 1 pt 2 lw 2.0 ps 4.0
set linetype 9 lc rgb "navy" dt 1 pt 8 lw 2.0 ps 4.0
set linetype 10 lc rgb "violet" dt 1 pt 4 lw 2.0 ps 4.0
set linetype 11 lc rgb "coral" dt 1 pt 12 lw 2.0 ps 4.0
set linetype 12 lc rgb "salmon" dt 1 pt 7 lw 2.0 ps 4.0
set linetype 13 lc rgb "steelblue" dt 1 pt 9 lw 2.0 ps 4.0
set linetype 14 lc rgb "dark-magenta" dt 1 pt 5 lw 2.0 ps 4.0
set linetype 15 lc rgb "dark-cyan" dt 1 pt 13 lw 2.0 ps 4.0
set linetype 16 lc rgb "dark-yellow" dt 1 pt 1 lw 2.0 ps 4.0
set linetype 17 lc rgb "dark-turquoise" dt 1 pt 3 lw 2.0 ps 4.0
set linetype 18 lc rgb "yellow" dt 1 pt 6 lw 2.0 ps 4.0
set linetype 19 lc rgb "black" dt 1 pt 2 lw 2.0 ps 4.0
set linetype 20 lc rgb "magenta" dt 1 pt 8 lw 2.0 ps 4.0
set datafile separator ','
set xdata time
set timefmt '%Y-%m-%dT%H:%M:%S'
set format x '%H:%M:%S'
set mxtics 10
set grid xtics mxtics
set grid ytics mytics
set ytics nomirror
set key noenhanced
set multiplot
set lmargin at screen 0.035
set rmargin at screen 0.975
combine_datetime(date_col,time_col) = strcol(date_col) . 'T' . strcol(time_col)
set origin 0.0,0
set size 1.0,0.995
unset label
unset logscale y
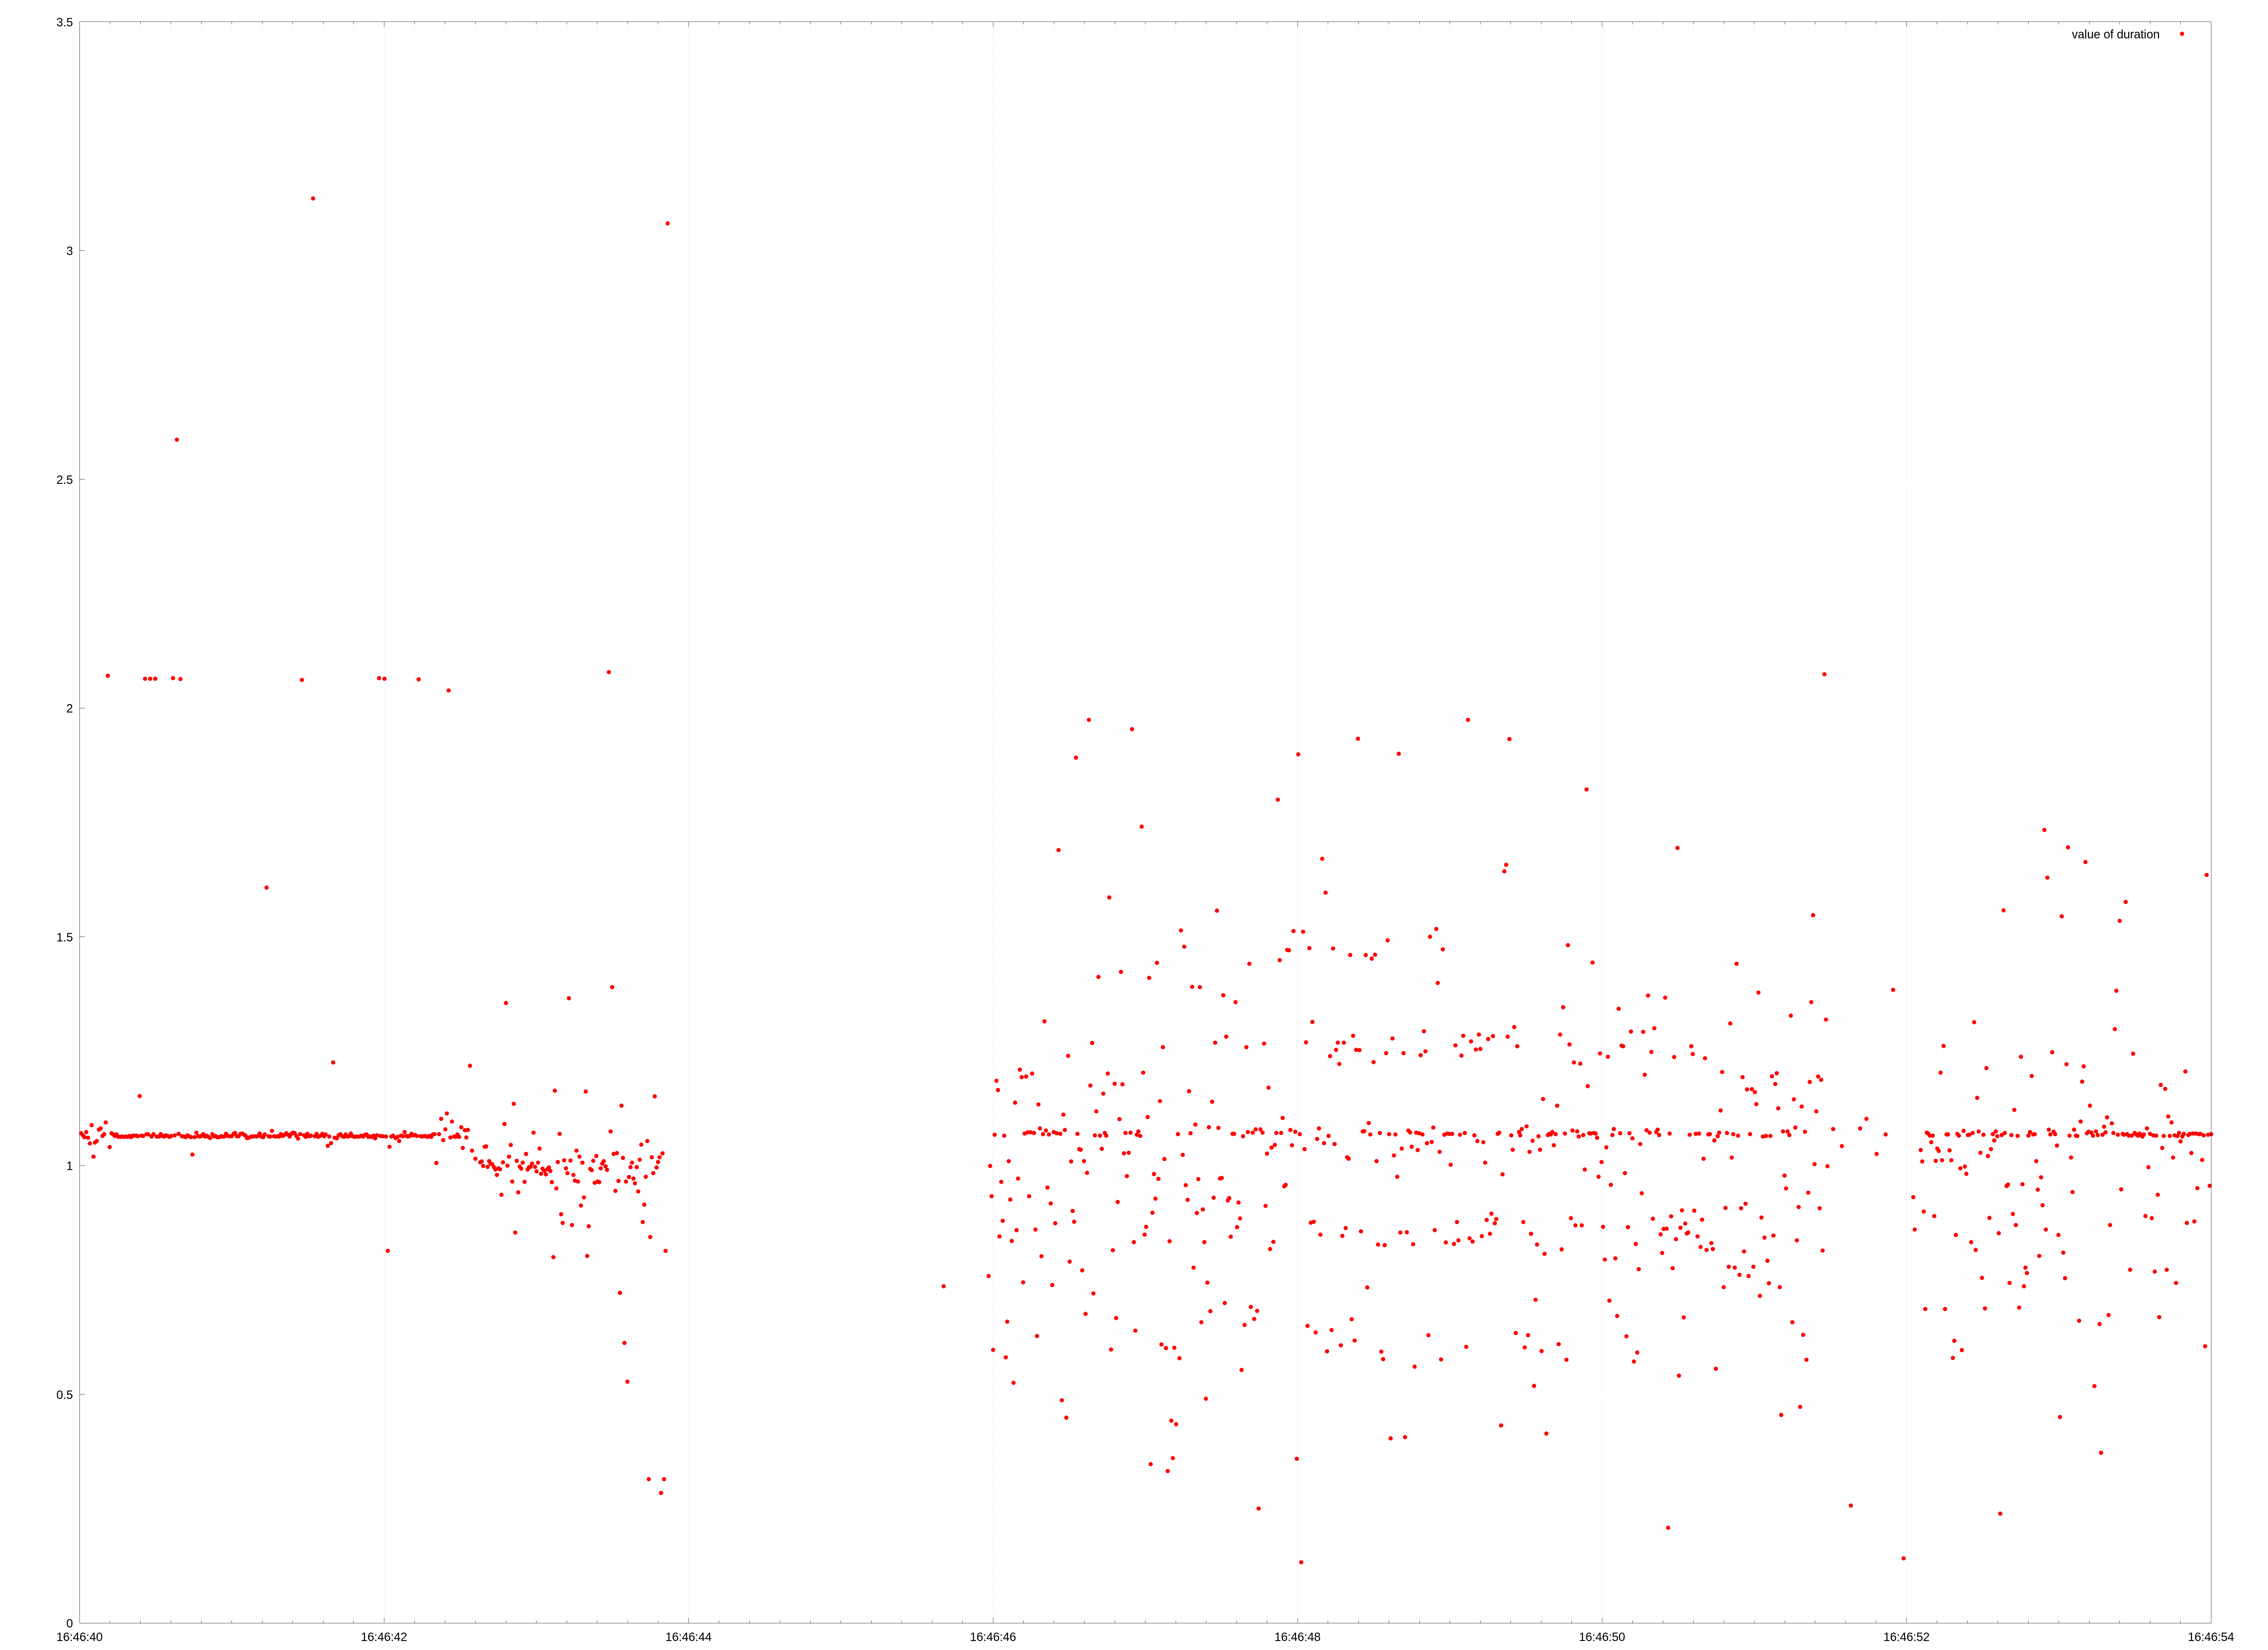
set xrange ["2025-05-12T16:46:40":"2025-05-12T16:46:54"]
csv_data_file_0000 = '/home/miszka/parity/graph-tool/plox/tests/examples/.plox/checker.log_1747248164__%5Cbduration%3D%28%5B%5Cd%5C.%5D%2B%29%28%5Cw%2B%29%3F.csv'
plot \
csv_data_file_0000 using (combine_datetime('date','time')):'value' with points ps 2 axes x1y1 title 'value of duration'
unset y2tics
unset my2tics
unset multiplot