use num_traits::One;
use perplex_num::Perplex;
use plotters::prelude::*;
fn main() -> Result<(), Box<dyn std::error::Error>> {
let root = BitMapBackend::new("./examples/sectors.jpg", (600, 600)).into_drawing_area();
root.fill(&WHITE)?;
let (t_min, t_max, x_min, x_max) = (-2, 2, -2, 2);
let mut chart = ChartBuilder::on(&root)
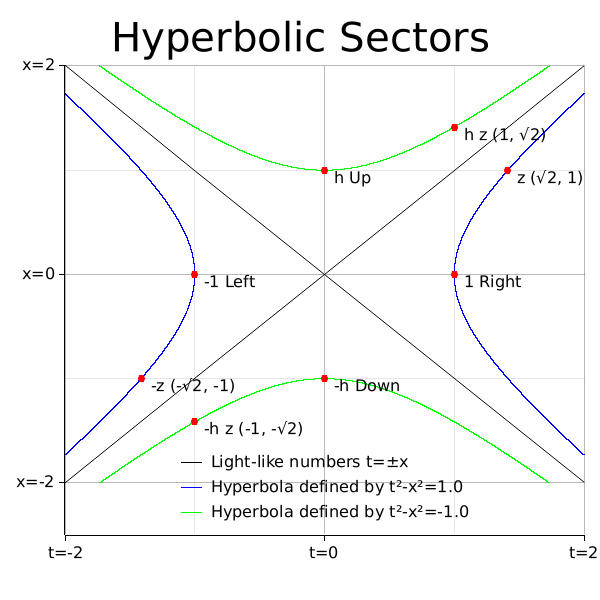
.caption("Hyperbolic Sectors", ("sans-serif", 50).into_font())
.margin(15)
.x_label_area_size(50)
.y_label_area_size(50)
.build_cartesian_2d(
t_min as f64..t_max as f64,
(x_min as f64 - 0.5)..x_max as f64,
)?;
let font = ("sans-serif", 20).into_font();
chart
.configure_mesh()
.max_light_lines(2)
.label_style(font.clone())
.x_labels(3)
.y_labels(3)
.x_label_formatter(&|t| format!("t={:.0}", t))
.y_label_formatter(&|x| format!("x={:.0}", x))
.draw()?;
let h = Perplex::h();
let e = Perplex::one();
let z = Perplex {
t: 2.0_f64.sqrt(),
x: 1.0,
};
let label_offset = (10, 0);
let klein_sector = [
("1 Right", e),
("h Up", h),
("-1 Left", -e),
("-h Down", -h),
("z (√2, 1)", z),
("h z (1, √2)", h * z),
("-z (-√2, -1)", -z),
("-h z (-1, -√2)", -h * z),
];
chart
.draw_series(LineSeries::new(
(x_min..=x_max).map(|x| (x as f64, x as f64)),
BLACK,
))?
.label("Light-like numbers t=±x")
.legend(|(x, y)| PathElement::new(vec![(x, y), (x + 20, y)], BLACK));
chart.draw_series(LineSeries::new(
(x_min..=x_max).map(|x| (x as f64, -x as f64)),
BLACK,
))?;
let d = z.squared_distance();
let mut hyperbola_ru = Vec::new();
let mut hyperbola_rd = Vec::new();
let mut hyperbola_ul = Vec::new();
let mut hyperbola_ur = Vec::new();
let mut hyperbola_lu = Vec::new();
let mut hyperbola_ld = Vec::new();
let mut hyperbola_dl = Vec::new();
let mut hyperbola_dr = Vec::new();
(0..=100_000)
.map(|i| d + i as f64 * (t_max as f64 - d) / 100_000.0)
.for_each(|t| {
let x = (t * t - d).sqrt();
hyperbola_ru.push((t, x));
hyperbola_rd.push((t, -x));
hyperbola_ul.push((-x, t));
hyperbola_ur.push((x, t));
hyperbola_lu.push((-t, x));
hyperbola_ld.push((-t, -x));
hyperbola_dl.push((-x, -t));
hyperbola_dr.push((x, -t));
});
let hyperbolas = [
(hyperbola_ru, &BLUE, 1),
(hyperbola_rd, &BLUE, 0),
(hyperbola_ul, &GREEN, -1),
(hyperbola_ur, &GREEN, 0),
(hyperbola_lu, &BLUE, 0),
(hyperbola_ld, &BLUE, 0),
(hyperbola_dl, &GREEN, 0),
(hyperbola_dr, &GREEN, 0),
];
for (hyperbola, color, legend_d) in hyperbolas {
let points = hyperbola
.into_iter()
.filter(|&(_t, x)| (x <= x_max as f64 && x >= x_min as f64));
let draw_result = chart.draw_series(LineSeries::new(points, color))?;
let legend = match legend_d {
1 => format!("Hyperbola defined by t²-x²={:.1}", d),
-1 => format!("Hyperbola defined by t²-x²=-{:.1}", d),
_ => String::from(""),
};
if !legend.is_empty() {
draw_result
.label(legend)
.legend(|(x, y)| PathElement::new(vec![(x, y), (x + 20, y)], color.to_owned()));
}
}
chart.draw_series(klein_sector.into_iter().map(|(label, z)| {
let coord = (z.t, z.x);
EmptyElement::at(coord)
+ Circle::new((0, 0), 3, RED.filled())
+ Text::new(label, label_offset, font.clone())
}))?;
chart
.configure_series_labels()
.position(SeriesLabelPosition::LowerMiddle)
.label_font(font.clone())
.draw()?;
Ok(())
}