use std::{iter, vec};
use perplex_num::Perplex;
use plotters::{
prelude::*,
style::full_palette::{LIGHTBLUE, LIGHTGREEN, PURPLE},
};
type PerplexMap = Box<dyn Fn(&Perplex<f64>) -> Perplex<f64>>;
fn main() -> Result<(), Box<dyn std::error::Error>> {
let root =
BitMapBackend::new("./examples/perplex_functions.jpg", (600, 600)).into_drawing_area();
root.fill(&WHITE)?;
let (t_min, t_max, x_min, x_max) = (-1, 3, -2, 2);
let mut chart = ChartBuilder::on(&root)
.caption(
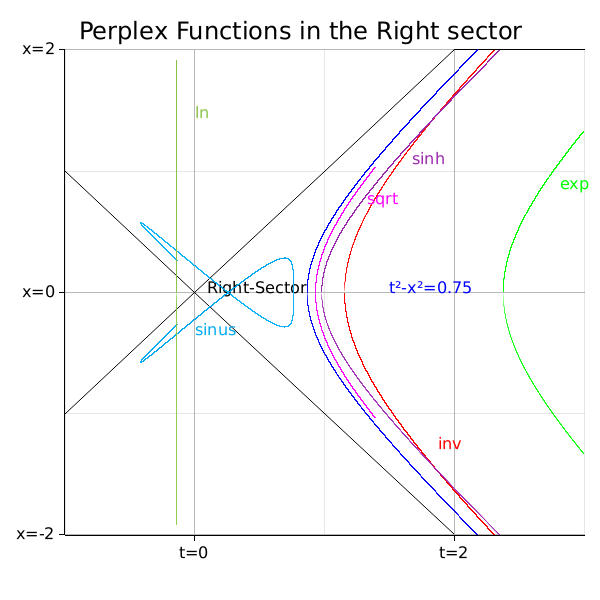
"Perplex Functions in the Right sector",
("sans-serif", 30).into_font(),
)
.margin(15)
.x_label_area_size(50)
.y_label_area_size(50)
.build_cartesian_2d(t_min as f64..t_max as f64, x_min as f64..x_max as f64)?;
let font = ("sans-serif", 20).into_font();
chart
.configure_mesh()
.max_light_lines(2)
.label_style(font.clone())
.x_labels(3)
.y_labels(3)
.x_label_formatter(&|t| format!("t={:.0}", t))
.y_label_formatter(&|x| format!("x={:.0}", x))
.draw()?;
let down_alpha = 0.1;
let z = Perplex { t: 1.0, x: 0.5 };
let d = z.squared_distance();
let mut hyperbola_ru = Vec::new();
let mut hyperbola_rd = Vec::new();
(0..=100_000)
.map(|i| d + i as f64 * (t_max as f64 - d) / 100_000.0)
.for_each(|t| {
let x = (t * t - d).sqrt();
if x.is_finite() {
hyperbola_ru.push(Perplex::new(t, x));
hyperbola_rd.push(Perplex::new(t, -x));
}
});
let functions: Vec<(&str, PerplexMap, &RGBColor)> = vec![
(
"inv",
Box::new(|z: &Perplex<f64>| {
z.try_inverse()
.expect("z is invertible since d is non-zero!")
}),
&RED,
),
("sinus", Box::new(|z: &Perplex<f64>| z.sin()), &LIGHTBLUE),
("sinh", Box::new(|z: &Perplex<f64>| z.sinh()), &PURPLE),
("exp", Box::new(|z: &Perplex<f64>| z.exp()), &GREEN),
(
"ln",
Box::new(|z: &Perplex<f64>| z.ln().expect("The natural logarithm of z exists!")),
&LIGHTGREEN,
),
(
"sqrt",
Box::new(|z: &Perplex<f64>| z.sqrt().expect("Sqrt of a z in the Right sector exists!")),
&MAGENTA,
),
];
chart.draw_series(LineSeries::new(
(t_min..=t_max).map(|x| (x as f64, x as f64)),
&BLACK,
))?;
chart.draw_series(LineSeries::new(
(t_min..t_max).map(|x| (x as f64, -x as f64)),
&BLACK,
))?;
chart.draw_series(iter::once(Text::new(
"Right-Sector",
(0.1, 0.1),
font.clone(),
)))?;
let bound_filter = |z: &Perplex<f64>| {
t_min as f64 <= z.t && z.t <= t_max as f64 && x_min as f64 <= z.x && z.x <= x_max as f64
};
let bound_filter_ref = |z: &&Perplex<f64>| bound_filter(z);
let perplex_coords = |z: &Perplex<f64>| (z.t, z.x);
chart.draw_series(LineSeries::new(
hyperbola_ru
.iter()
.filter(bound_filter_ref)
.map(perplex_coords),
&BLUE,
))?;
chart.draw_series(iter::once(Text::new(
format!("t²-x²={:.2}", d),
(2.0 * d, 0.1),
font.clone().color(&BLUE),
)))?;
chart.draw_series(LineSeries::new(
hyperbola_rd
.iter()
.filter(bound_filter_ref)
.map(perplex_coords),
&BLUE.mix(down_alpha),
))?;
for (label, f, color) in functions.iter() {
let result_ru: Vec<Perplex<f64>> =
hyperbola_ru.iter().map(f).filter(bound_filter).collect();
let label_pos = perplex_coords(&result_ru[result_ru.len() / 2]);
chart.draw_series(LineSeries::new(
result_ru.iter().map(perplex_coords),
*color,
))?;
let result_rd: Vec<Perplex<f64>> =
hyperbola_rd.iter().map(f).filter(bound_filter).collect();
chart.draw_series(LineSeries::new(
result_rd.iter().map(perplex_coords),
color.mix(down_alpha),
))?;
chart.draw_series(iter::once(Text::new(
label.to_string(),
(label_pos.0 + 0.15, label_pos.1 + 0.1),
font.clone().color(color),
)))?;
}
chart
.configure_series_labels()
.position(SeriesLabelPosition::LowerMiddle)
.label_font(font.clone())
.draw()?;
Ok(())
}