
Analyzes runtime traces (SQL queries, HTTP calls) to detect N+1 queries, redundant calls and scores I/O intensity per endpoint (GreenOps).
Why perf-sentinel?
Performance anti-patterns like N+1 queries exist in any application that does I/O: monoliths and microservices alike. In distributed architectures, a single user request cascades across multiple services, each with its own I/O and nobody has visibility on the full path. Existing tools each solve part of the problem: Hypersistence Utils covers JPA only, Datadog and New Relic are heavy proprietary agents you may not want in every pipeline, Sentry's detectors are solid but tied to its SDK and backend. None of them give you a protocol-level CI gate you can self-host.
perf-sentinel takes a different approach: protocol-level analysis. It observes the traces your application produces (SQL queries, HTTP calls) regardless of language or ORM. It doesn't need to understand JPA, EF Core or SeaORM, it sees the queries they generate.
Beyond CI gates, perf-sentinel can also produce periodic public disclosures of an organization's software efficiency: a hash-verifiable JSON document that aggregates energy and carbon estimates over a calendar period (quarter, year), suitable as raw material for transparency reporting alongside CSRD or RGESN obligations. See Public reporting below.
Quick look
In the dashboard:
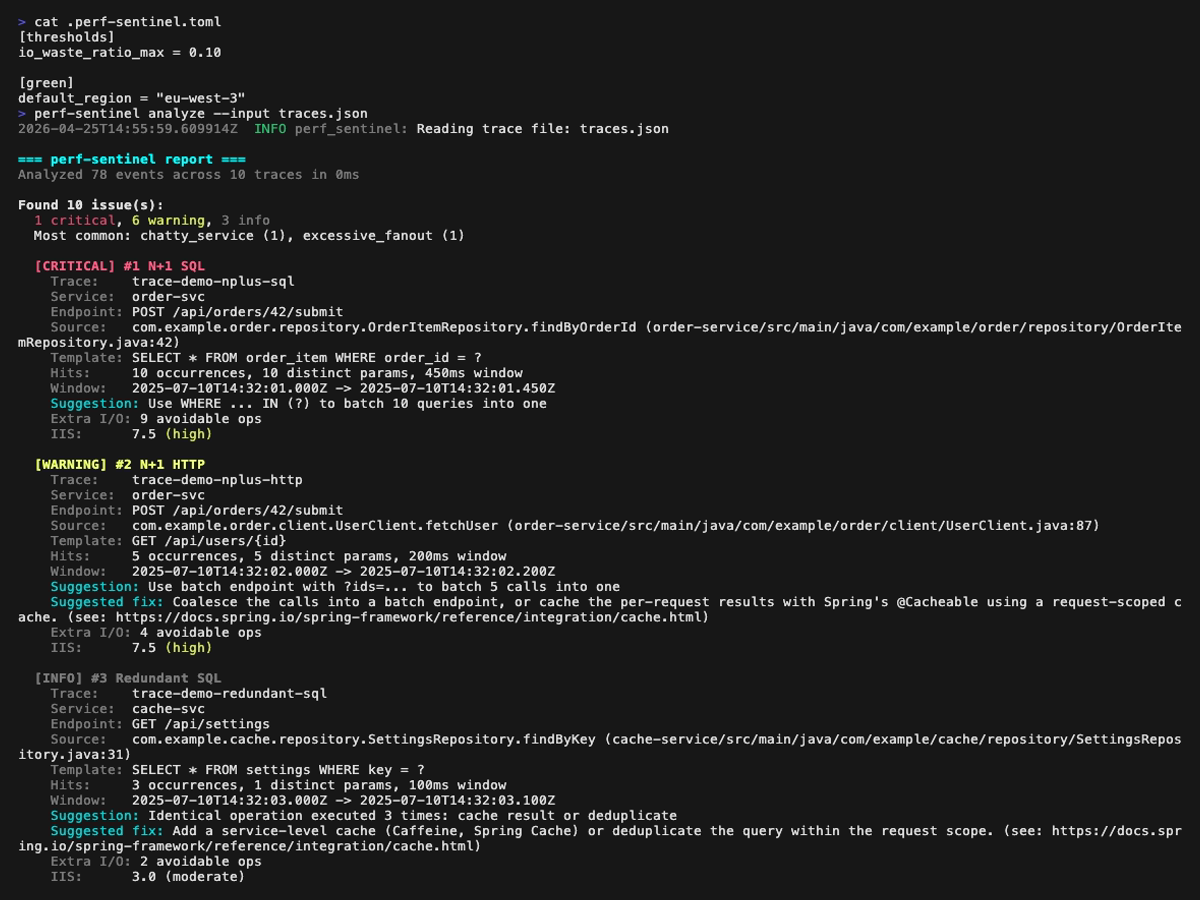
...or in the terminal:

How this fits into your infra
One tool, 2 modes, 4 deployment topologies:
Local dev

CI/CD

Staging

Production

Plus a cross-cutting angle: GreenOps (energy and carbon estimation from external real-time sources and internal cold tables, in batch or daemon mode).


The companion repo perf-sentinel-simulation-lab validates eight operational modes end to end on a real Kubernetes cluster (hybrid daemon to batch HTML, batch over Tempo, daemon OTLP direct, multi-format Jaeger/Zipkin, calibrate, sidecar, cross-trace correlation, pg_stat_statements integration). Each scenario ships a Mermaid architecture diagram, the exact inputs and outputs, the required configuration, and the gotchas that bit us during validation.
Getting Started
Install from crates.io
Download a prebuilt binary
Binaries for Linux (amd64, arm64), macOS (arm64) and Windows (amd64) are available on the GitHub Releases page. Linux binaries target musl and are fully statically linked, so they run on any distribution (Debian, Ubuntu, Alpine, RHEL, etc.) regardless of glibc version, and inside FROM scratch images. macOS Intel users can run the arm64 binary via Rosetta 2.
# Example: Linux amd64
Run with Docker
The daemon binds to 127.0.0.1 by default for security. Inside a container that is unreachable from the host, so the quickstart above overrides the bind address with --listen-address 0.0.0.0. The daemon will log a non-loopback warning on startup, which is expected. For real deployments, put a reverse proxy (or a NetworkPolicy on Kubernetes) in front, or mount examples/perf-sentinel-docker.toml for the full compose topology.
For Kubernetes, a Helm chart is available under charts/perf-sentinel/. See docs/HELM-DEPLOYMENT.md.
Quick demo
Batch analysis (CI)
Explain a trace
SARIF export (GitHub/GitLab code scanning)
Import from Jaeger or Zipkin
# Jaeger JSON export (auto-detected)
# Zipkin JSON v2 (auto-detected)
pg_stat_statements analysis
# Analyze PostgreSQL pg_stat_statements export for SQL hotspots
# Cross-reference with trace findings
# Scrape pg_stat_statements metrics from a postgres_exporter Prometheus endpoint
Interactive inspection (TUI)
Tempo trace ingestion
# Fetch and analyze a single trace from Grafana Tempo
# Search and analyze recent traces by service name
Calibrate energy coefficients
# Tune I/O-to-energy coefficients from real measurements
HTML dashboard report
# Single-file HTML dashboard for post-mortem exploration in any browser
# Embed a pg_stat_statements ranking tab
# Or scrape it live from postgres_exporter Prometheus
# Compare against a baseline for PR regression review
# Pipe a live daemon snapshot into the dashboard
|
The dashboard works offline (file://), zero external resources, embeds findings-only traces to stay under ~5 MB. Keyboard: j/k/enter/esc for the Findings list, / for per-tab search, ? for the full cheatsheet, g f/g e/g p/g d/g c/g r to switch tabs vim-style. Export CSV button on Findings, pg_stat, Diff and Correlations tabs. URL fragment encodes the active tab, search and filter chips so a shared link restores the exact filtered view.
PR regression diff
# Compare two analysis runs, surface new findings, resolutions and severity changes
# Machine-readable for CI
Identity for matching is (finding_type, service, source_endpoint, pattern.template). Output buckets: new_findings, resolved_findings, severity_changes, endpoint_metric_deltas. Use inside a PR job to catch regressions before they land.
Query a running daemon
All query sub-actions default to colored terminal output. Use --format json for scripting.
# List recent findings (colored text by default)
# Explain a trace tree with inline findings
# Interactive TUI with live daemon data
# View cross-trace correlations
# Check daemon health
# JSON output for scripting
Streaming mode (daemon)
GreenOps: built-in carbon-aware scoring
Every finding includes an I/O Intensity Score (IIS): the number of I/O operations generated per user request for a given endpoint. Reducing unnecessary I/O (N+1 queries, redundant calls) improves response times and reduces energy consumption, these are not competing goals.
- I/O Intensity Score = total I/O ops for an endpoint / number of invocations
- I/O Waste Ratio = avoidable I/O ops (from findings) / total I/O ops
Aligned with the Software Carbon Intensity model (SCI v1.0 / ISO/IEC 21031:2024) from the Green Software Foundation. The co2.total field holds the SCI numerator (E × I) + M summed over analyzed traces, not the per-request intensity score. Multi-region scoring is automatic when OTel spans carry the cloud.region attribute. 30+ cloud regions have embedded hourly carbon intensity profiles, with monthly x hourly seasonal variation for FR, DE, GB and US-East. In daemon mode, energy estimation can be refined via Scaphandre RAPL (bare metal) or cloud-native CPU% + SPECpower (AWS/GCP/Azure) and grid intensity can be pulled live from the Electricity Maps API, with automatic fallback to the I/O proxy model. Users can supply their own hourly profiles via [green] hourly_profiles_file or tune the proxy coefficients from on-site measurements via perf-sentinel calibrate.
Note: CO₂ estimates are directional, not regulatory-grade. Every estimate carries a
~2×multiplicative uncertainty bracket (low = mid/2,high = mid×2) because the I/O proxy model is rough. perf-sentinel is a waste counter, not a carbon-accounting tool. Do not use it for CSRD or GHG Protocol Scope 3 reporting. See docs/LIMITATIONS.md for the full methodology.
How does it compare?
Trace-based performance anti-pattern detection exists in mature APMs and in several open-source tools. perf-sentinel's niche is being lightweight, protocol-agnostic, CI/CD-native and carbon-aware, not replacing a full observability suite.
| Capability | Hypersistence Optimizer | Datadog APM + DBM | New Relic APM | Sentry | Digma | Grafana Pyroscope | perf-sentinel |
|---|---|---|---|---|---|---|---|
| N+1 SQL detection | JPA only, test-time | Yes, automatic (DBM) | Yes, automatic | Yes, automatic OOTB | Yes, IDE-centric (JVM/.NET) | No (CPU/memory profiler, not a query analyzer) | Yes, protocol-level, any OTel runtime |
| N+1 HTTP detection | No | Yes, service maps | Yes, trace correlation | Yes, N+1 API Call detector | Partial | No | Yes |
| Polyglot support | Java only | Per-language agents | Per-language agents | Per-SDK, most languages | JVM + .NET (Rider beta) | eBPF host-wide + per-language SDKs | Any OTel-instrumented runtime |
| Cross-service correlation | No | Yes | Yes | Yes | Limited (local IDE) | Trace-to-profile via OTel exemplars | Via trace ID |
| GreenOps / SCI v1.0 scoring | No | No | No | No | No | No | Built-in (directional) |
| Runtime footprint | Library (no overhead) | Agent (~100-150 MB RSS) | Agent (~100-150 MB RSS) | SDK + backend | Local backend (Docker) | Agent + backend (~50-100 MB RSS depending on language) | Standalone binary (<15 MB RSS) |
| Native CI/CD quality gate | Manual test assertions | Alerts, no build gate | Alerts, no build gate | Alerts, no build gate | No | No | Yes (exit 1 on threshold breach) |
| License | Commercial (Optimizer) | Proprietary SaaS | Proprietary SaaS | FSL (converts to Apache-2 after 2y) | Freemium, proprietary | AGPL-3.0 | AGPL-3.0 |
| Pricing / self-hostable | One-time license fee | Usage-based SaaS (no self-host) | Usage-based SaaS (no self-host) | Free tier + SaaS plans (no self-host) | Freemium SaaS (no self-host) | Free, fully self-hostable | Free, fully self-hostable |
Agent footprint figures for commercial APMs are order-of-magnitude estimates from public deployment reports; actual overhead depends on instrumentation scope.
What perf-sentinel is not
A fair comparison requires naming what perf-sentinel does not do:
- Not a full APM replacement. No dashboards, no alerting UI, no RUM, no log aggregation, no distributed profiling. If you need those, Datadog, New Relic and Sentry remain the right tools.
- Not a continuous profiler. perf-sentinel observes I/O patterns at the protocol level; it does not sample on-CPU time, allocations or stack traces. If you need flame graphs and language-aware CPU/memory profiling, Grafana Pyroscope is the open-source counterpart and pairs well with perf-sentinel: pyroscope tells you where compute time goes, perf-sentinel tells you which I/O patterns drive that time.
- Not a real-time monitoring solution. Daemon mode streams findings but the project's center of gravity is CI/CD quality gates and post-hoc trace analysis, not live prod observability.
- Not a regulatory carbon accounting tool. Use it to spot waste, not to file CSRD or GHG Protocol Scope 3 reports. See the GreenOps note above for methodology bounds.
- Not a replacement for measured energy. The I/O-to-energy model is an approximation. For accurate per-process power, use Scaphandre (supported as an input) or cloud provider energy APIs.
- Not zero-config. Protocol-level detection requires OTel instrumentation in your apps. If your stack does not emit traces, perf-sentinel has nothing to analyze.
- Not an IDE plugin. For in-IDE feedback on JVM/.NET code as you type, Digma offers a well-integrated JetBrains experience.
perf-sentinel is a complementary tool focused on one specific problem: detecting I/O anti-patterns in traces, scoring their impact (including carbon) and enforcing thresholds in CI. Use it alongside your existing observability stack, not in place of it.
What does it report?
For each detected anti-pattern, perf-sentinel reports:
- Type: N+1 SQL, N+1 HTTP, redundant query, slow SQL, slow HTTP, excessive fanout, chatty service, pool saturation or serialized calls. Cross-trace correlations are also surfaced in daemon mode
- Normalized template: the query or URL with parameters replaced by placeholders (
?,{id}) - Occurrences: how many times the pattern fired within the detection window
- Source endpoint: which application endpoint triggered it (e.g.
GET /api/orders) - Suggestion: e.g. "batch this query", "use a batch endpoint", "consider adding an index"
- Source location: when OTel spans carry
code.function,code.filepath,code.linenoattributes, findings display the originating source file and line. SARIF reports includephysicalLocationsfor inline GitHub/GitLab annotations - GreenOps impact: estimated avoidable I/O ops, I/O Intensity Score, structured
co2object (low/mid/high, SCI v1.0 operational + embodied terms), per-region breakdown when multi-region scoring is active
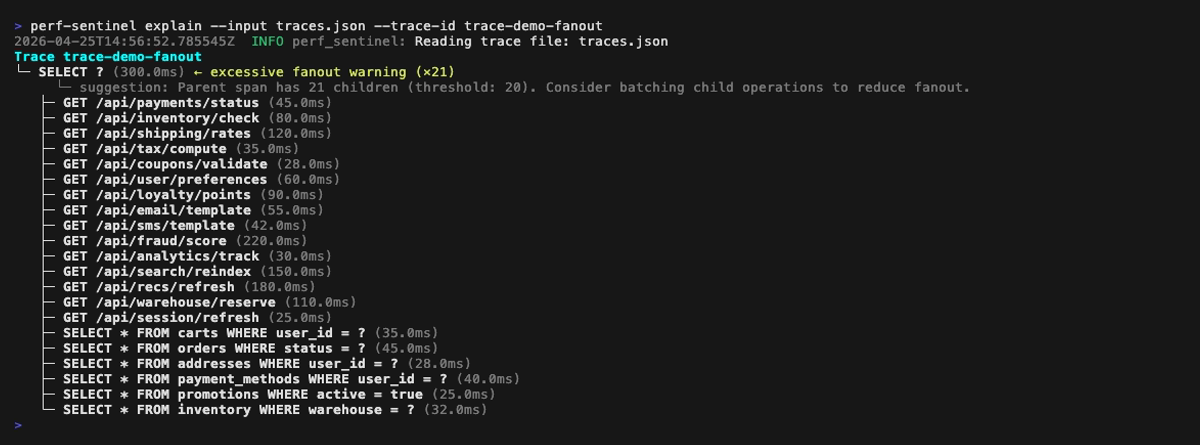
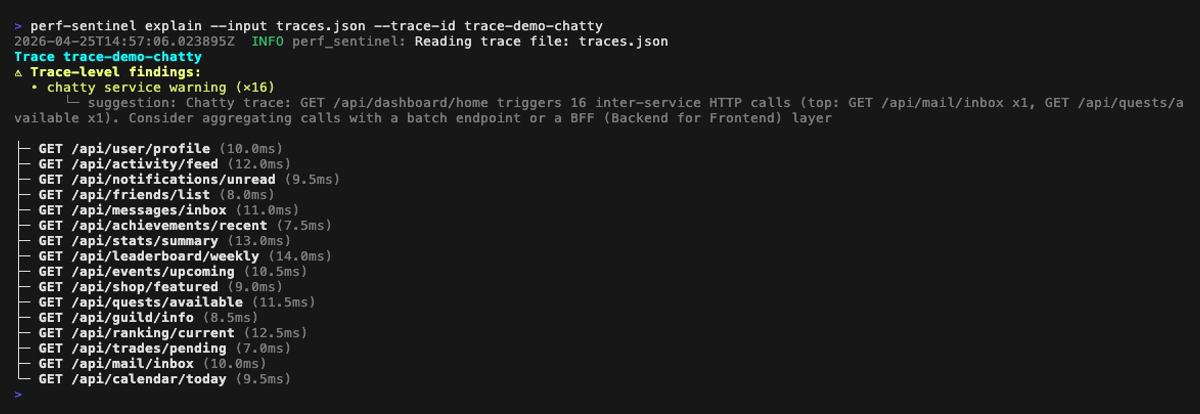
You can also drill into a single trace with the explain tree view, which annotates findings inline next to the offending spans:

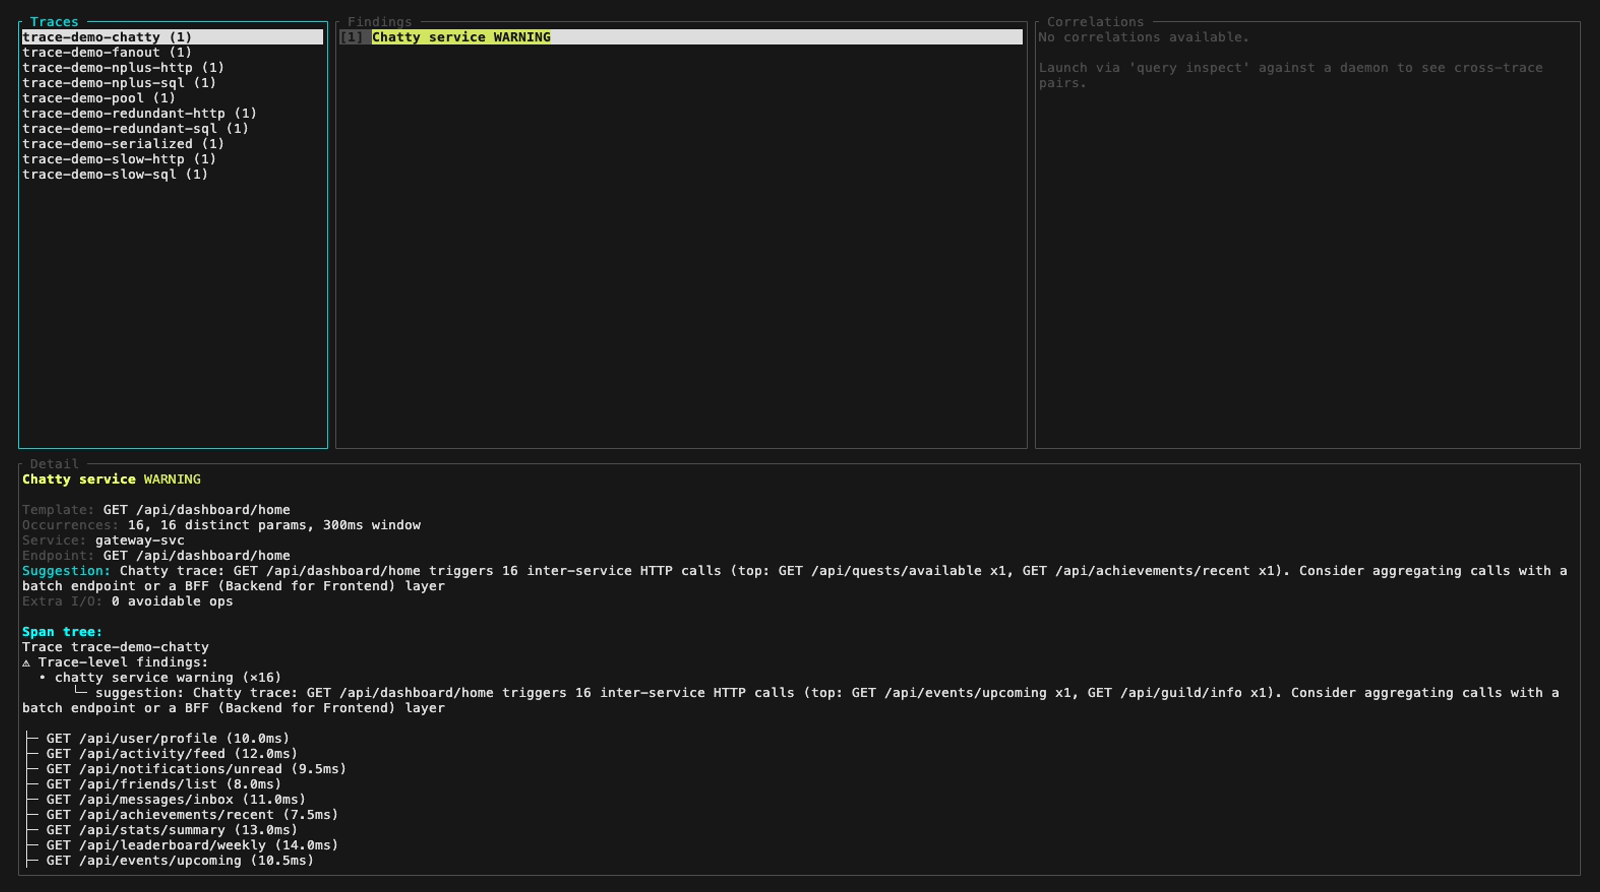
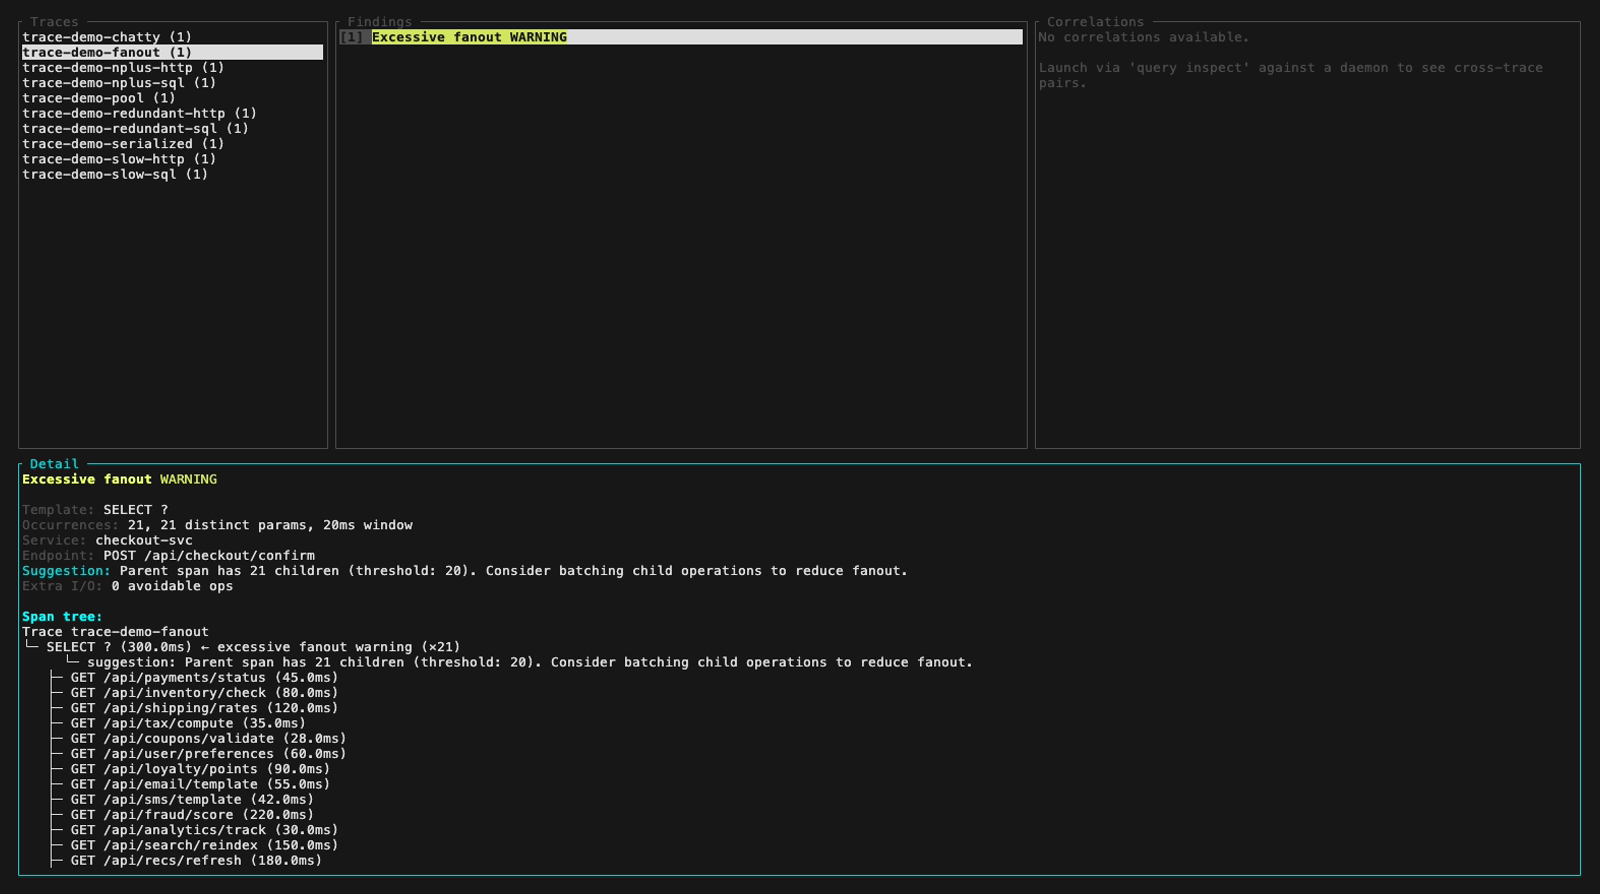
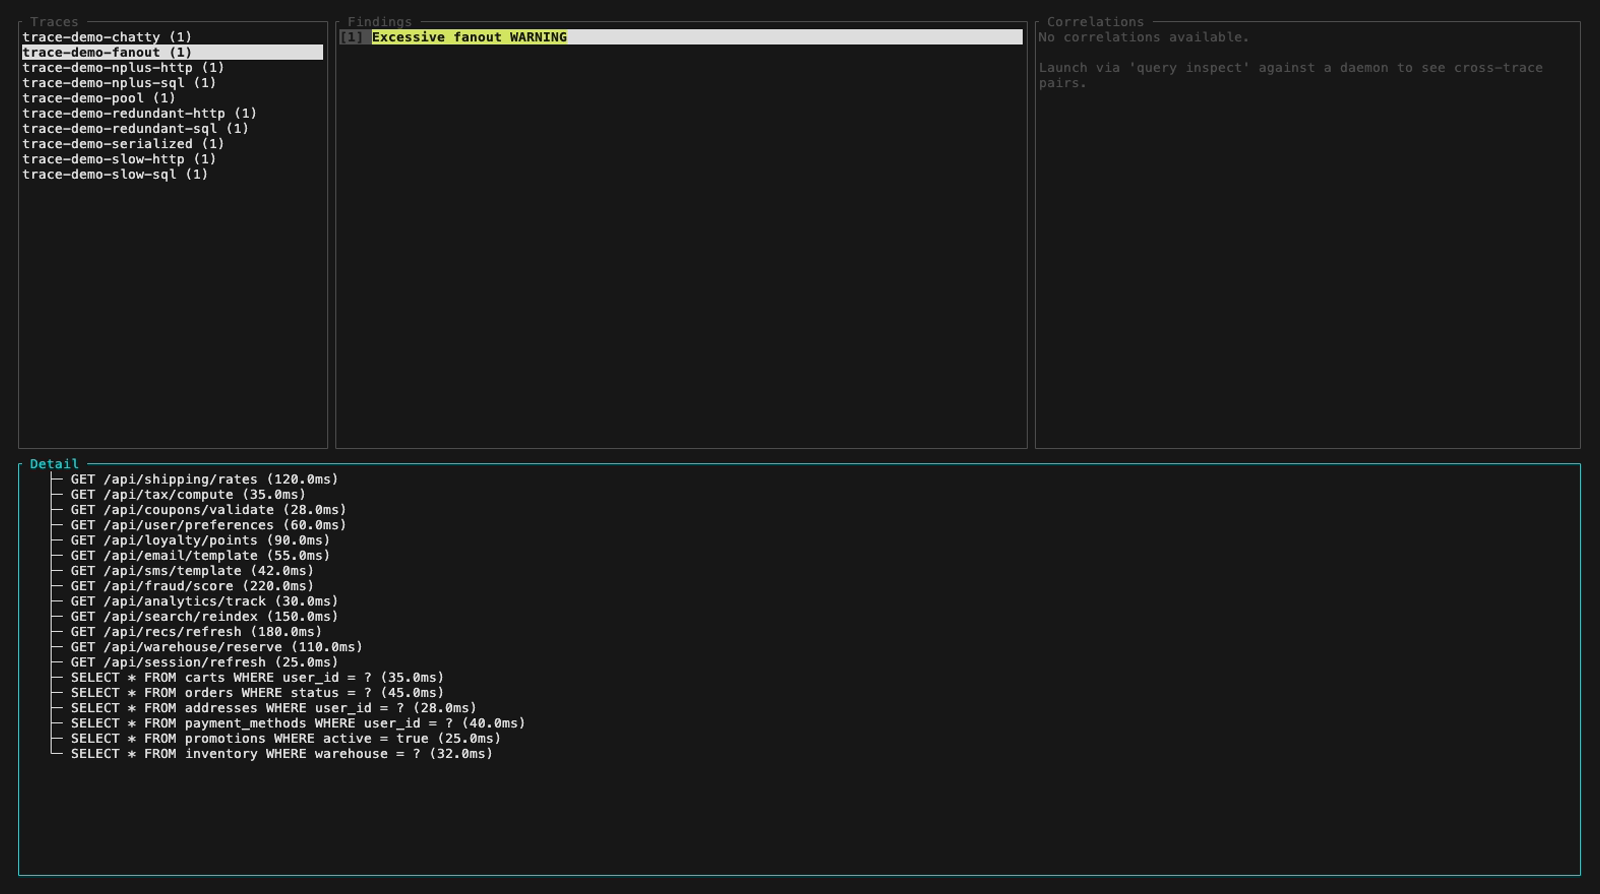
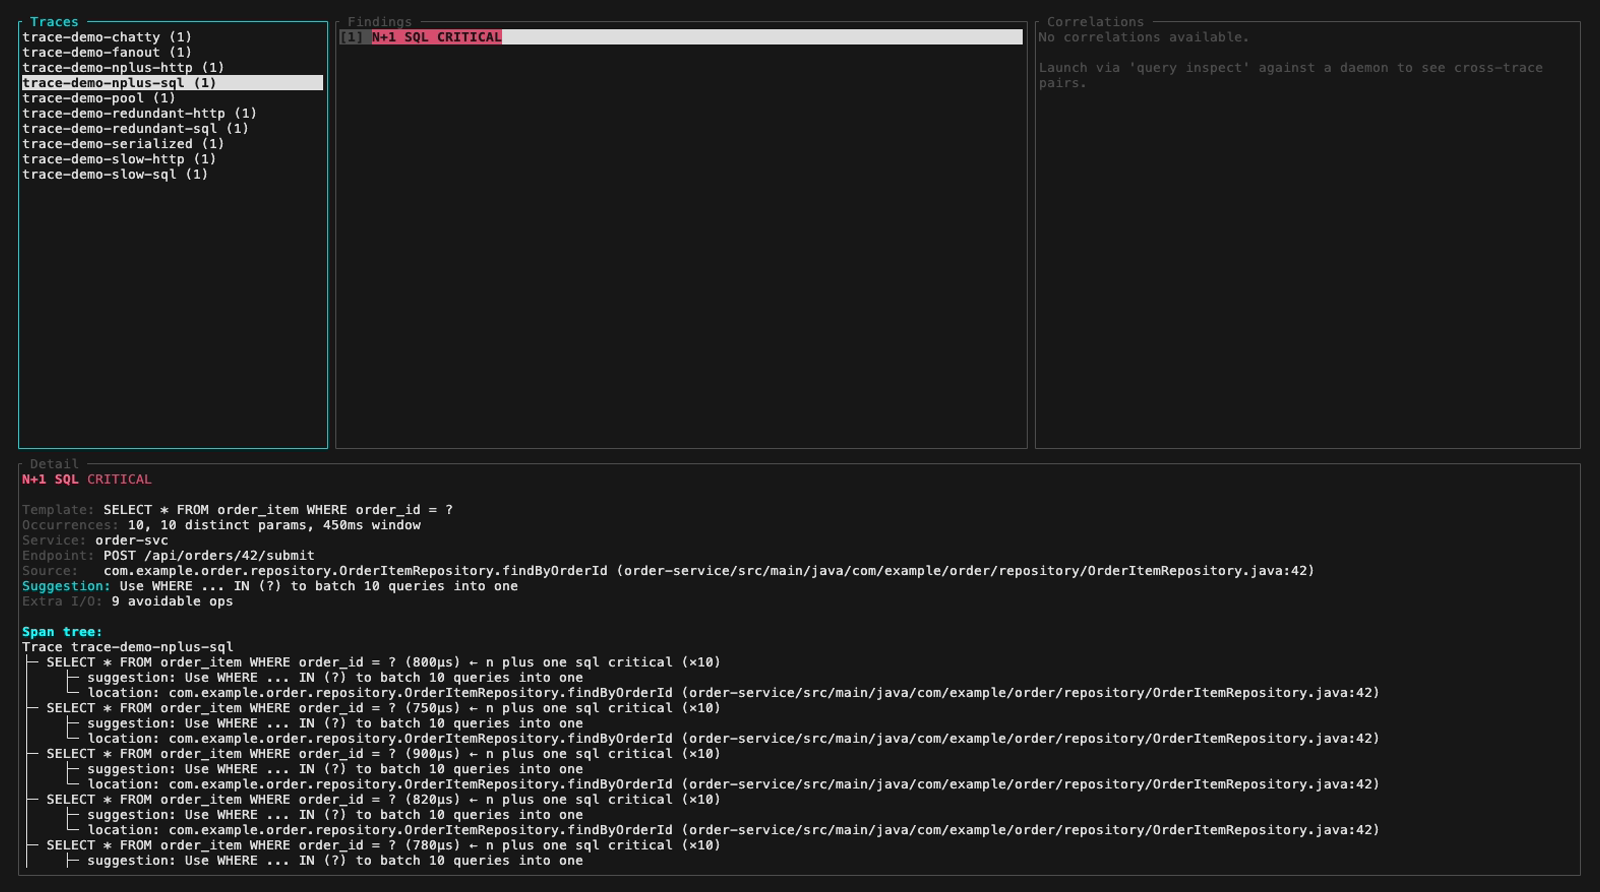
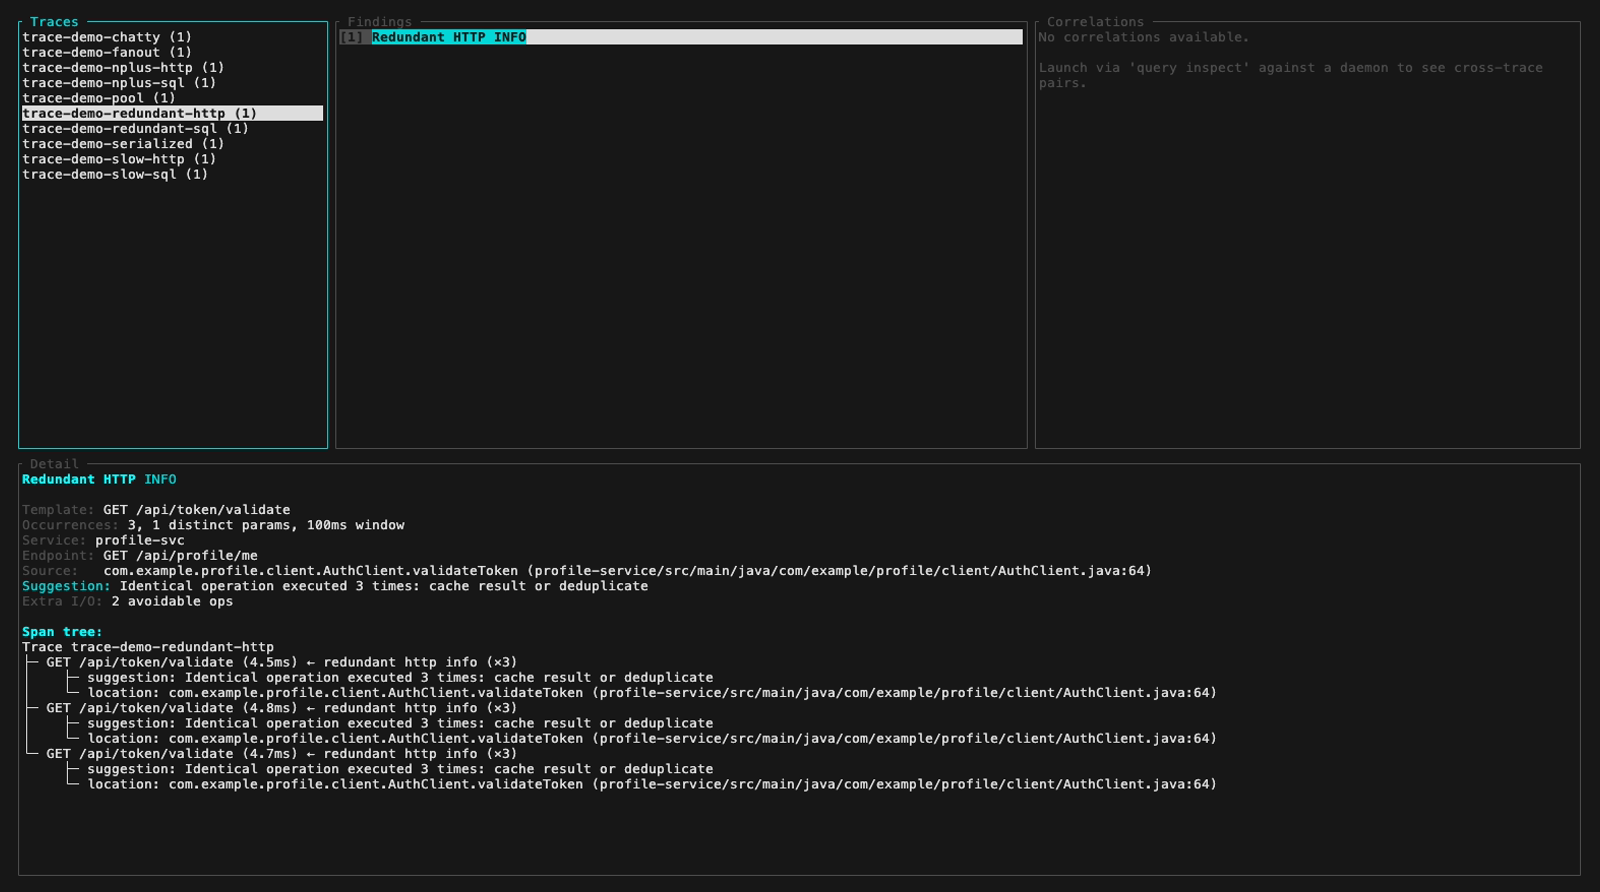
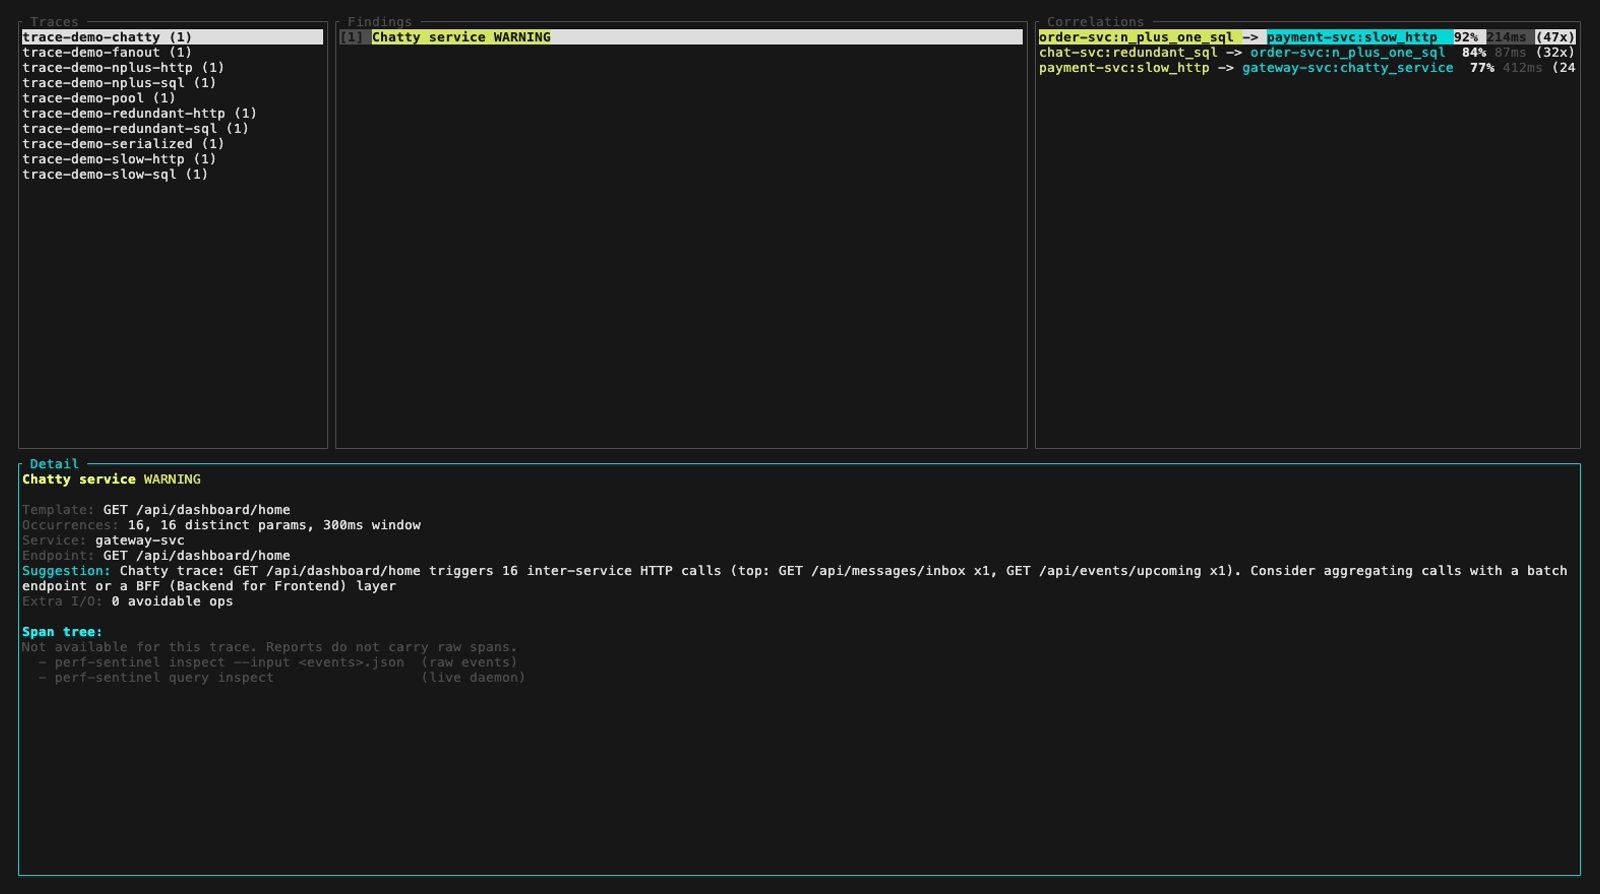
Or browse traces, findings and span trees interactively with the inspect TUI (3-panel layout, keyboard navigation):

Or produce a single-file HTML dashboard with report for post-mortem exploration in any browser. Double-click the file to open it offline, click a finding to jump to its trace tree, toggle dark/light theme - all in one self-contained file with no external resources:
The dashboard tour is shown at the top of this page under Quick look. Per-tab still frames are in the Still frames section at the bottom.
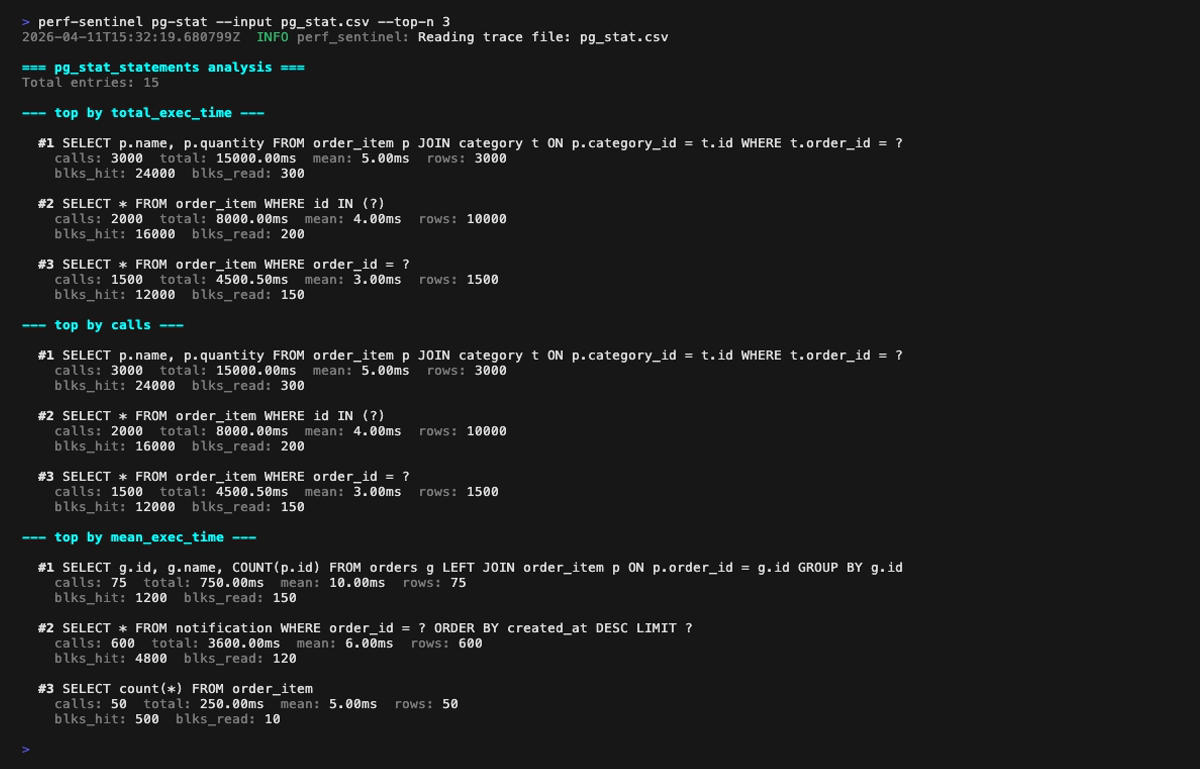
Or rank SQL hotspots from a PostgreSQL pg_stat_statements export with pg-stat. Four rankings (by total time, by call count, by mean latency, by shared-buffer blocks touched) help you spot queries that dominate the DB without being visible in your traces, a sign of instrumentation gaps:

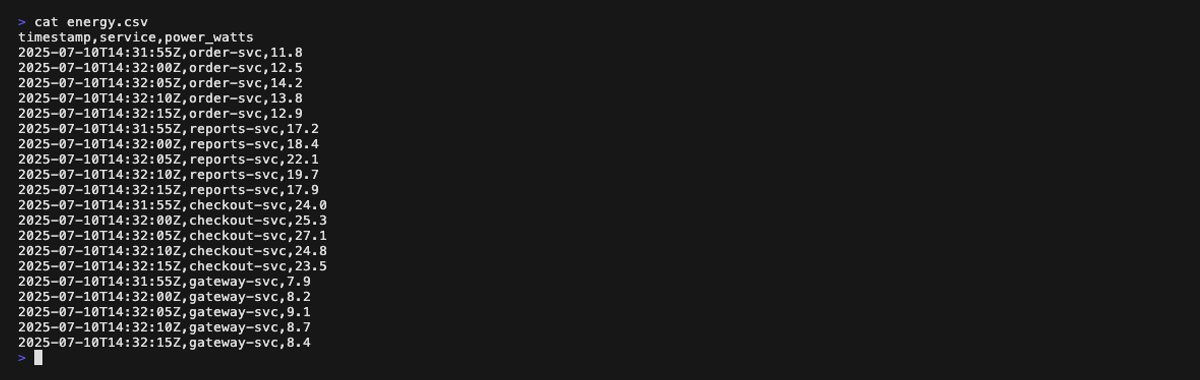
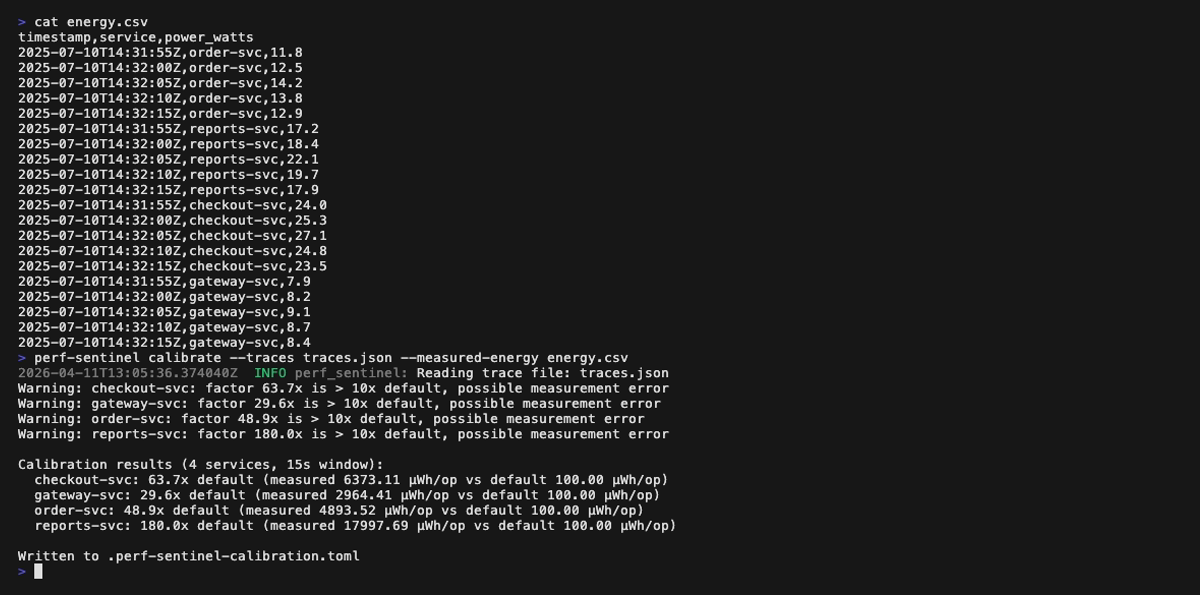
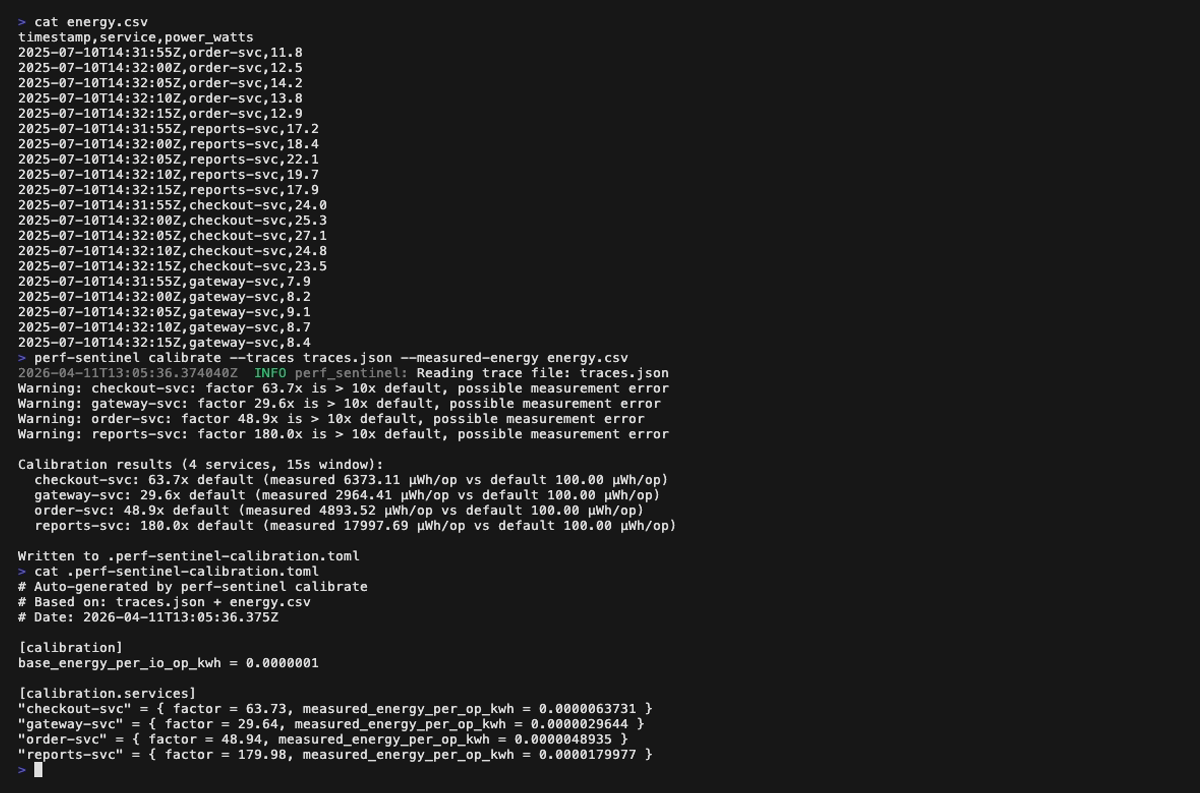
Finally, tune the I/O-to-energy coefficients to your real infrastructure with calibrate, which correlates a trace file with measured energy readings (Scaphandre, cloud monitoring, etc.) and emits a TOML file loaded via [green] calibration_file:

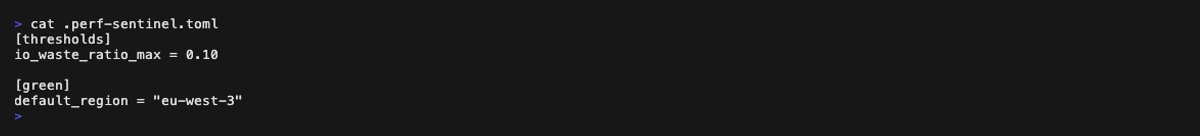
Configuration (.perf-sentinel.toml):
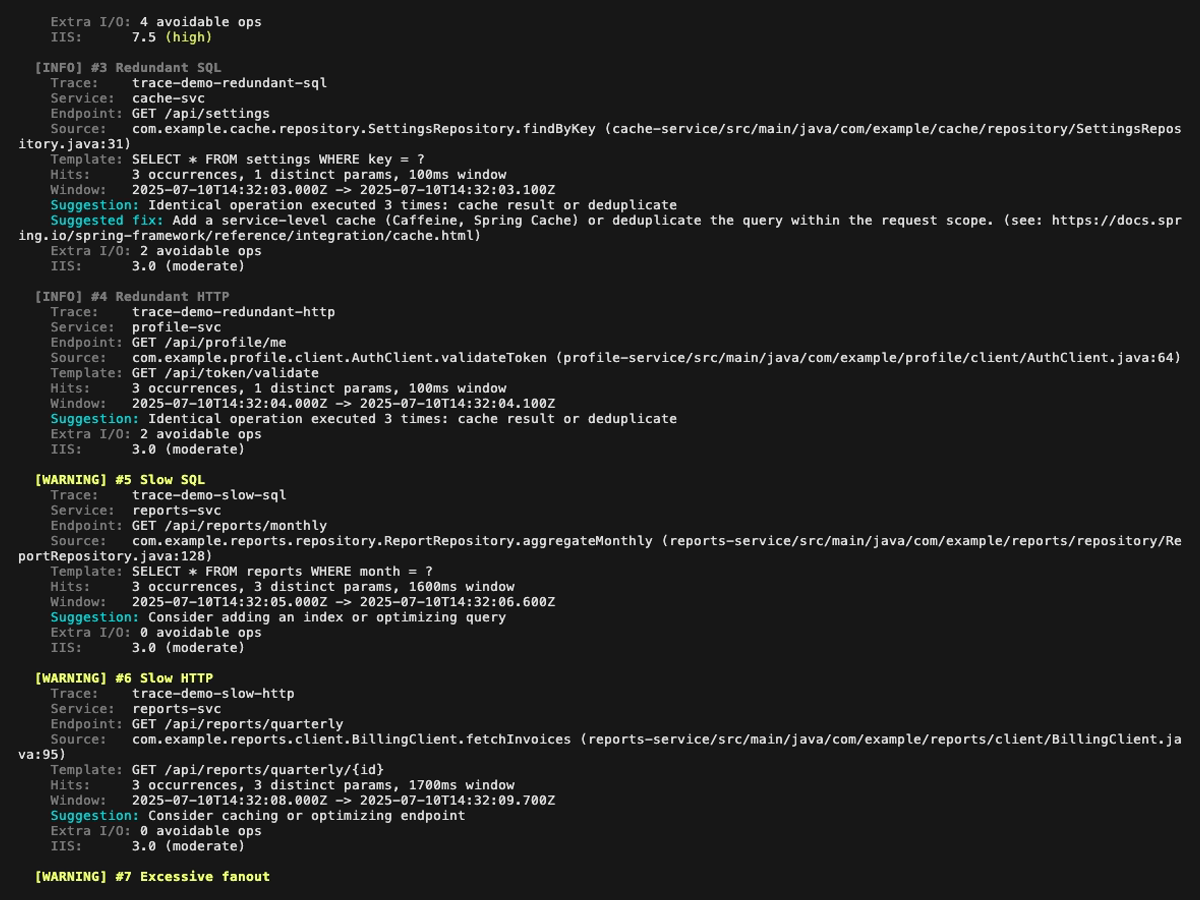
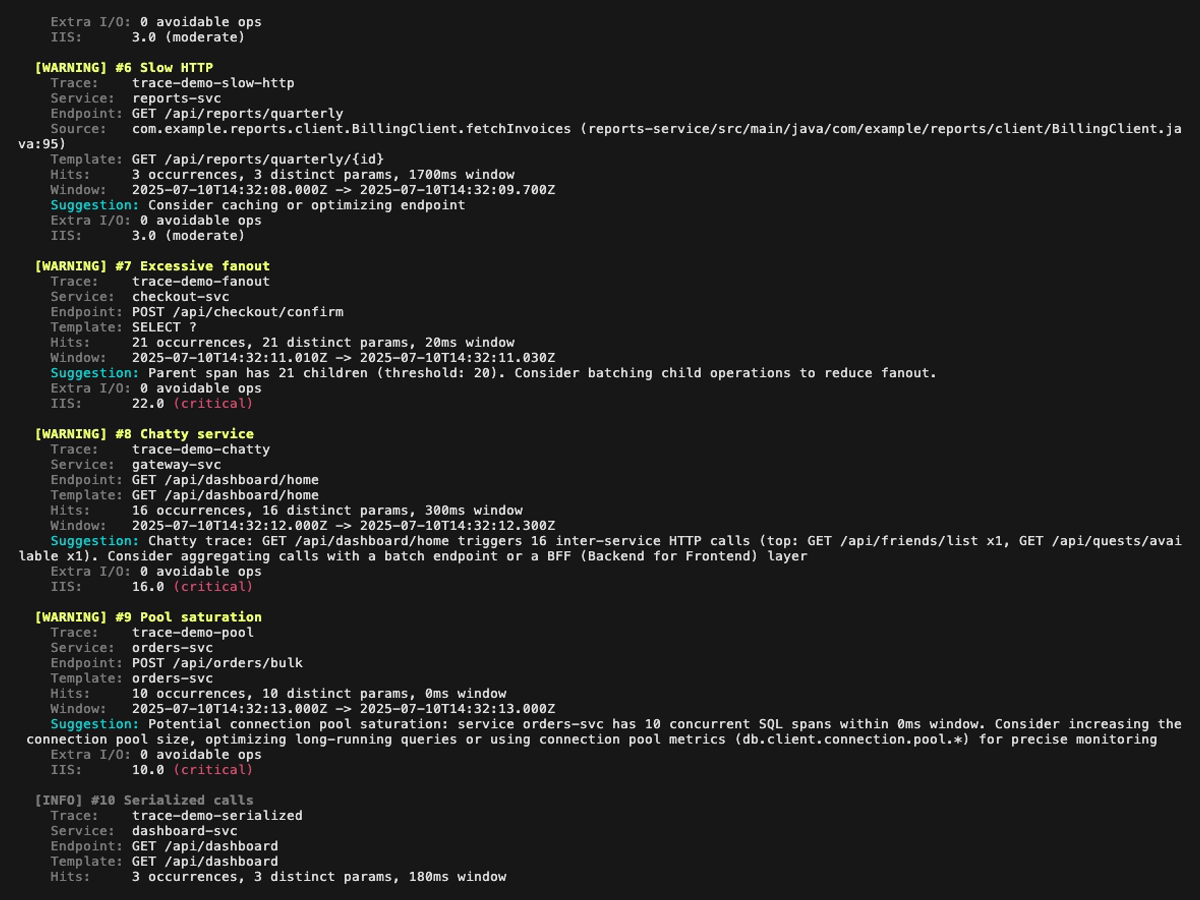
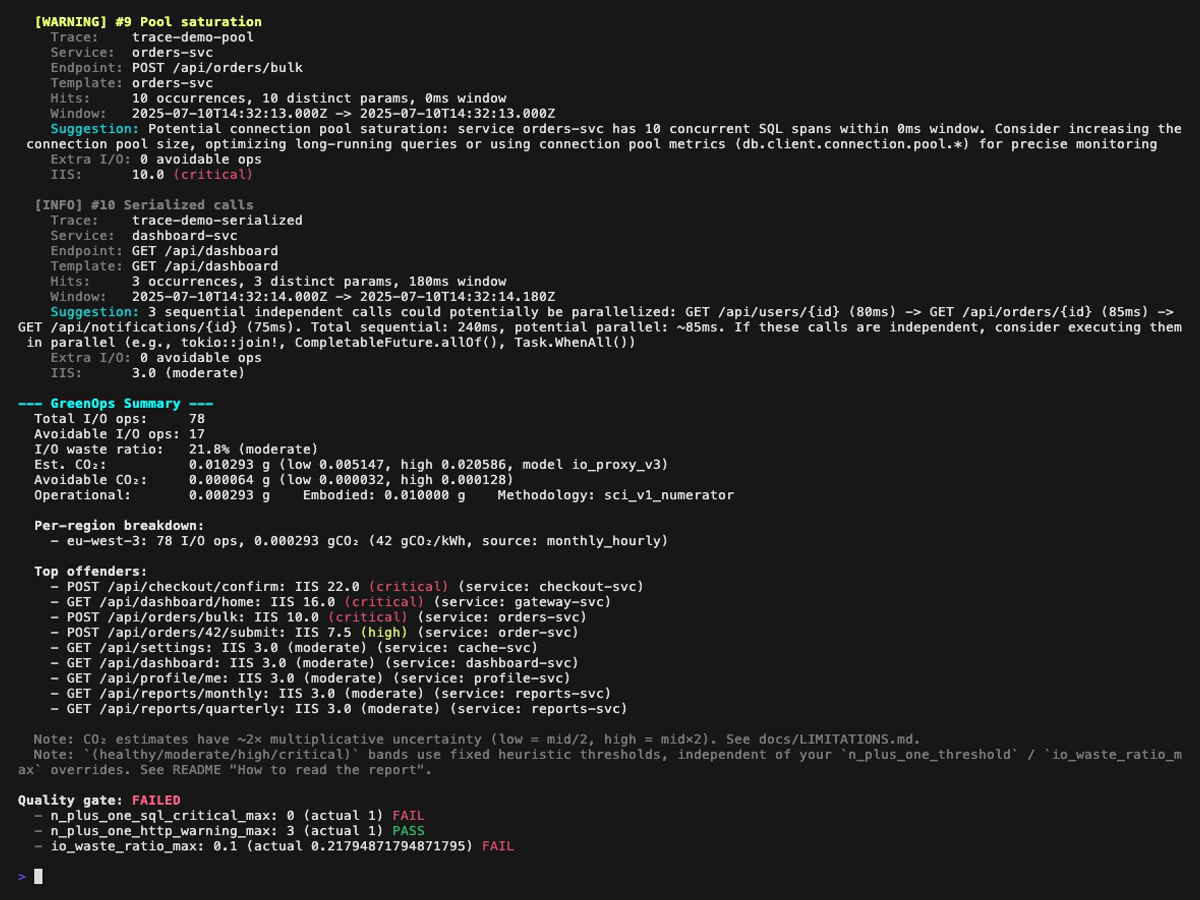
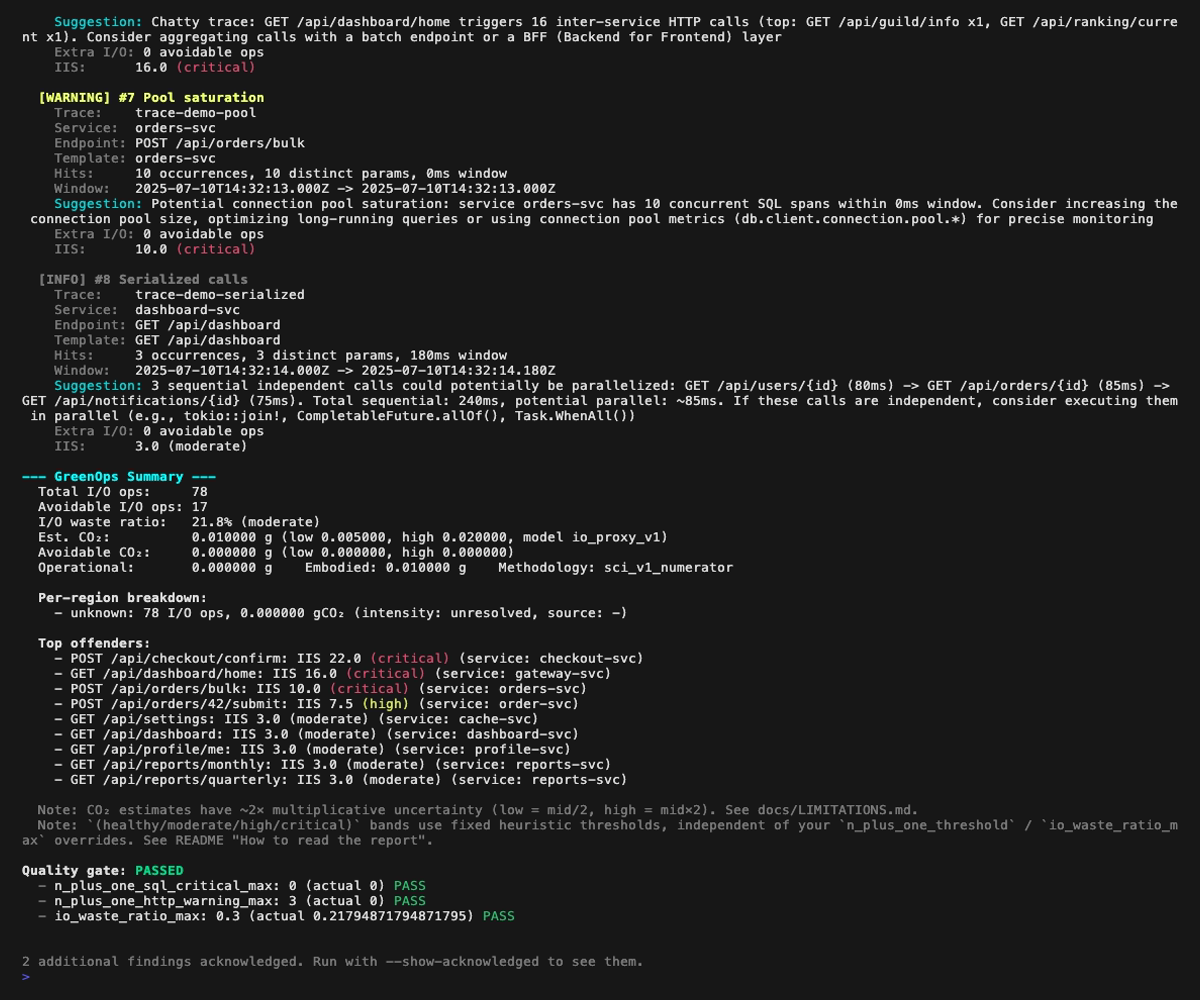
Analysis report (the first GIF above scrolls through the full report; the four still frames below cover it page by page, with a small overlap so every finding appears fully on at least one page):
Explain mode (tree view of a single trace, perf-sentinel explain --trace-id <id>). Span-anchored findings (N+1, redundant, slow, fanout) are rendered inline next to the offending spans; trace-level findings (chatty service, pool saturation, serialized calls) are surfaced in a dedicated header above the tree:
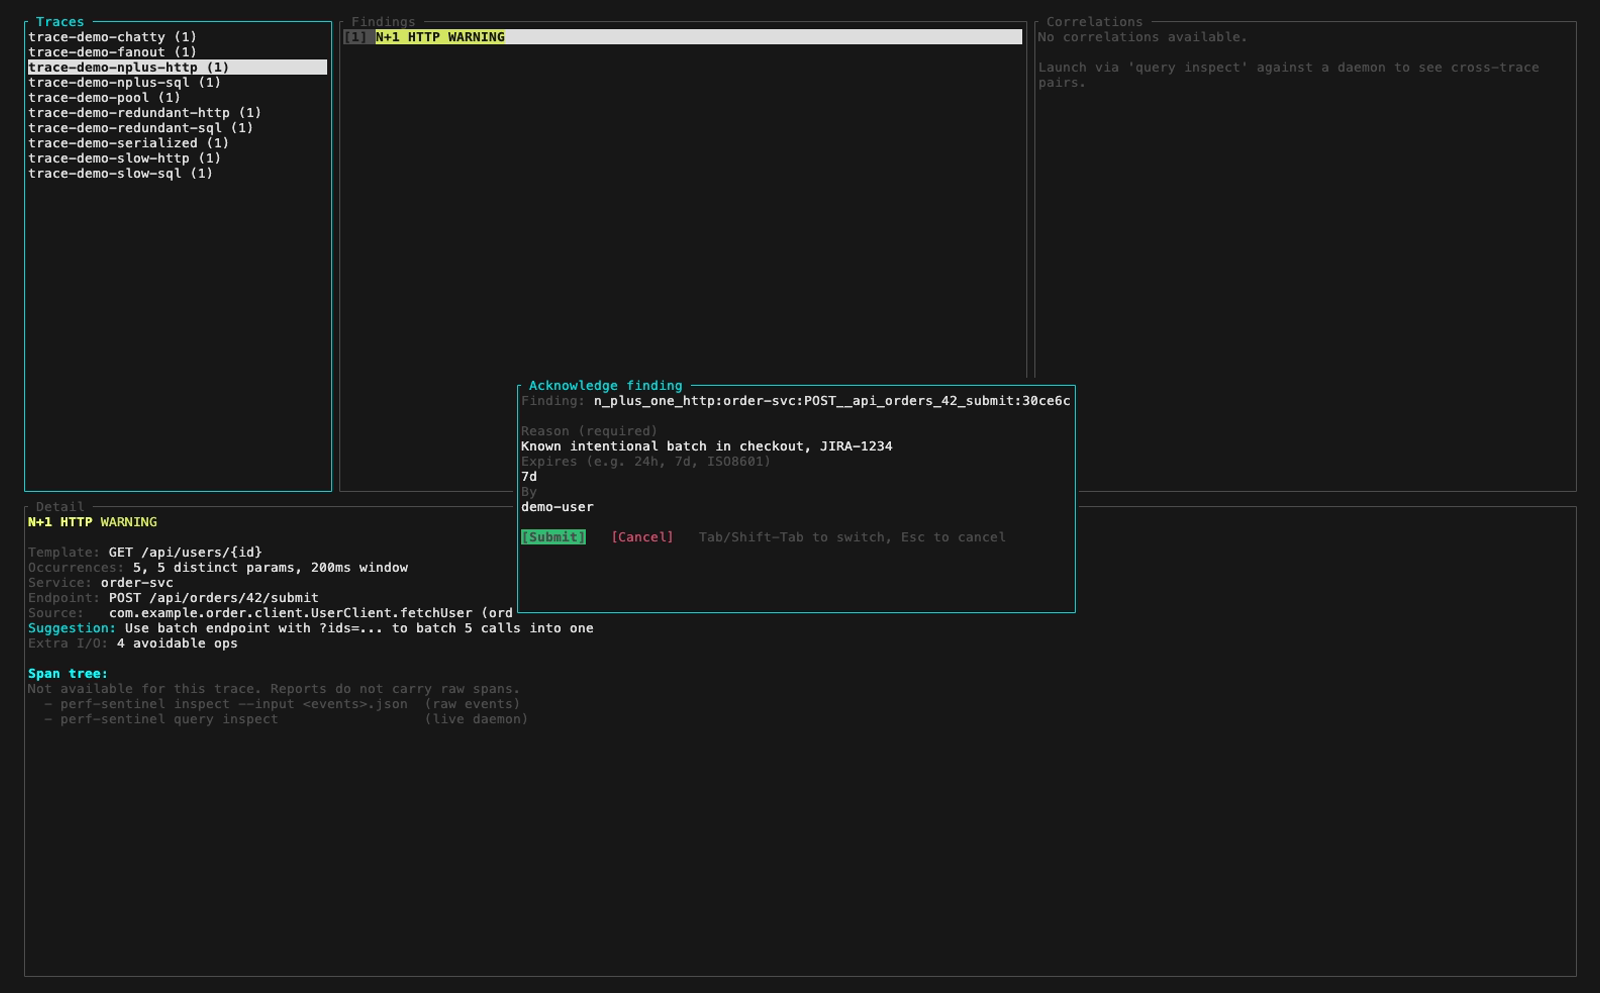
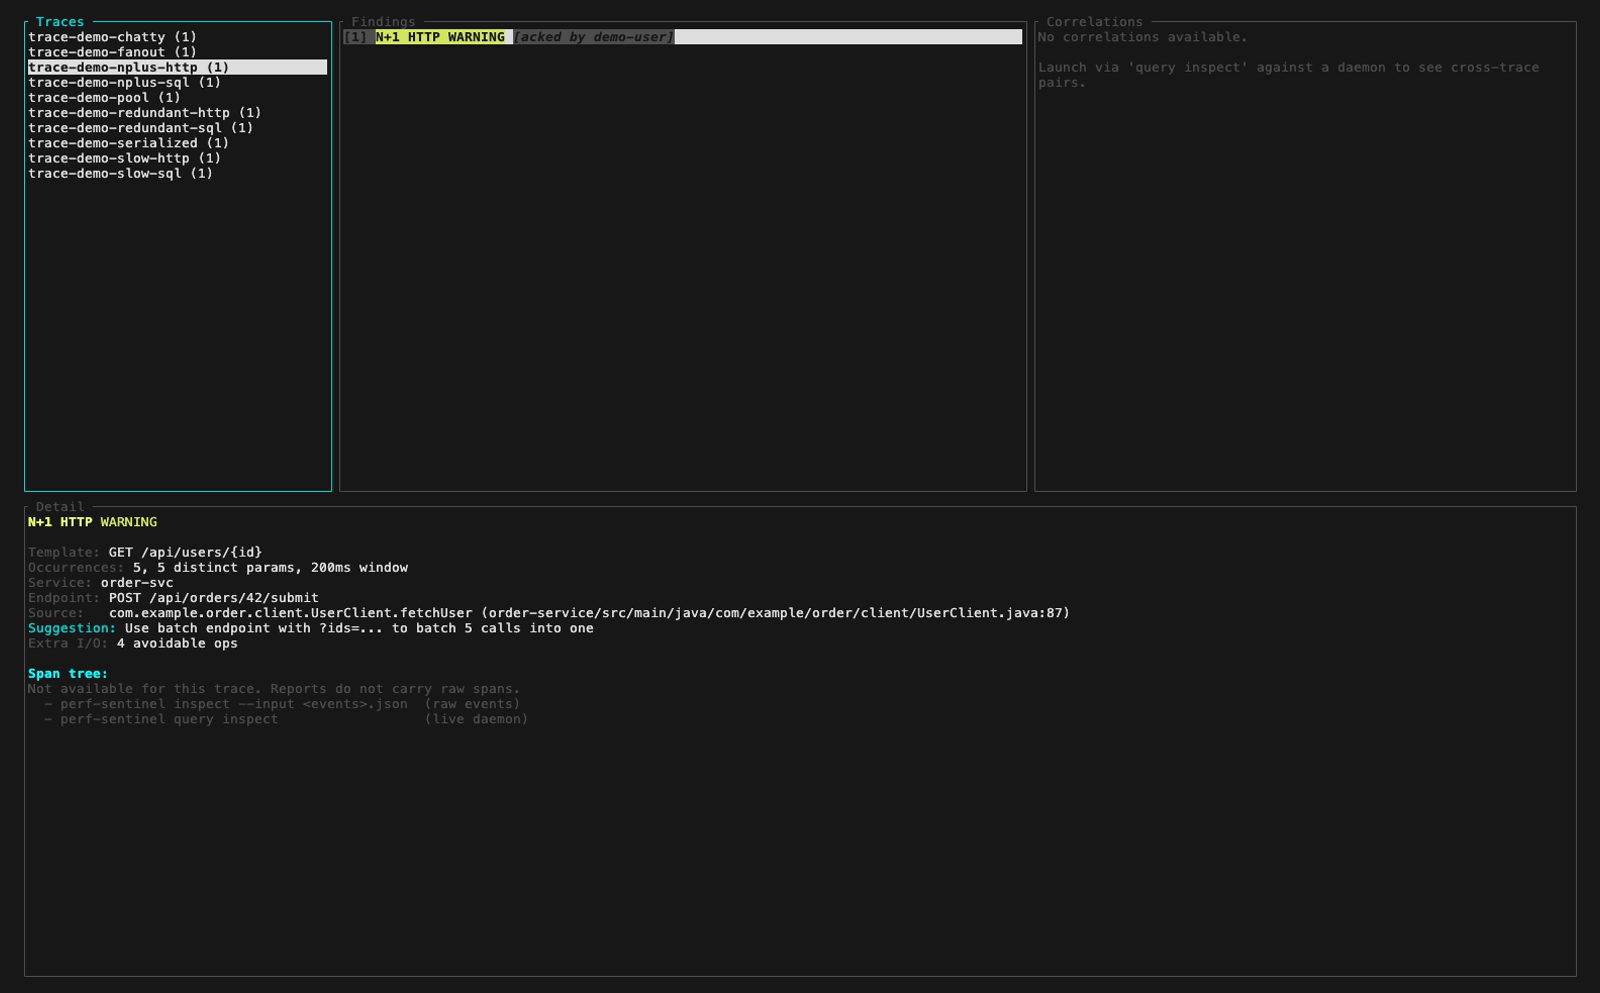
Inspect mode (interactive TUI, perf-sentinel inspect). The findings panel header colors findings by severity; below are five still frames walking the demo fixture across the three severity levels plus a detail-panel view with its scroll feature:
inspect --input also auto-detects a pre-computed Report JSON (e.g. a daemon snapshot from /api/export/report). Findings and Correlations panels light up fully. The Detail panel surfaces a span-tree-unavailable hint that points at the two paths which do carry raw spans:
pg-stat mode (perf-sentinel pg-stat --input <pg_stat_statements.csv>): ranks SQL queries three ways (by total execution time, by call count, by mean latency). Cross-reference with your traces via --traces to spot queries that dominate the DB without showing up in instrumentation:
Calibrate mode (perf-sentinel calibrate --traces <traces.json> --measured-energy <energy.csv>):
Report dashboard (perf-sentinel report): six still frames, one per tab. The GIFs above scroll through the full tour; these frames freeze each panel so details are legible when zoomed in. Each <picture> serves the dark variant when your browser advertises prefers-color-scheme: dark:
In CI mode (perf-sentinel analyze --ci), the output is a structured JSON report. The example below is the audit-grade shape (resolved region with monthly hourly profile, Electricity Maps scoring config surfaced for Scope 2 reporting). Reproduce it with:
PERF_SENTINEL_EMAPS_TOKEN=mock-token \
The default_region knob maps every span without a cloud_region attribute to eu-west-3, the region_map entry pins it to the French electricity grid, and the mock-token env var is enough to surface green_summary.scoring_config (the scraper does not run on the batch analyze path, only the methodology metadata is recorded).
The full demo run emits 11 findings, 9 top_offenders and 9 per_endpoint_io_ops entries. The block above keeps a representative subset for readability. Pre-0.5.x consumers stay forward-compatible because every recent field is additive: code_location, suggested_fix, scoring_config, regions[].intensity_estimated, correlations and transport_gco2 all use #[serde(skip_serializing_if)] so they are omitted when absent.
How to read the report
The CLI renders a (healthy / moderate / high / critical) qualifier next to I/O Intensity Score and I/O waste ratio. The same classification ships as sibling fields in the JSON report (io_intensity_band, io_waste_ratio_band), so downstream tools like SARIF converters, Grafana panels or IDE plugins can consume our heuristics or apply their own on the raw numbers.
| IIS | Band | Anchor |
|---|---|---|
| < 2.0 | healthy |
simple CRUD baseline (≤ 2 I/O per request) |
| 2.0 - 4.9 | moderate |
above baseline, worth watching (heuristic) |
| 5.0 - 9.9 | high |
N+1 detector's flag threshold (5 occurrences) |
| ≥ 10.0 | critical |
N+1 detector's CRITICAL severity escalation |
| I/O waste ratio | Band | Anchor |
|---|---|---|
| < 10% | healthy |
|
| 10 - 29% | moderate |
|
| 30 - 49% | high |
default [thresholds] io_waste_ratio_max |
| ≥ 50% | critical |
majority of analyzed I/O is waste |
JSON stability contract: the enum values above (healthy / moderate / high / critical) are stable across versions. The numeric thresholds behind them are versioned with the binary and may evolve. Consumers who want a version-independent classification should read the raw io_intensity_score and io_waste_ratio fields and apply their own bands.
For per-finding severity (Critical / Warning / Info on each detector type), see docs/design/04-DETECTION.md. For the full rationale behind the interpretation bands, see docs/LIMITATIONS.md.
Acknowledging known findings
Drop .perf-sentinel-acknowledgments.toml at your repo root to suppress findings the team has accepted as known and intentional. Acknowledged findings are filtered from the CLI output (analyze, report, inspect, diff) and do not count toward the quality gate.
[[]]
= "redundant_sql:order-service:POST__api_orders:cafebabecafebabecafebabecafebabe"
= "alice@example.com"
= "2026-05-02"
= "Cache invalidation pattern, intentional. See ADR-0042."
= "2026-12-31" # Optional, omit for permanent.
Get a finding's signature with perf-sentinel analyze --format json | jq '.findings[].signature'. Use --show-acknowledged to surface them in the output, or --no-acknowledgments for a full audit view. Full reference in docs/ACKNOWLEDGMENTS.md.
For runtime acks against a live daemon, the workflow has three surfaces: the perf-sentinel ack CLI subcommand, the live HTML dashboard (perf-sentinel report --daemon-url ...) and the TUI (perf-sentinel query inspect, press a on a finding to acknowledge, u to revoke).
CLI subcommand (perf-sentinel ack create / list / revoke against the daemon):

Default analyze output with a TOML CI ack file in place (the criticals are suppressed and the quality gate flips to PASSED, footer hints at --show-acknowledged):
TUI live mode (perf-sentinel query inspect, press a on a finding): a modal opens prefilled with the signature, prompts for reason and an optional expiry, the row gets annotated [Acked by ...] after submit:
HTML dashboard live mode (--daemon-url http://localhost:4318): per-finding Ack buttons, an Acks tab listing active acks with per-row Revoke, a Show acknowledged toggle and a connection status dot:
Public reporting
perf-sentinel produces periodic disclosures of an organization's software efficiency at calendar boundaries (quarter by default). The output is a single hash-verifiable JSON document covering a multi-week period, with runtime-calibrated energy and carbon estimates per service, region attribution, and a complete methodology block.
This is intended as raw material for transparency, not regulatory-grade reporting. Operators choose the confidentiality level:
- Internal (G1 detail): per-anti-pattern breakdown per service, for optimization decisions.
- Public (G2 aggregate): per-service totals only, no anti-pattern detail, suitable for publication on the organization's domain.
Example:
When the daemon is configured with [reporting] intent = "official", it refuses to start unless the org-config TOML can produce a publishable disclosure, surfacing every missing field in one pass. Reports below 75% runtime-calibration coverage (e.g. during a daemon migration mid-period) are rejected from official intent automatically.
The schema is versioned (perf-sentinel-report/v1.0) and aligned with the Software Carbon Intensity v1.0 specification (ISO/IEC 21031:2024).
Disclosures can be cryptographically signed via Sigstore so a consumer verifies authorship and integrity in a single command:
The full chain source -> SLSA -> binary -> report -> Sigstore signature is anchored in Rekor public. See docs/design/10-SIGSTORE-ATTESTATION.md for the cryptographic flow and docs/SUPPLY-CHAIN.md for the SLSA Build L3 binary attestation.
See docs/REPORTING.md for the CLI usage guide, docs/METHODOLOGY.md for the calculation chain, and docs/SCHEMA.md plus docs/schemas/perf-sentinel-report-v1.json for the wire format.
Architecture
Deployment topologies
perf-sentinel supports three deployment models. Pick the one that fits your environment.
1. CI batch analysis (recommended starting point)
Analyze pre-collected trace files in your CI/CD pipeline. The process exits with code 1 if the quality gate fails.
# In your CI job:
Create a .perf-sentinel.toml at your project root:
[]
= 0 # zero tolerance for N+1 SQL
= 0.30 # max 30% avoidable I/O
[]
= 5
= 500
[]
= true
= "eu-west-3" # optional: enables gCO2eq conversion
= 0.001 # SCI v1.0 M term, default 0.001 g/req
# Optional per-service overrides for multi-region deployments
# (used when OTel cloud.region is absent from spans):
# [green.service_regions]
# "order-svc" = "us-east-1"
# "chat-svc" = "ap-southeast-1"
Output formats: --format text (colored, default), --format json (structured), --format sarif (GitHub/GitLab code scanning).
2. Central collector (recommended for production)
An OpenTelemetry Collector receives traces from all services and forwards them to perf-sentinel. Zero code changes in your services.
app-1 --\
app-2 ---+--> OTel Collector --> perf-sentinel (watch)
app-3 --/
Ready-to-use files are provided in examples/:
# Start the collector + perf-sentinel
# Point your apps at the collector:
# OTEL_EXPORTER_OTLP_ENDPOINT=http://otel-collector:4317
perf-sentinel streams findings as NDJSON to stdout and exposes Prometheus metrics with Grafana Exemplars at /metrics (port 4318). A GET /health liveness endpoint is also exposed on the same port for Kubernetes or load-balancer probes. Since 0.5.19, /metrics also exposes standard process collector metrics (process_resident_memory_bytes, process_open_fds, ...) on Linux and a perf_sentinel_otlp_rejected_total{reason} counter for ingestion backpressure diagnosis. The JSON report payload carries a structured warning_details field (operator-facing snapshot warnings such as cold_start and ingestion_drops) alongside the legacy warnings field. See docs/METRICS.md and the "Reading Report warnings" section of docs/RUNBOOK.md.
See examples/otel-collector-config.yaml for the full collector config with sampling and filtering options.
3. Sidecar (per-service diagnostics)
perf-sentinel runs alongside a single service, sharing its network namespace. Useful for isolated debugging.
The app sends traces to localhost:4317 (no network hop). See examples/docker-compose-sidecar.yml.
For an end-to-end overview and the four supported topologies, see docs/INTEGRATION.md. For language-specific OTLP instrumentation (Java, Quarkus, .NET, Rust), see docs/INSTRUMENTATION.md. For the CI integration recipes (GitHub Actions, GitLab CI, Jenkins) and the diff subcommand for PR regression detection, see docs/CI.md. For the full configuration reference, see docs/CONFIGURATION.md. For the daemon HTTP query API (findings, explain, correlations, status), see docs/QUERY-API.md. For the post-mortem workflow when a trace is older than the daemon's live window, see docs/RUNBOOK.md. For in-depth design documentation, see docs/design/.
Standards and data sources
perf-sentinel's carbon estimates rest on an auditable chain of public standards, reference datasets and peer-reviewed methodology. The authoritative per-reference citation list lives in crates/sentinel-core/src/score/carbon.rs (module docstring) and in crates/sentinel-core/src/score/carbon_profiles.rs (per-region source comments on every profile entry). This section is the narrative companion.
Standard / specification
- Software Carbon Intensity v1.0 (ISO/IEC 21031:2024), Green Software Foundation.
co2.totalis the SCI v1.0 numerator(E × I) + M + T, not the per-R intensity. Full discussion in docs/design/05-GREENOPS-AND-CARBON.md.
Reference datasets
- Cloud Carbon Footprint (CCF): annual grid intensity per cloud region, per-provider PUE values sourced from each provider's own sustainability reports (AWS 1.15, GCP 1.09, Azure 1.17, generic 1.2) and the
ccf-coefficients2026-04-24 per-architecture coefficients (~390 instance types across AWS, GCP, Azure) that feed thecloud_specpowerenergy backend. - Electricity Maps: annual average intensities for 30+ regions (2023-2024) used as the
io_proxy_v1baseline, plus the real-time API (electricity_maps_apibackend, opt-in via[green.electricity_maps]). - ENTSO-E Transparency Platform: hourly generation and load data used to derive the monthly x hourly profiles for European bidding zones (FR, DE, GB, IE, NL, SE, BE, FI, IT, ES, PL, NO).
- National TSOs and grid operators: RTE eCO2mix (France), Fraunhofer ISE energy-charts.info (Germany), National Grid ESO Carbon Intensity API (UK), EIA Open Data API for US balancing authorities (PJM, CAISO, BPA), Hydro-Quebec annual reports (Canada), AEMO NEM / OpenNEM (Australia).
- Scaphandre: per-process Intel / AMD RAPL power measurement, scraped via its Prometheus endpoint when the
[green.scaphandre]section is configured.
Academic methodology
- Xu et al., Energy-Efficient Query Processing, VLDB 2010. Foundational DBMS per-operation energy benchmark that motivated the
SELECT 0.5x/INSERT 1.5x/UPDATE 1.5x/DELETE 1.2xmultipliers on the proxy model. - Tsirogiannis et al., Analyzing the Energy Efficiency of a Database Server, SIGMOD 2010. Companion benchmark establishing verb-level coefficients.
- Siddik et al., DBJoules: Towards Understanding the Energy Consumption of Database Management Systems, 2023. Confirms 7-38% inter-operation variance across verbs, cross-validation for the
per_operation_coefficientsfeature. - Guo et al., Energy-efficient Database Systems: A Systematic Survey, ACM Computing Surveys 2022. Overview of the field.
- IDEAS 2025 framework: real-time energy estimation model for SQL queries, referenced as the direction of travel for future
calibrateimprovements. - Mytton, Lunden & Malmodin, Estimating electricity usage of data transmission networks, Journal of Industrial Ecology 2024. Source for the 0.04 kWh/GB default on the optional
include_network_transportterm; the paper's 0.03-0.06 kWh/GB range is the origin of the configurablenetwork_energy_per_byte_kwhfield. - Boavizta API / HotCarbon 2024: bottom-up server lifecycle embodied carbon model, referenced for the
embodied_per_request_gco2default calibration.
Supply chain
CI inputs are pinned for reproducibility: every GitHub Action is referenced by a 40-character commit SHA (with the semver tag in a trailing comment), the production image is FROM scratch, Cargo.lock is committed and audited daily by cargo audit, and workflow GITHUB_TOKEN permissions default to contents: read with broader scopes opted into per job. Dependabot opens weekly grouped PRs for action bumps. The full policy and verification commands are in docs/SUPPLY-CHAIN.md.
Releasing
Releases follow a documented procedure with a mandatory simulation-lab validation gate. The full step-by-step, including version bumps, local gates, lab validation, pre-flight check, tag, and Helm chart release, lives in docs/RELEASE-PROCEDURE.md (FR).
Before tagging vX.Y.Z, the operator must run release-gate/check-lab-validation.sh --version vX.Y.Z. The gate fails the pre-flight if release-gate/lab-validations.txt has no PASS entry for the version, or if the latest PASS entry is older than 30 days. Ledger lines are produced by the scripts/record-validation.sh helper in the perf-sentinel-simulation-lab repository after each lab run.
License
This project is licensed under the GNU Affero General Public License v3.0.