Histogram API
=============
Use the Histogram API to define histograms that display arbitrary data
in Intel® VTune™ Profiler.
Histograms are particularly useful to display statistics that can be
split by individual units for cross-comparison.
You can use the Histogram API to:
- Track load distribution
- Track resource utilization
- Identify oversubscribed or underutilized worker nodes
Any thread in the process can access any instance of a histogram, regardless
of the thread that created it. The Histogram API call is thread-safe.
Define and Create a Histogram
-----------------------------
Before you create a histogram, you must create an `ITT API Domain
<domain-api.html>`__ . The pointer to this domain is then passed
to the primitive.
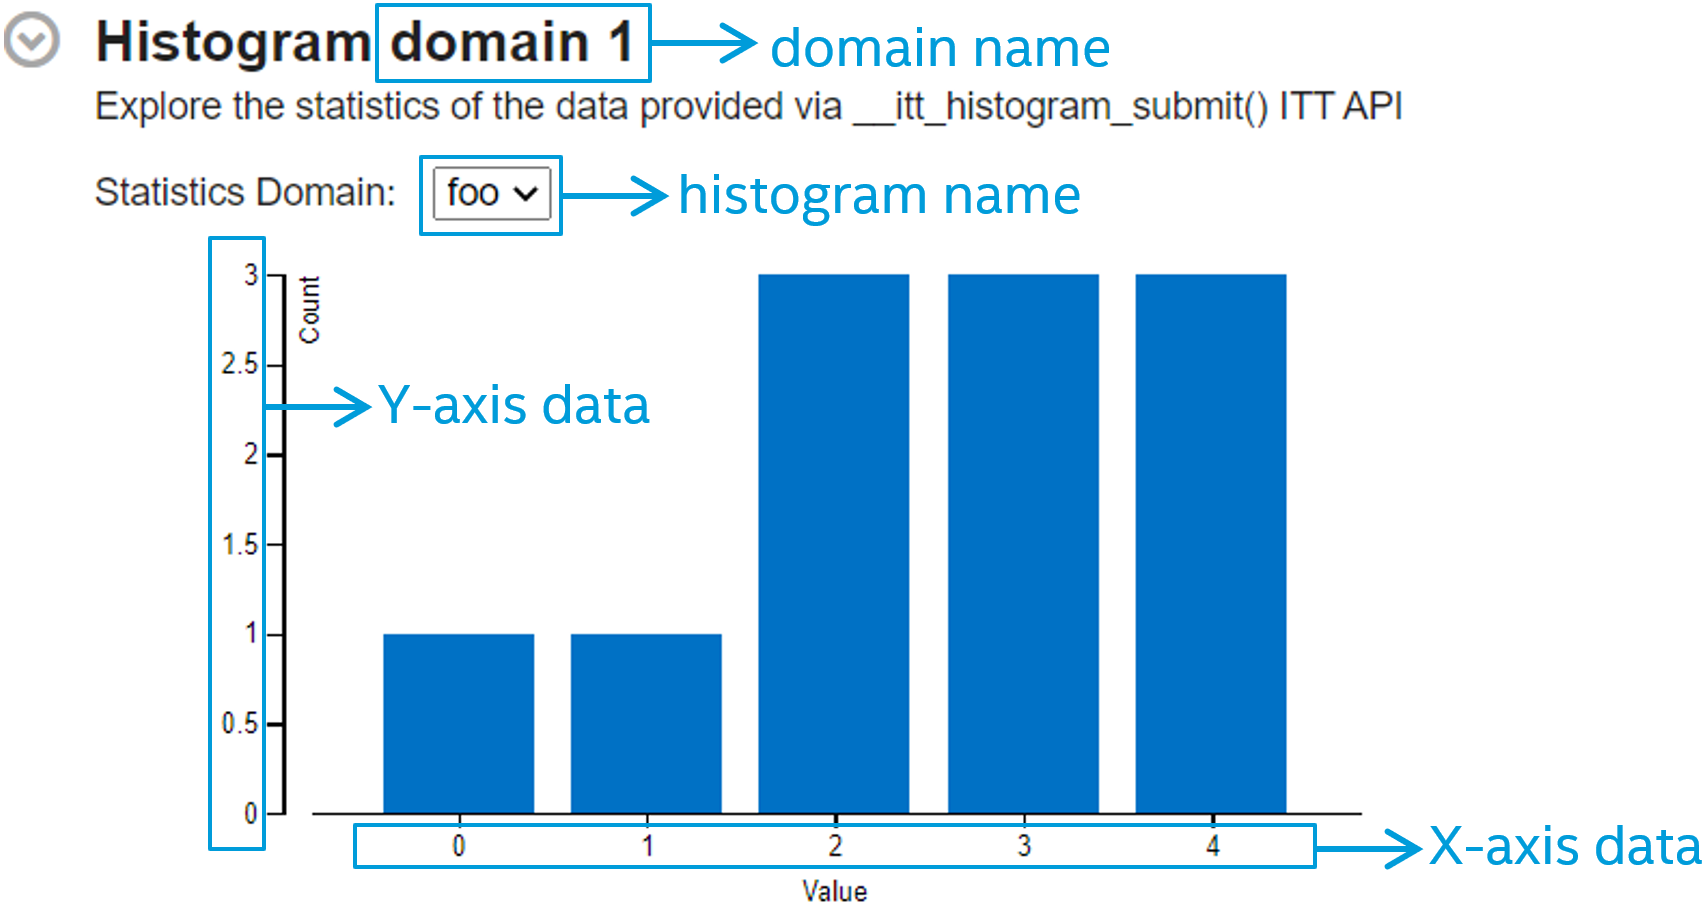
In the result display in VTune Profiler, the domain name provides a heading
for the histogram section in the **Summary** tab.
One domain can combine any number of histograms. However, the name of
the histogram must be unique within the same domain.
**Parameters of the primitives:**
+--------+--------------------------+-----------------------------------------+
| Type | Parameter | Description |
+========+==========================+=========================================+
| [in] | .. code-block:: cpp | Domain controlling the call |
| | | |
| | domain | |
+--------+--------------------------+-----------------------------------------+
| [in] | .. code-block:: cpp | Histogram name |
| | | |
| | name | |
+--------+--------------------------+-----------------------------------------+
| [in] | .. code-block:: cpp | Type of X axis data |
| | | |
| | x_axis_type | |
+--------+--------------------------+-----------------------------------------+
| [in] | .. code-block:: cpp | Type of Y axis data |
| | | |
| | y_axis_type | |
+--------+--------------------------+-----------------------------------------+
.. container:: fignone
:name: GUID-788CEBA6-9355-4E6D-ADF7-9ED7BD8441A1
|image1|
**Primitives:**
+----------------------------------------------+--------------------------------------------------------------------------+
| Use This Primitive | To Do This |
+==============================================+==========================================================================+
| .. code-block:: cpp | Create a histogram instance with the specified domain, name, and data |
| | type on Linux* and Android* OS. |
| __itt_histogram* _itt_histogram_create( | |
| __itt_domain* domain, | |
| const char* name, | |
| __itt_metadata_type x_axis_type, | |
| __itt_metadata_type y_axis_type); | |
+----------------------------------------------+--------------------------------------------------------------------------+
| .. code-block:: cpp | Create a histogram instance with the specified domain, name, and data |
| | type on Windows* OS for ASCII strings (char). |
| __itt_histogram* _itt_histogram_createA( | |
| __itt_domain* domain, | |
| const char* name, | |
| __itt_metadata_type x_axis_type, | |
| __itt_metadata_type y_axis_type); | |
+----------------------------------------------+--------------------------------------------------------------------------+
| .. code-block:: cpp | Create a histogram instance with the specified domain, name, and data |
| | type on Windows* OS for UNICODE strings (wchar_t). |
| __itt_histogram* _itt_histogram_createW( | |
| __itt_domain* domain, | |
| const wchar_t* name, | |
| __itt_metadata_type x_axis_type, | |
| __itt_metadata_type y_axis_type); | |
+----------------------------------------------+--------------------------------------------------------------------------+
Submit Data to Histogram
------------------------
**Parameters of the primitives:**
+--------+--------------------------+-------------------------------------------------+
| Type | Parameter | Description |
+========+==========================+=================================================+
| [in] | .. code-block:: cpp | Histogram instance to submit data to |
| | | |
| | histogram | |
+--------+--------------------------+-------------------------------------------------+
| [in] | .. code-block:: cpp | Number of elements in submitted axis data array |
| | | |
| | length | |
+--------+--------------------------+-------------------------------------------------+
| [in] | .. code-block:: cpp | Array containing X axis data (may be ``NULL``). |
| | | If ``x_axis_data`` is ``NULL``, VTune Profiler |
| | x_axis_data | uses the indices of the ``y_axis_data`` array. |
+--------+--------------------------+-------------------------------------------------+
| [in] | .. code-block:: cpp | Array containing Y axis data. |
| | | |
| | y_axis_data | |
+--------+--------------------------+-------------------------------------------------+
**Primitives:**
+-------------------------------------+--------------------------------------------------------------------------+
| Use This Primitive | To Do This |
+=====================================+==========================================================================+
| .. code-block:: cpp | Submit user statistics for the selected instance of the histogram. |
| | Just like the coordinates of a point on a 2D plane, the array |
| void _itt_histogram_submit( | data for the Y-axis is mapped to the array data for the X-axis. |
| __itt_histogram* histogram, | Data submitted during a workload run is summarized into one common |
| size_t length, | histogram for all calls of this primitive. To lower collection overhead, |
| void* x_axis_data, | determine an efficient interval between data submissions. |
| void* y_axis_data); | |
+-------------------------------------+--------------------------------------------------------------------------+
Usage Example
-------------
The following example creates a histogram to store worker thread
statistics:
.. code:: cpp
#include "ittnotify.h"
#include "ittnotify_types.h"
void submit_stats()
{
// Create domain
__itt_domain* domain = __itt_domain_create("Histogram statistics domain");
// Create histogram
__itt_histogram* histogram = __itt_histogram_create(domain, "Worker TID 13454", __itt_metadata_u64, __itt_metadata_u64);
// Fill the statistics arrays with profiling data:
uint64_t* x_stats, y_stats;
size_t array_size;
get_worker_stats(x_stats, y_stats, array_size);
// Submit histogram statistics:
__itt_histogram_submit(histogram, array_size, x_stats, y_stats);
}
.. |image1| image:: histogram-api-schema.png
:width: 600px