
claude-code-transcripts-ingest


CLI that ingests every Claude Code transcript under ~/.claude/projects into a
DuckDB database, with a normalised schema suited for usage / cost analysis across
sessions, subagents, tool calls, and cache tokens. Ships with an embedded viewer
served over HTTP.
Installs the cct binary.
Install
The duckdb dependency is bundled (built from C++ sources), so the install is
self-contained but takes a minute or two the first time.
Quick start
Commands
cct ingest
cct ingest [-i <dir>] [-o <file>] [-j <jobs>] [--pricing <toml>] [--no-progress]
| Flag | Default | Meaning |
|---|---|---|
-i, --input-dir |
~/.claude/projects |
Directory scanned recursively for .jsonl |
-o, --output |
~/.local/share/cct/transcripts.duckdb ($XDG_DATA_HOME/cct/transcripts.duckdb) |
Output DuckDB file (overwritten each run) |
-j, --jobs |
0 (logical CPUs) |
Parallel worker threads |
--pricing |
— | TOML overriding the seeded model_pricing table |
--no-progress |
— | Silence per-second progress on stderr |
cct serve
cct serve [--db <file>] [--port <n>]
| Flag | Default | Meaning |
|---|---|---|
--db |
~/.local/share/cct/transcripts.duckdb ($XDG_DATA_HOME/cct/transcripts.duckdb) |
DB file to serve |
--port |
8766 |
Listen port |
Transcripts
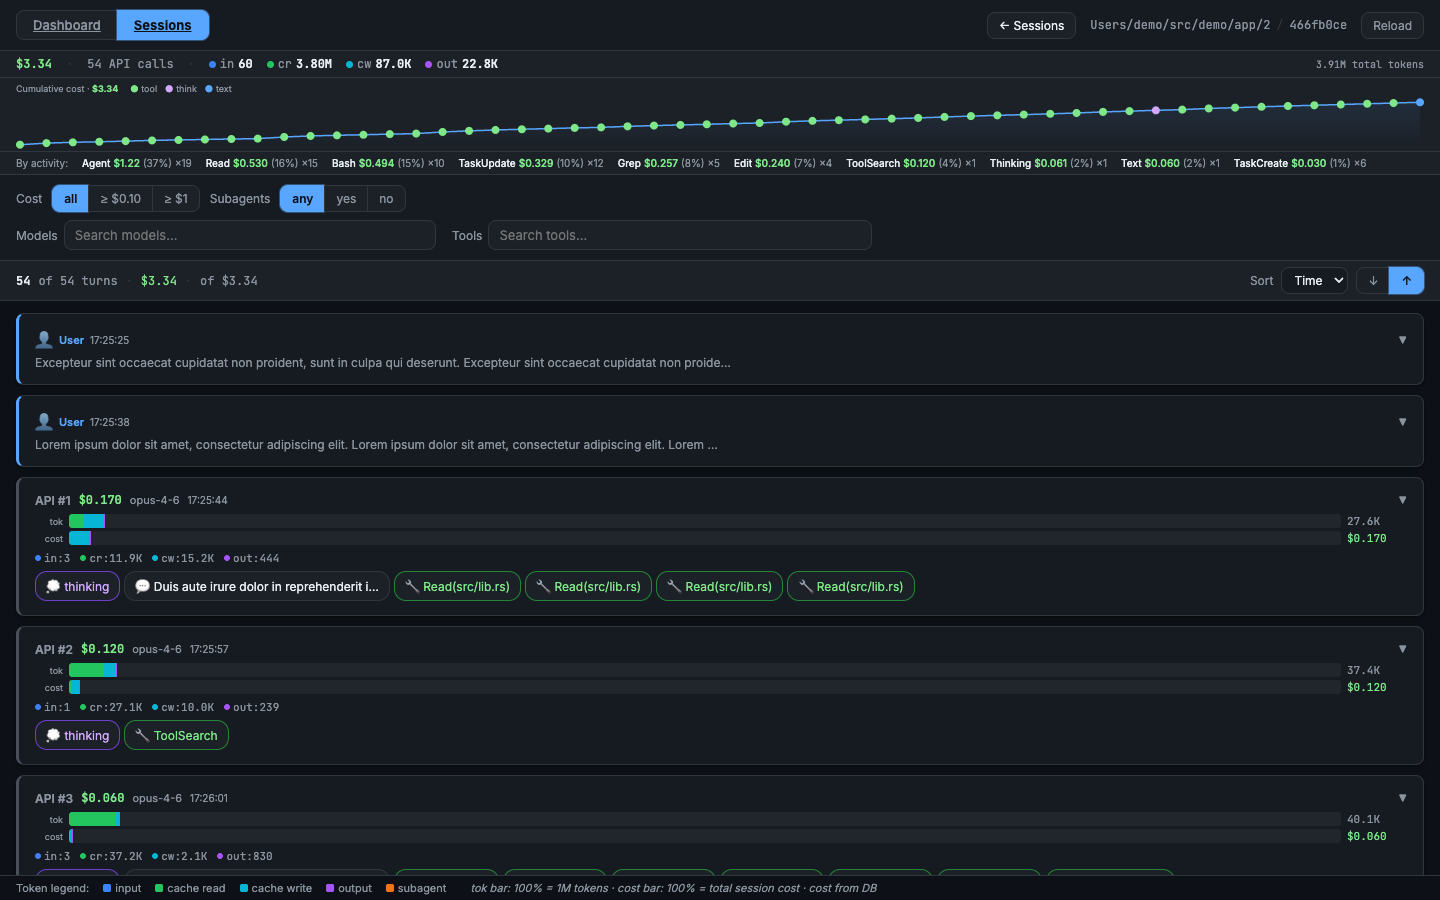
Browse by project → session → turn-by-turn timeline. Every assistant turn shows its exact cost: input, output, cache-read, and cache-creation tokens with the resulting dollar amount. Subagent calls expand inline so you can trace the full cost of any delegated task back to the turn that triggered it.
Dashboard
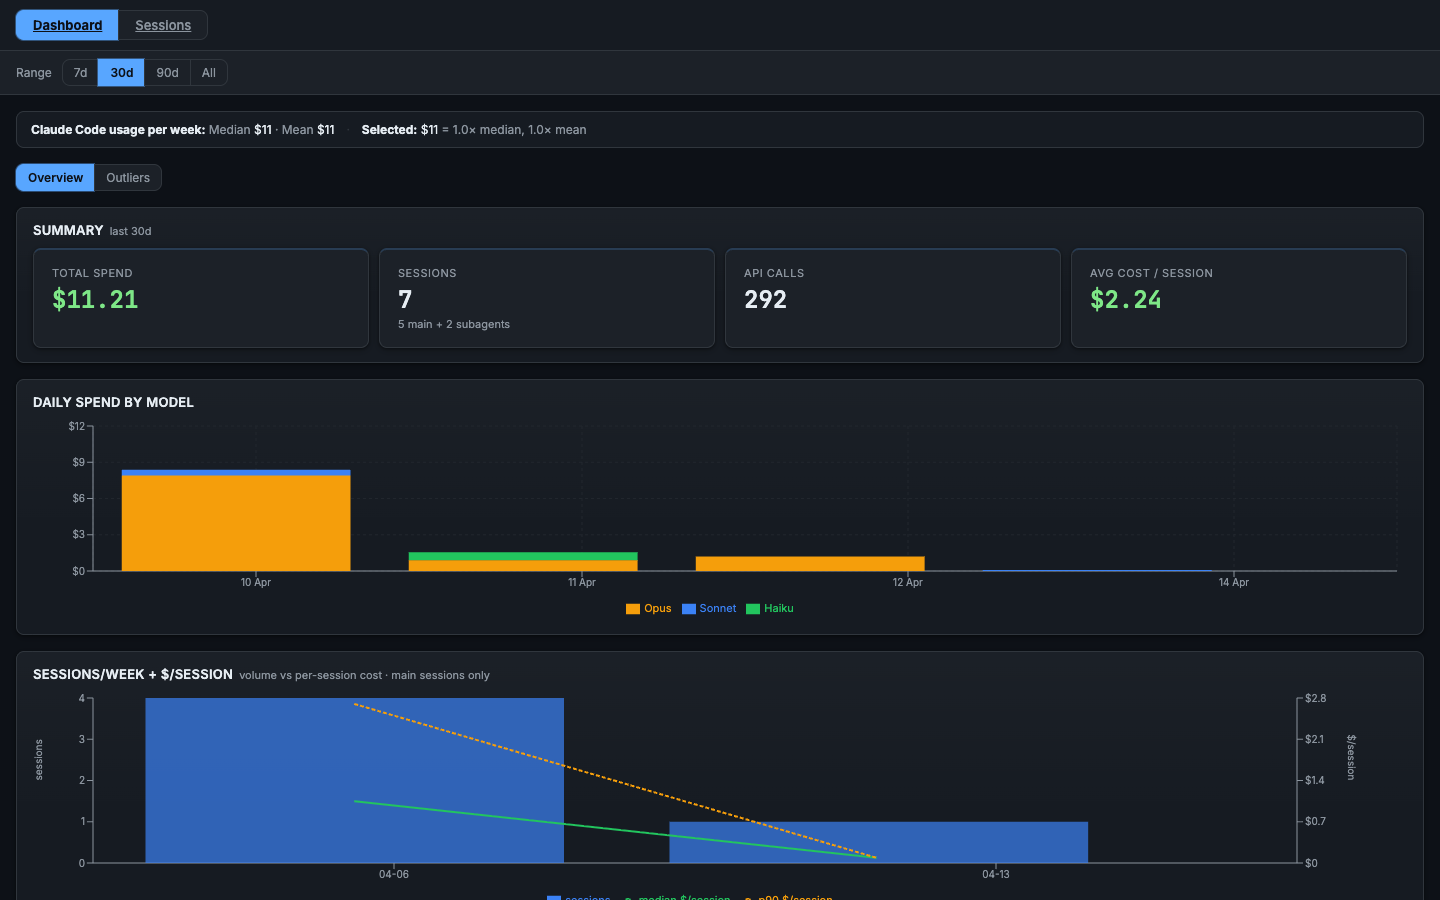
A multi-panel cost dashboard split into two sub-tabs. Switch between them with the Overview and Outliers buttons; the active tab is preserved in the URL (?sub=outliers) so you can bookmark or share a specific view.
Overview — general spend picture:
- Summary (total cost, token breakdown)
- Daily Spend by Model
- Sessions/Week + $/Session (volume vs per-session cost)
- Token-type Cost Split (main-chain vs sidechain)
- First-turn Cache-Creation Distribution (system-prompt size proxy)
- Model Breakdown
- Errors
Outliers — actionable panels for reducing spend:
- Top 1% Most-Expensive Turns (top 30 by cost, click to open session)
- Top Sessions (by cost, click to open in Transcripts)
- Context Size Distribution (peak tokens per session)
- Cache Invalidation Events
- Compaction Events
- Hour-of-Day Cost
- Artifact Leaderboards: Large Writes / Agent Prompts / Tool Results
- Top Reads by Size
- File Hotspots (files re-read across the most sessions)
- Bash Leaderboards
- MCP Tool Result Sizes
- Hook Frequency & Duration
- Skill Invocation Stats
- Agent Model Usage
- Cache Health
- Session Distribution (by turn count)
cct info
cct info [--db <file>]
Prints the DB path, file size, entry count, session count, and last ingest timestamp. Useful for confirming the DB location and freshness without opening DuckDB manually.
| Flag | Default | Meaning |
|---|---|---|
--db |
~/.local/share/cct/transcripts.duckdb ($XDG_DATA_HOME/cct/transcripts.duckdb) |
DB file to inspect |
Run cct --help / cct <subcommand> --help for the authoritative flag list.
Library
The transcript parser lives in claude-code-transcripts
and can be used standalone without DuckDB.
License
Dual-licensed under MIT OR Apache-2.0.