pub struct ChartArea { /* private fields */ }Expand description
The ChartArea struct is a representation of the background area object of
an Excel chart.
The ChartArea struct can be used to configure properties of the chart area
such as the formatting and is usually obtained via the
Chart::chart_area() method.
It is used in conjunction with the Chart struct.
§Examples
An example of formatting the chart area of a chart.
        chart.chart_area()
            .set_format(
                ChartFormat::new().set_solid_fill(
                    ChartSolidFill::new().set_color("#FFFFB3")
                ),
        );
Output file:
Implementations§
Source§impl ChartArea
impl ChartArea
Sourcepub fn new() -> ChartArea
pub fn new() -> ChartArea
Create a new ChartArea object to represent the background area object
of an Excel chart.
Sourcepub fn set_format<T>(&mut self, format: T) -> &mut ChartAreawhere
T: IntoChartFormat,
pub fn set_format<T>(&mut self, format: T) -> &mut ChartAreawhere
T: IntoChartFormat,
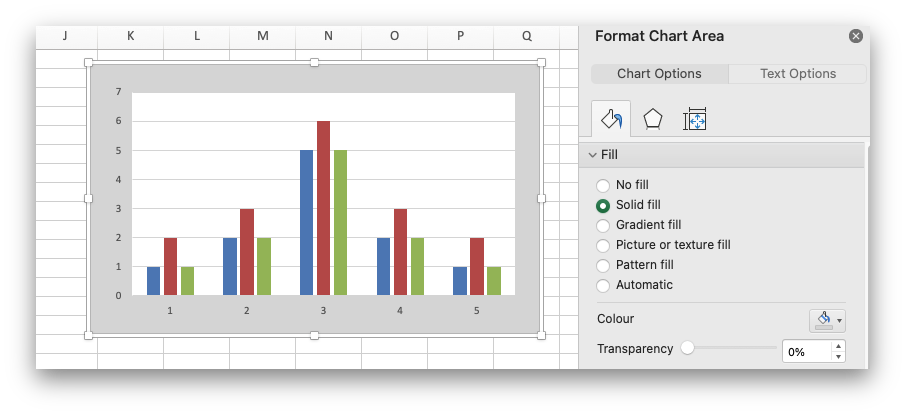
Set the formatting properties for the chart area.
Set the formatting properties for a chart area via a ChartFormat
object or a sub struct that implements IntoChartFormat. In Excel the
chart area is the background area behind the chart.
The formatting that can be applied via a ChartFormat object are:
ChartFormat::set_solid_fill(): Set theChartSolidFillproperties.ChartFormat::set_pattern_fill(): Set theChartPatternFillproperties.ChartFormat::set_gradient_fill(): Set theChartGradientFillproperties.ChartFormat::set_no_fill(): Turn off the fill for the chart object.ChartFormat::set_line(): Set theChartLineproperties.ChartFormat::set_border(): Set theChartBorderproperties. A synonym forChartLinedepending on context.ChartFormat::set_no_line(): Turn off the line for the chart object.ChartFormat::set_no_border(): Turn off the border for the chart object.
§Parameters
format: A ChartFormat struct reference or a sub struct that will
convert into a ChartFormat instance. See the docs for
IntoChartFormat for details.
§Examples
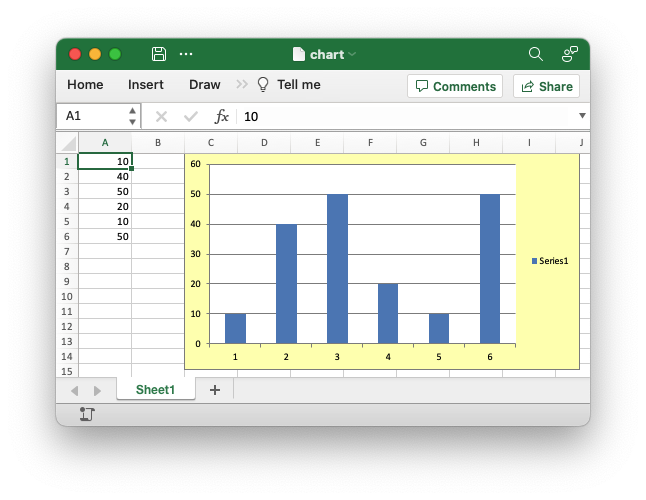
An example of formatting the chart “area” of a chart. In Excel the chart area is the background area behind the chart.
    let mut chart = Chart::new(ChartType::Column);

    // Add a data series with formatting.
    chart.add_series().set_values("Sheet1!$A$1:$A$6");

        chart.chart_area()
            .set_format(
                ChartFormat::new().set_solid_fill(
                    ChartSolidFill::new().set_color("#FFFFB3")
                ),
        );

    // Add the chart to the worksheet.
    worksheet.insert_chart(0, 2, &chart)?;
Output file:
Trait Implementations§
impl StructuralPartialEq for ChartArea
Auto Trait Implementations§
impl Freeze for ChartArea
impl RefUnwindSafe for ChartArea
impl Send for ChartArea
impl Sync for ChartArea
impl Unpin for ChartArea
impl UnsafeUnpin for ChartArea
impl UnwindSafe for ChartArea
Blanket Implementations§
Source§impl<T> BorrowMut<T> for Twhere
T: ?Sized,
impl<T> BorrowMut<T> for Twhere
T: ?Sized,
Source§fn borrow_mut(&mut self) -> &mut T
fn borrow_mut(&mut self) -> &mut T
Source§impl<T> CloneToUninit for Twhere
T: Clone,
impl<T> CloneToUninit for Twhere
T: Clone,
Source§impl<T> IntoEither for T
impl<T> IntoEither for T
Source§fn into_either(self, into_left: bool) -> Either<Self, Self>
fn into_either(self, into_left: bool) -> Either<Self, Self>
self into a Left variant of Either<Self, Self>
if into_left is true.
Converts self into a Right variant of Either<Self, Self>
otherwise. Read moreSource§fn into_either_with<F>(self, into_left: F) -> Either<Self, Self>
fn into_either_with<F>(self, into_left: F) -> Either<Self, Self>
self into a Left variant of Either<Self, Self>
if into_left(&self) returns true.
Converts self into a Right variant of Either<Self, Self>
otherwise. Read more