Struct plotters::chart::DualCoordChartContext
source · pub struct DualCoordChartContext<'a, DB: DrawingBackend, CT1: CoordTranslate, CT2: CoordTranslate> { /* private fields */ }Expand description
The chart context that has two coordinate system attached.
This situation is quite common, for example, we with two different coodinate system.
For instance this example 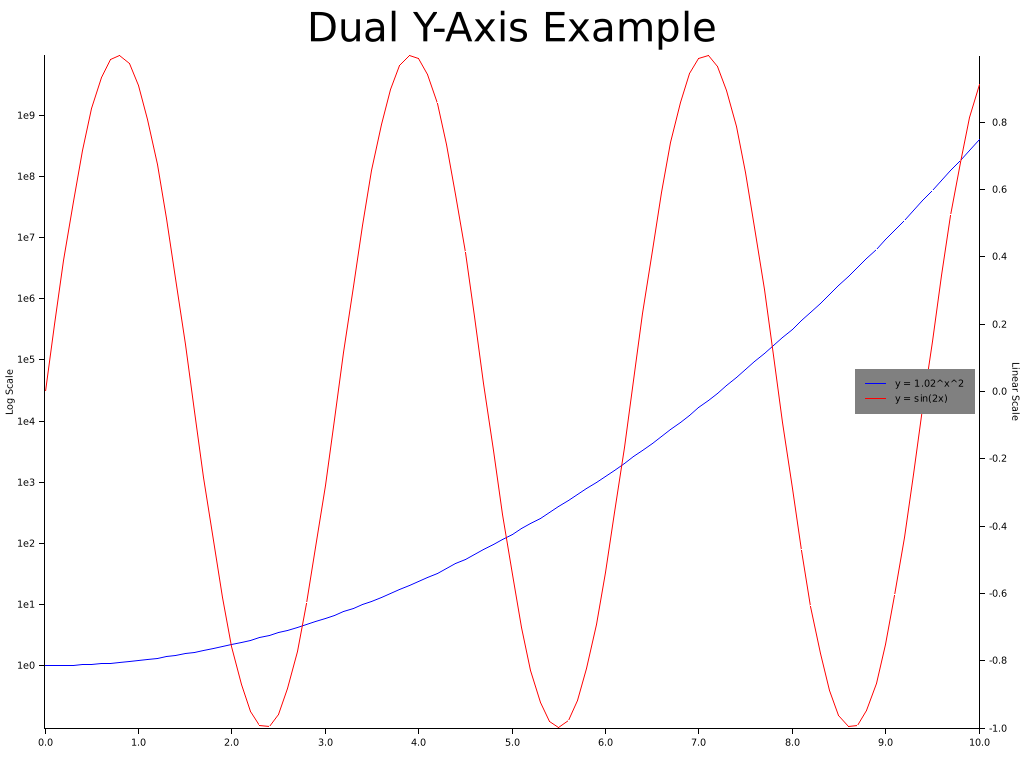 This is done by attaching a second coordinate system to ChartContext by method ChartContext::set_secondary_coord.
For instance of dual coordinate charts, see this example.
Note:
This is done by attaching a second coordinate system to ChartContext by method ChartContext::set_secondary_coord.
For instance of dual coordinate charts, see this example.
Note: DualCoordChartContext is always deref to the chart context.
- If you want to configure the secondary axis, method DualCoordChartContext::configure_secondary_axes
- If you want to draw a series using secondary coordinate system, use DualCoordChartContext::draw_secondary_series. And method ChartContext::draw_series will always use primary coordinate spec.
Implementations§
source§impl<DB: DrawingBackend, CT1: CoordTranslate, CT2: CoordTranslate> DualCoordChartContext<'_, DB, CT1, CT2>
impl<DB: DrawingBackend, CT1: CoordTranslate, CT2: CoordTranslate> DualCoordChartContext<'_, DB, CT1, CT2>
sourcepub fn into_chart_state(self) -> DualCoordChartState<CT1, CT2>
pub fn into_chart_state(self) -> DualCoordChartState<CT1, CT2>
Convert the chart context into a chart state, similar to ChartContext::into_chart_state
Convert the chart context into a sharable chart state.
sourcepub fn to_chart_state(&self) -> DualCoordChartState<CT1, CT2>where
CT1: Clone,
CT2: Clone,
pub fn to_chart_state(&self) -> DualCoordChartState<CT1, CT2>where CT1: Clone, CT2: Clone,
Copy the coordinate specs and make a chart state
source§impl<'a, DB: DrawingBackend, CT1: CoordTranslate, CT2: CoordTranslate> DualCoordChartContext<'a, DB, CT1, CT2>
impl<'a, DB: DrawingBackend, CT1: CoordTranslate, CT2: CoordTranslate> DualCoordChartContext<'a, DB, CT1, CT2>
sourcepub fn secondary_plotting_area(&self) -> &DrawingArea<DB, CT2>
pub fn secondary_plotting_area(&self) -> &DrawingArea<DB, CT2>
Get a reference to the drawing area that uses the secondary coordinate system
sourcepub fn borrow_secondary(&self) -> &ChartContext<'a, DB, CT2>
pub fn borrow_secondary(&self) -> &ChartContext<'a, DB, CT2>
Borrow a mutable reference to the chart context that uses the secondary coordinate system
source§impl<DB: DrawingBackend, CT1: CoordTranslate, CT2: ReverseCoordTranslate> DualCoordChartContext<'_, DB, CT1, CT2>
impl<DB: DrawingBackend, CT1: CoordTranslate, CT2: ReverseCoordTranslate> DualCoordChartContext<'_, DB, CT1, CT2>
sourcepub fn into_secondary_coord_trans(
self
) -> impl Fn(BackendCoord) -> Option<CT2::From>
pub fn into_secondary_coord_trans( self ) -> impl Fn(BackendCoord) -> Option<CT2::From>
Convert the chart context into the secondary coordinate translation function
source§impl<DB: DrawingBackend, CT1: ReverseCoordTranslate, CT2: ReverseCoordTranslate> DualCoordChartContext<'_, DB, CT1, CT2>
impl<DB: DrawingBackend, CT1: ReverseCoordTranslate, CT2: ReverseCoordTranslate> DualCoordChartContext<'_, DB, CT1, CT2>
sourcepub fn into_coord_trans_pair(
self
) -> (impl Fn(BackendCoord) -> Option<CT1::From>, impl Fn(BackendCoord) -> Option<CT2::From>)
pub fn into_coord_trans_pair( self ) -> (impl Fn(BackendCoord) -> Option<CT1::From>, impl Fn(BackendCoord) -> Option<CT2::From>)
Convert the chart context into a pair of closures that maps the pixel coordinate into the logical coordinate for both primary coordinate system and secondary coordinate system.
source§impl<'a, DB: DrawingBackend, CT1: CoordTranslate, XT, YT, SX, SY> DualCoordChartContext<'a, DB, CT1, Cartesian2d<SX, SY>>where
SX: ValueFormatter<XT> + Ranged<ValueType = XT>,
SY: ValueFormatter<YT> + Ranged<ValueType = YT>,
impl<'a, DB: DrawingBackend, CT1: CoordTranslate, XT, YT, SX, SY> DualCoordChartContext<'a, DB, CT1, Cartesian2d<SX, SY>>where SX: ValueFormatter<XT> + Ranged<ValueType = XT>, SY: ValueFormatter<YT> + Ranged<ValueType = YT>,
sourcepub fn configure_secondary_axes<'b>(
&'b mut self
) -> SecondaryMeshStyle<'a, 'b, SX, SY, DB>
pub fn configure_secondary_axes<'b>( &'b mut self ) -> SecondaryMeshStyle<'a, 'b, SX, SY, DB>
Start configure the style for the secondary axes
source§impl<'a, DB: DrawingBackend, X: Ranged, Y: Ranged, SX: Ranged, SY: Ranged> DualCoordChartContext<'a, DB, Cartesian2d<X, Y>, Cartesian2d<SX, SY>>
impl<'a, DB: DrawingBackend, X: Ranged, Y: Ranged, SX: Ranged, SY: Ranged> DualCoordChartContext<'a, DB, Cartesian2d<X, Y>, Cartesian2d<SX, SY>>
sourcepub fn draw_secondary_series<E, R, S>(
&mut self,
series: S
) -> Result<&mut SeriesAnno<'a, DB>, DrawingAreaErrorKind<DB::ErrorType>>where
for<'b> &'b E: PointCollection<'b, (SX::ValueType, SY::ValueType)>,
E: Drawable<DB>,
R: Borrow<E>,
S: IntoIterator<Item = R>,
pub fn draw_secondary_series<E, R, S>( &mut self, series: S ) -> Result<&mut SeriesAnno<'a, DB>, DrawingAreaErrorKind<DB::ErrorType>>where for<'b> &'b E: PointCollection<'b, (SX::ValueType, SY::ValueType)>, E: Drawable<DB>, R: Borrow<E>, S: IntoIterator<Item = R>,
Draw a series use the secondary coordinate system.
series: The series to drawReturnsthe series annotation object or error code
Methods from Deref<Target = ChartContext<'a, DB, CT1>>§
sourcepub fn configure_mesh(&mut self) -> MeshStyle<'a, '_, X, Y, DB>
pub fn configure_mesh(&mut self) -> MeshStyle<'a, '_, X, Y, DB>
Initialize a mesh configuration object and mesh drawing can be finalized by calling
the function MeshStyle::draw.
sourcepub fn backend_coord(
&self,
coord: &(X::ValueType, Y::ValueType)
) -> BackendCoord
pub fn backend_coord( &self, coord: &(X::ValueType, Y::ValueType) ) -> BackendCoord
Maps the coordinate to the backend coordinate. This is typically used with an interactive chart.
sourcepub fn configure_axes(&mut self) -> Axes3dStyle<'a, '_, X, Y, Z, DB>
pub fn configure_axes(&mut self) -> Axes3dStyle<'a, '_, X, Y, Z, DB>
Create an axis configuration object, to set line styles, labels, sizes, etc.
Default values for axis configuration are set by function Axes3dStyle::new().
Example
use plotters::prelude::*;
let drawing_area = SVGBackend::new("configure_axes.svg", (300, 200)).into_drawing_area();
drawing_area.fill(&WHITE).unwrap();
let mut chart_builder = ChartBuilder::on(&drawing_area);
let mut chart_context = chart_builder.margin_bottom(30).build_cartesian_3d(0.0..4.0, 0.0..3.0, 0.0..2.7).unwrap();
chart_context.configure_axes().tick_size(8).x_labels(4).y_labels(3).z_labels(2)
    .max_light_lines(5).axis_panel_style(GREEN.mix(0.1)).bold_grid_style(BLUE.mix(0.3))
    .light_grid_style(BLUE.mix(0.2)).label_style(("Calibri", 10))
    .x_formatter(&|x| format!("x={x}")).draw().unwrap();
The resulting chart reflects the customizations specified through configure_axes():

All these customizations are Axes3dStyle methods.
In the chart, tick_size(8) produces tick marks 8 pixels long. You can use
(5u32).percent().max(5).in_pixels(chart.plotting_area() to tell Plotters to calculate the tick mark
size as a percentage of the dimensions of the figure. See crate::style::RelativeSize and
crate::style::SizeDesc for more information.
x_labels(4) specifies a maximum of 4
tick marks and labels in the X axis. max_light_lines(5) specifies a maximum of 5 minor grid lines
between any two tick marks. axis_panel_style(GREEN.mix(0.1)) specifies the style of the panels in
the background, a light green color. bold_grid_style(BLUE.mix(0.3)) and light_grid_style(BLUE.mix(0.2))
specify the style of the major and minor grid lines, respectively. label_style() specifies the text
style of the axis labels, and x_formatter(|x| format!("x={x}")) specifies the string format of the X
axis labels.
See also
ChartContext::configure_mesh(), a similar function for 2D plots
sourcepub fn with_projection<P: FnOnce(ProjectionMatrixBuilder) -> ProjectionMatrix>(
&mut self,
pf: P
) -> &mut Self
pub fn with_projection<P: FnOnce(ProjectionMatrixBuilder) -> ProjectionMatrix>( &mut self, pf: P ) -> &mut Self
Override the 3D projection matrix. This function allows to override the default projection matrix.
pf: A function that takes the default projection matrix configuration and returns the projection matrix. This function will allow you to adjust the pitch, yaw angle and the centeral point of the projection, etc. You can also build a projection matrix which is not relies on the default configuration as well.
sourcepub fn set_3d_pixel_range(&mut self, size: (i32, i32, i32)) -> &mut Self
pub fn set_3d_pixel_range(&mut self, size: (i32, i32, i32)) -> &mut Self
Sets the 3d coordinate pixel range.
sourcepub fn configure_series_labels<'b>(
&'b mut self
) -> SeriesLabelStyle<'a, 'b, DB, CT>where
DB: 'a,
pub fn configure_series_labels<'b>( &'b mut self ) -> SeriesLabelStyle<'a, 'b, DB, CT>where DB: 'a,
Configure the styles for drawing series labels in the chart
Example
use plotters::prelude::*;
let data = [(1.0, 3.3), (2., 2.1), (3., 1.5), (4., 1.9), (5., 1.0)];
let drawing_area = SVGBackend::new("configure_series_labels.svg", (300, 200)).into_drawing_area();
drawing_area.fill(&WHITE).unwrap();
let mut chart_builder = ChartBuilder::on(&drawing_area);
chart_builder.margin(7).set_left_and_bottom_label_area_size(20);
let mut chart_context = chart_builder.build_cartesian_2d(0.0..5.5, 0.0..5.5).unwrap();
chart_context.configure_mesh().draw().unwrap();
chart_context.draw_series(LineSeries::new(data, BLACK)).unwrap().label("Series 1")
    .legend(|(x,y)| Rectangle::new([(x - 15, y + 1), (x, y)], BLACK));
chart_context.configure_series_labels().position(SeriesLabelPosition::UpperRight).margin(20)
    .legend_area_size(5).border_style(BLUE).background_style(BLUE.mix(0.1)).label_font(("Calibri", 20)).draw().unwrap();
The result is a chart with one data series labeled “Series 1” in a blue legend box:

See also
See crate::series::LineSeries for more information and examples
sourcepub fn plotting_area(&self) -> &DrawingArea<DB, CT>
pub fn plotting_area(&self) -> &DrawingArea<DB, CT>
Get a reference of underlying plotting area
sourcepub fn as_coord_spec(&self) -> &CT
pub fn as_coord_spec(&self) -> &CT
Cast the reference to a chart context to a reference to underlying coordinate specification.
sourcepub fn draw_series<B, E, R, S>(
&mut self,
series: S
) -> Result<&mut SeriesAnno<'a, DB>, DrawingAreaErrorKind<DB::ErrorType>>where
B: CoordMapper,
for<'b> &'b E: PointCollection<'b, CT::From, B>,
E: Drawable<DB, B>,
R: Borrow<E>,
S: IntoIterator<Item = R>,
pub fn draw_series<B, E, R, S>( &mut self, series: S ) -> Result<&mut SeriesAnno<'a, DB>, DrawingAreaErrorKind<DB::ErrorType>>where B: CoordMapper, for<'b> &'b E: PointCollection<'b, CT::From, B>, E: Drawable<DB, B>, R: Borrow<E>, S: IntoIterator<Item = R>,
Draws a data series. A data series in Plotters is abstracted as an iterator of elements.
See crate::series::LineSeries and ChartContext::configure_series_labels() for more information and examples.
sourcepub fn to_chart_state(&self) -> ChartState<CT>
pub fn to_chart_state(&self) -> ChartState<CT>
Make the chart context, do not consume the chart context and clone the coordinate spec