pub struct Surface { /* private fields */ }Expand description
Generates a 3D surface (or wireframe, or both)
Can render a surface, a wireframe overlay, scatter points, and a colorbar
from the same (x, y, z) matrix data. Higher-level geometry primitives
(cylinder, sphere, plane, etc.) are available via Surface::draw_cylinder,
Surface::draw_sphere, and related methods.
See Matplotlib’s documentation
§Example
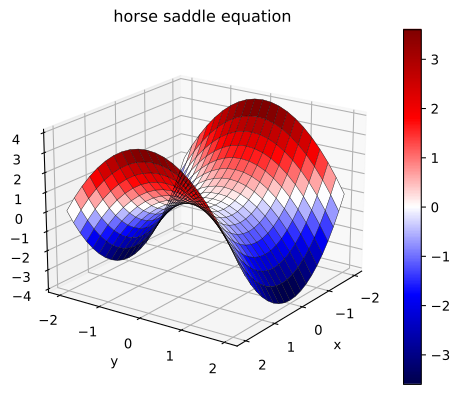
use plotpy::{generate3d, Plot, StrError, Surface};

fn main() -> Result<(), StrError> {
    // generate (x,y,z) matrices
    let n = 21;
    let (x, y, z) = generate3d(-2.0, 2.0, -2.0, 2.0, n, n, |x, y| x * x - y * y);

    // configure and draw surface + wireframe
    let mut surface = Surface::new();
    surface.set_colormap_name("seismic")
        .set_with_colorbar(true)
        .set_with_wireframe(true)
        .set_wire_line_width(0.3);

    // draw surface + wireframe
    surface.draw(&x, &y, &z);

    // add surface to plot
    let mut plot = Plot::new();
    plot.add(&surface)
        .set_title("horse saddle equation") // must be after add surface
        .set_camera(20.0, 35.0); // must be after add surface

    // save figure
    plot.save("/tmp/plotpy/doc_tests/doc_surface.svg")?;
    Ok(())
}
See also integration tests in the tests directory
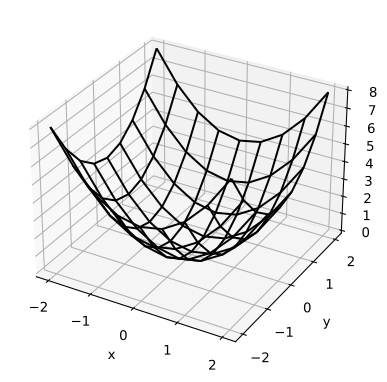
Output from some integration tests:
Implementations§
Source§impl Surface
impl Surface
Sourcepub fn new() -> Self
pub fn new() -> Self
Creates a new Surface object
Examples found in repository?
3fn main() -> Result<(), StrError> {
4    let mut surf = Surface::new();
5    surf.set_surf_color("#ff880090") // Orange with some transparency
6        .set_with_wireframe(true)
7        .set_wire_line_color("black")
8        .draw_sphere(&[0.0, 0.0, 0.0], 1.0, 30, 30)?;
9
10    let mut plot = Plot::new();
11    plot.add(&surf)
12        .set_equal_axes(true) // Forces 1:1:1 aspect ratio so it's a perfect sphere
13        .set_zoom_3d(1.5) // Zooms in optically
14        .set_figure_size_points(800.0, 800.0)
15        .save("/tmp/plotpy/sphere_zoomed.png")?;
16
17    println!("Saved /tmp/plotpy/sphere_zoomed.png");
18
19    Ok(())
20}
More examples
12fn plot_von_mises(elev: f64, azim: f64) -> Result<(), StrError> {
13    let radius = 3.0;
14    let height = 15.0;
15
16    let n_z = 50;
17    let n_theta = 50;
18
19    let z_cyl = linspace(0.0, height, n_z);
20    let theta = linspace(0.0, 2.0 * PI, n_theta);
21
22    let v = [1.0 / 3.0f64.sqrt(), 1.0 / 3.0f64.sqrt(), 1.0 / 3.0f64.sqrt()];
23    let z_axis = [0.0, 0.0, 1.0];
24
25    let mut axis = cross(&z_axis, &v);
26    let n_axis = norm(&axis);
27    for i in 0..3 {
28        axis[i] /= n_axis;
29    }
30    let angle = dot(&z_axis, &v).acos();
31
32    let r = rodrigues_rotation(&axis, angle);
33
34    let mut x_mat = vec![vec![0.0; n_theta]; n_z];
35    let mut y_mat = vec![vec![0.0; n_theta]; n_z];
36    let mut z_mat = vec![vec![0.0; n_theta]; n_z];
37
38    for i in 0..n_z {
39        for j in 0..n_theta {
40            let cx = radius * theta[j].cos();
41            let cy = radius * theta[j].sin();
42            let cz = z_cyl[i];
43
44            x_mat[i][j] = r[0][0] * cx + r[0][1] * cy + r[0][2] * cz;
45            y_mat[i][j] = r[1][0] * cx + r[1][1] * cy + r[1][2] * cz;
46            z_mat[i][j] = r[2][0] * cx + r[2][1] * cy + r[2][2] * cz;
47        }
48    }
49
50    let mut surf = Surface::new();
51    surf.set_surf_color("#7e7ed0bd")
52        .set_with_wireframe(false)
53        .draw(&x_mat, &y_mat, &z_mat);
54
55    let mut axis_line = Curve::new();
56    axis_line
57        .set_line_color("red")
58        .set_line_style("--")
59        .set_line_width(5.0)
60        .set_label("Hydrostatic Axis");
61    axis_line.draw_3d(&[0.0, 15.0], &[0.0, 15.0], &[0.0, 15.0]);
62
63    let mut legend = Legend::new();
64    legend.set_handle_len(7.0).set_location("lower left").draw();
65
66    let mut plot = Plot::new();
67    plot.add(&surf)
68        .add(&axis_line)
69        .add(&legend)
70        .set_camera(elev, azim)
71        .set_equal_axes(true)
72        .set_zoom_3d(2.1)
73        .set_hide_axes(true)
74        .set_title("von Mises Yield Surface (Cylinder)")
75        .set_figure_size_points(800.0, 800.0);
76
77    add_glyph_and_legend(&mut plot);
78
79    plot.save("/tmp/plotpy/von_mises_surface.png")?;
80
81    Ok(())
82}Sourcepub fn draw<'a, T, U>(&mut self, x: &'a T, y: &'a T, z: &'a T)
pub fn draw<'a, T, U>(&mut self, x: &'a T, y: &'a T, z: &'a T)
Draws a surface, or wireframe, or both
§Input
x– matrix with x valuesy– matrix with y valuesz– matrix with z values
§Flags
The following flags control what features are not to be drawn:
surface– draws surfacewireframe– draws wireframe
Examples found in repository?
12fn plot_von_mises(elev: f64, azim: f64) -> Result<(), StrError> {
13    let radius = 3.0;
14    let height = 15.0;
15
16    let n_z = 50;
17    let n_theta = 50;
18
19    let z_cyl = linspace(0.0, height, n_z);
20    let theta = linspace(0.0, 2.0 * PI, n_theta);
21
22    let v = [1.0 / 3.0f64.sqrt(), 1.0 / 3.0f64.sqrt(), 1.0 / 3.0f64.sqrt()];
23    let z_axis = [0.0, 0.0, 1.0];
24
25    let mut axis = cross(&z_axis, &v);
26    let n_axis = norm(&axis);
27    for i in 0..3 {
28        axis[i] /= n_axis;
29    }
30    let angle = dot(&z_axis, &v).acos();
31
32    let r = rodrigues_rotation(&axis, angle);
33
34    let mut x_mat = vec![vec![0.0; n_theta]; n_z];
35    let mut y_mat = vec![vec![0.0; n_theta]; n_z];
36    let mut z_mat = vec![vec![0.0; n_theta]; n_z];
37
38    for i in 0..n_z {
39        for j in 0..n_theta {
40            let cx = radius * theta[j].cos();
41            let cy = radius * theta[j].sin();
42            let cz = z_cyl[i];
43
44            x_mat[i][j] = r[0][0] * cx + r[0][1] * cy + r[0][2] * cz;
45            y_mat[i][j] = r[1][0] * cx + r[1][1] * cy + r[1][2] * cz;
46            z_mat[i][j] = r[2][0] * cx + r[2][1] * cy + r[2][2] * cz;
47        }
48    }
49
50    let mut surf = Surface::new();
51    surf.set_surf_color("#7e7ed0bd")
52        .set_with_wireframe(false)
53        .draw(&x_mat, &y_mat, &z_mat);
54
55    let mut axis_line = Curve::new();
56    axis_line
57        .set_line_color("red")
58        .set_line_style("--")
59        .set_line_width(5.0)
60        .set_label("Hydrostatic Axis");
61    axis_line.draw_3d(&[0.0, 15.0], &[0.0, 15.0], &[0.0, 15.0]);
62
63    let mut legend = Legend::new();
64    legend.set_handle_len(7.0).set_location("lower left").draw();
65
66    let mut plot = Plot::new();
67    plot.add(&surf)
68        .add(&axis_line)
69        .add(&legend)
70        .set_camera(elev, azim)
71        .set_equal_axes(true)
72        .set_zoom_3d(2.1)
73        .set_hide_axes(true)
74        .set_title("von Mises Yield Surface (Cylinder)")
75        .set_figure_size_points(800.0, 800.0);
76
77    add_glyph_and_legend(&mut plot);
78
79    plot.save("/tmp/plotpy/von_mises_surface.png")?;
80
81    Ok(())
82}Sourcepub fn set_row_stride(&mut self, value: usize) -> &mut Self
pub fn set_row_stride(&mut self, value: usize) -> &mut Self
Sets the row stride
Sourcepub fn set_col_stride(&mut self, value: usize) -> &mut Self
pub fn set_col_stride(&mut self, value: usize) -> &mut Self
Sets the column stride
Sourcepub fn set_with_surface(&mut self, flag: bool) -> &mut Self
pub fn set_with_surface(&mut self, flag: bool) -> &mut Self
Sets option to generate surface
Sourcepub fn set_with_wireframe(&mut self, flag: bool) -> &mut Self
pub fn set_with_wireframe(&mut self, flag: bool) -> &mut Self
Enables the drawing of a wireframe representing the surface
Examples found in repository?
3fn main() -> Result<(), StrError> {
4    let mut surf = Surface::new();
5    surf.set_surf_color("#ff880090") // Orange with some transparency
6        .set_with_wireframe(true)
7        .set_wire_line_color("black")
8        .draw_sphere(&[0.0, 0.0, 0.0], 1.0, 30, 30)?;
9
10    let mut plot = Plot::new();
11    plot.add(&surf)
12        .set_equal_axes(true) // Forces 1:1:1 aspect ratio so it's a perfect sphere
13        .set_zoom_3d(1.5) // Zooms in optically
14        .set_figure_size_points(800.0, 800.0)
15        .save("/tmp/plotpy/sphere_zoomed.png")?;
16
17    println!("Saved /tmp/plotpy/sphere_zoomed.png");
18
19    Ok(())
20}
More examples
12fn plot_von_mises(elev: f64, azim: f64) -> Result<(), StrError> {
13    let radius = 3.0;
14    let height = 15.0;
15
16    let n_z = 50;
17    let n_theta = 50;
18
19    let z_cyl = linspace(0.0, height, n_z);
20    let theta = linspace(0.0, 2.0 * PI, n_theta);
21
22    let v = [1.0 / 3.0f64.sqrt(), 1.0 / 3.0f64.sqrt(), 1.0 / 3.0f64.sqrt()];
23    let z_axis = [0.0, 0.0, 1.0];
24
25    let mut axis = cross(&z_axis, &v);
26    let n_axis = norm(&axis);
27    for i in 0..3 {
28        axis[i] /= n_axis;
29    }
30    let angle = dot(&z_axis, &v).acos();
31
32    let r = rodrigues_rotation(&axis, angle);
33
34    let mut x_mat = vec![vec![0.0; n_theta]; n_z];
35    let mut y_mat = vec![vec![0.0; n_theta]; n_z];
36    let mut z_mat = vec![vec![0.0; n_theta]; n_z];
37
38    for i in 0..n_z {
39        for j in 0..n_theta {
40            let cx = radius * theta[j].cos();
41            let cy = radius * theta[j].sin();
42            let cz = z_cyl[i];
43
44            x_mat[i][j] = r[0][0] * cx + r[0][1] * cy + r[0][2] * cz;
45            y_mat[i][j] = r[1][0] * cx + r[1][1] * cy + r[1][2] * cz;
46            z_mat[i][j] = r[2][0] * cx + r[2][1] * cy + r[2][2] * cz;
47        }
48    }
49
50    let mut surf = Surface::new();
51    surf.set_surf_color("#7e7ed0bd")
52        .set_with_wireframe(false)
53        .draw(&x_mat, &y_mat, &z_mat);
54
55    let mut axis_line = Curve::new();
56    axis_line
57        .set_line_color("red")
58        .set_line_style("--")
59        .set_line_width(5.0)
60        .set_label("Hydrostatic Axis");
61    axis_line.draw_3d(&[0.0, 15.0], &[0.0, 15.0], &[0.0, 15.0]);
62
63    let mut legend = Legend::new();
64    legend.set_handle_len(7.0).set_location("lower left").draw();
65
66    let mut plot = Plot::new();
67    plot.add(&surf)
68        .add(&axis_line)
69        .add(&legend)
70        .set_camera(elev, azim)
71        .set_equal_axes(true)
72        .set_zoom_3d(2.1)
73        .set_hide_axes(true)
74        .set_title("von Mises Yield Surface (Cylinder)")
75        .set_figure_size_points(800.0, 800.0);
76
77    add_glyph_and_legend(&mut plot);
78
79    plot.save("/tmp/plotpy/von_mises_surface.png")?;
80
81    Ok(())
82}Sourcepub fn set_with_points(&mut self, flag: bool) -> &mut Self
pub fn set_with_points(&mut self, flag: bool) -> &mut Self
Enables the drawing of (a scatter of) points representing the surface
Sourcepub fn set_colormap_index(&mut self, index: usize) -> &mut Self
pub fn set_colormap_index(&mut self, index: usize) -> &mut Self
Sets the colormap index
Options:
- 0 – bwr
- 1 – RdBu
- 2 – hsv
- 3 – jet
- 4 – terrain
- 5 – pink
- 6 – Greys
>6 – starts over from 0
Sourcepub fn set_colormap_name(&mut self, name: &str) -> &mut Self
pub fn set_colormap_name(&mut self, name: &str) -> &mut Self
Sets the colormap name
Options:
bwrRdBuhsvjetterrainpinkGreys- See the Matplotlib colormap reference for all available options
Sourcepub fn set_with_colorbar(&mut self, flag: bool) -> &mut Self
pub fn set_with_colorbar(&mut self, flag: bool) -> &mut Self
Sets option to draw a colorbar
Sourcepub fn set_colorbar_label(&mut self, label: &str) -> &mut Self
pub fn set_colorbar_label(&mut self, label: &str) -> &mut Self
Sets the colorbar label
Sourcepub fn set_number_format_cb(&mut self, format: &str) -> &mut Self
pub fn set_number_format_cb(&mut self, format: &str) -> &mut Self
Sets the number format for the labels in the colorbar (cb)
Sourcepub fn set_surf_color(&mut self, color: &str) -> &mut Self
pub fn set_surf_color(&mut self, color: &str) -> &mut Self
Sets a constant color for the surface (disables colormap)
Examples found in repository?
3fn main() -> Result<(), StrError> {
4    let mut surf = Surface::new();
5    surf.set_surf_color("#ff880090") // Orange with some transparency
6        .set_with_wireframe(true)
7        .set_wire_line_color("black")
8        .draw_sphere(&[0.0, 0.0, 0.0], 1.0, 30, 30)?;
9
10    let mut plot = Plot::new();
11    plot.add(&surf)
12        .set_equal_axes(true) // Forces 1:1:1 aspect ratio so it's a perfect sphere
13        .set_zoom_3d(1.5) // Zooms in optically
14        .set_figure_size_points(800.0, 800.0)
15        .save("/tmp/plotpy/sphere_zoomed.png")?;
16
17    println!("Saved /tmp/plotpy/sphere_zoomed.png");
18
19    Ok(())
20}
More examples
12fn plot_von_mises(elev: f64, azim: f64) -> Result<(), StrError> {
13    let radius = 3.0;
14    let height = 15.0;
15
16    let n_z = 50;
17    let n_theta = 50;
18
19    let z_cyl = linspace(0.0, height, n_z);
20    let theta = linspace(0.0, 2.0 * PI, n_theta);
21
22    let v = [1.0 / 3.0f64.sqrt(), 1.0 / 3.0f64.sqrt(), 1.0 / 3.0f64.sqrt()];
23    let z_axis = [0.0, 0.0, 1.0];
24
25    let mut axis = cross(&z_axis, &v);
26    let n_axis = norm(&axis);
27    for i in 0..3 {
28        axis[i] /= n_axis;
29    }
30    let angle = dot(&z_axis, &v).acos();
31
32    let r = rodrigues_rotation(&axis, angle);
33
34    let mut x_mat = vec![vec![0.0; n_theta]; n_z];
35    let mut y_mat = vec![vec![0.0; n_theta]; n_z];
36    let mut z_mat = vec![vec![0.0; n_theta]; n_z];
37
38    for i in 0..n_z {
39        for j in 0..n_theta {
40            let cx = radius * theta[j].cos();
41            let cy = radius * theta[j].sin();
42            let cz = z_cyl[i];
43
44            x_mat[i][j] = r[0][0] * cx + r[0][1] * cy + r[0][2] * cz;
45            y_mat[i][j] = r[1][0] * cx + r[1][1] * cy + r[1][2] * cz;
46            z_mat[i][j] = r[2][0] * cx + r[2][1] * cy + r[2][2] * cz;
47        }
48    }
49
50    let mut surf = Surface::new();
51    surf.set_surf_color("#7e7ed0bd")
52        .set_with_wireframe(false)
53        .draw(&x_mat, &y_mat, &z_mat);
54
55    let mut axis_line = Curve::new();
56    axis_line
57        .set_line_color("red")
58        .set_line_style("--")
59        .set_line_width(5.0)
60        .set_label("Hydrostatic Axis");
61    axis_line.draw_3d(&[0.0, 15.0], &[0.0, 15.0], &[0.0, 15.0]);
62
63    let mut legend = Legend::new();
64    legend.set_handle_len(7.0).set_location("lower left").draw();
65
66    let mut plot = Plot::new();
67    plot.add(&surf)
68        .add(&axis_line)
69        .add(&legend)
70        .set_camera(elev, azim)
71        .set_equal_axes(true)
72        .set_zoom_3d(2.1)
73        .set_hide_axes(true)
74        .set_title("von Mises Yield Surface (Cylinder)")
75        .set_figure_size_points(800.0, 800.0);
76
77    add_glyph_and_legend(&mut plot);
78
79    plot.save("/tmp/plotpy/von_mises_surface.png")?;
80
81    Ok(())
82}Sourcepub fn set_surf_line_color(&mut self, color: &str) -> &mut Self
pub fn set_surf_line_color(&mut self, color: &str) -> &mut Self
Sets the color of surface lines
Sourcepub fn set_surf_line_style(&mut self, style: &str) -> &mut Self
pub fn set_surf_line_style(&mut self, style: &str) -> &mut Self
Sets the style of surface lines
Options:
- “
-”, “:”, “--”, “-.”
Sourcepub fn set_surf_line_width(&mut self, width: f64) -> &mut Self
pub fn set_surf_line_width(&mut self, width: f64) -> &mut Self
Sets the width of surface lines
Sourcepub fn set_wire_line_color(&mut self, color: &str) -> &mut Self
pub fn set_wire_line_color(&mut self, color: &str) -> &mut Self
Sets the color of wireframe lines
Examples found in repository?
3fn main() -> Result<(), StrError> {
4    let mut surf = Surface::new();
5    surf.set_surf_color("#ff880090") // Orange with some transparency
6        .set_with_wireframe(true)
7        .set_wire_line_color("black")
8        .draw_sphere(&[0.0, 0.0, 0.0], 1.0, 30, 30)?;
9
10    let mut plot = Plot::new();
11    plot.add(&surf)
12        .set_equal_axes(true) // Forces 1:1:1 aspect ratio so it's a perfect sphere
13        .set_zoom_3d(1.5) // Zooms in optically
14        .set_figure_size_points(800.0, 800.0)
15        .save("/tmp/plotpy/sphere_zoomed.png")?;
16
17    println!("Saved /tmp/plotpy/sphere_zoomed.png");
18
19    Ok(())
20}Sourcepub fn set_wire_line_style(&mut self, style: &str) -> &mut Self
pub fn set_wire_line_style(&mut self, style: &str) -> &mut Self
Sets the style of wireframe lines
Options:
- “
-”, “:”, “--”, “-.”
Sourcepub fn set_wire_line_width(&mut self, width: f64) -> &mut Self
pub fn set_wire_line_width(&mut self, width: f64) -> &mut Self
Sets the width of wireframe lines
Sourcepub fn set_point_color(&mut self, color: &str) -> &mut Self
pub fn set_point_color(&mut self, color: &str) -> &mut Self
Sets the color of point markers
Sourcepub fn set_point_void(&mut self, flag: bool) -> &mut Self
pub fn set_point_void(&mut self, flag: bool) -> &mut Self
Sets the option to draw a void point marker (edge only)
Sourcepub fn set_point_line_color(&mut self, color: &str) -> &mut Self
pub fn set_point_line_color(&mut self, color: &str) -> &mut Self
Sets the edge color of point markers
Sourcepub fn set_point_line_width(&mut self, width: f64) -> &mut Self
pub fn set_point_line_width(&mut self, width: f64) -> &mut Self
Sets the edge width of point markers
Sourcepub fn set_point_size(&mut self, size: f64) -> &mut Self
pub fn set_point_size(&mut self, size: f64) -> &mut Self
Sets the size of point markers
Sourcepub fn set_point_style(&mut self, style: &str) -> &mut Self
pub fn set_point_style(&mut self, style: &str) -> &mut Self
Sets the style of point markers
Examples:
- “
o”, “+” - As defined in https://matplotlib.org/stable/api/markers_api.html
Source§impl Surface
impl Surface
Sourcepub fn draw_cylinder(
&mut self,
a: &[f64],
b: &[f64],
radius: f64,
ndiv_axis: usize,
ndiv_perimeter: usize,
) -> Result<(), StrError>
pub fn draw_cylinder( &mut self, a: &[f64], b: &[f64], radius: f64, ndiv_axis: usize, ndiv_perimeter: usize, ) -> Result<(), StrError>
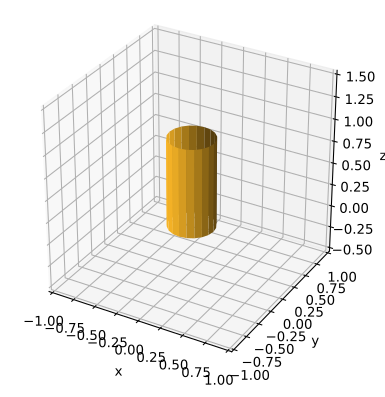
Draws a cylinder
§Input
a– first point on the cylinder (centered) axisb– second point on the cylinder (centered) axisradius– the cylinder’s radiusndiv_axis– number of divisions along the axis (≥ 1)ndiv_perimeter– number of divisions along the cross-sectional circle perimeter (≥ 3)
§Example
use plotpy::{Plot, StrError, Surface};
use std::path::Path;

fn main() -> Result<(), StrError> {
    // configure and draw surface
    let mut surface = Surface::new();
    let a = &[0.0, 0.0, 0.0];
    let b = &[0.0, 0.0, 1.0];
    surface.set_surf_color("#fcb827")
           .draw_cylinder(a, b, 0.25, 1, 20)?;

    // add surface to plot
    let mut plot = Plot::new();
    plot.add(&surface);

    // save figure
    plot.set_range_3d(-1.0, 1.0, -1.0, 1.0, 0.0, 1.0)
        .set_equal_axes(true)
        .save("/tmp/plotpy/doc_tests/doc_cylinder.svg")?;
    Ok(())
}
See also integration tests in the tests directory
Sourcepub fn draw_plane_nzz(
&mut self,
p: &[f64],
n: &[f64],
xmin: f64,
xmax: f64,
ymin: f64,
ymax: f64,
nx: usize,
ny: usize,
) -> Result<(Vec<Vec<f64>>, Vec<Vec<f64>>, Vec<Vec<f64>>), StrError>
pub fn draw_plane_nzz( &mut self, p: &[f64], n: &[f64], xmin: f64, xmax: f64, ymin: f64, ymax: f64, nx: usize, ny: usize, ) -> Result<(Vec<Vec<f64>>, Vec<Vec<f64>>, Vec<Vec<f64>>), StrError>
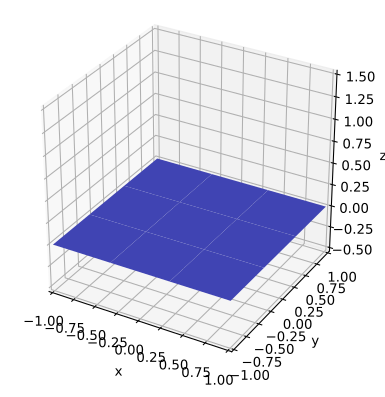
Draws a plane that has a normal vector with a non-zero z (nzz) component
The plane may be perpendicular to z if n = (0,0,1)
§Input
p– (len=3) point on planen– (len=3) normal vectorxminandxmax– limits along xyminandymax– limits along ynx– number of divisions along x (must be ≥ 2)ny– number of divisions along y (must be ≥ 2)
§Output
x,y,z– the coordinates of all points as in a meshgrid
§Example
use plotpy::{Plot, StrError, Surface};
use std::path::Path;

fn main() -> Result<(), StrError> {
    // configure and draw surface
    let mut surface = Surface::new();
    let p = &[0.0, 0.0, 0.0];
    let n = &[0.0, 0.0, 1.0];
    surface.set_surf_color("#5359e9")
           .draw_plane_nzz(p, n, -1.0, 1.0, -1.0, 1.0, 3, 3)?;

    // add surface to plot
    let mut plot = Plot::new();
    plot.add(&surface);

    // save figure
    plot.set_range_3d(-1.0, 1.0, -1.0, 1.0, 0.0, 1.0)
        .set_equal_axes(true)
        .save("/tmp/plotpy/doc_tests/doc_plane_nzz.svg")?;
    Ok(())
}
See also integration test in the tests directory.
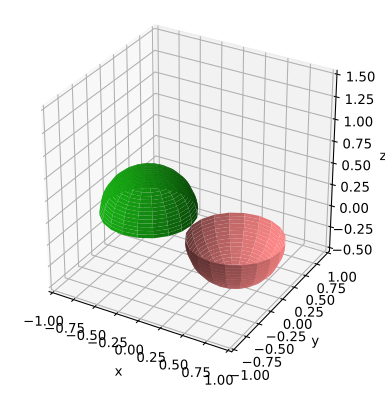
Sourcepub fn draw_hemisphere(
&mut self,
c: &[f64],
r: f64,
alpha_min: f64,
alpha_max: f64,
n_alpha: usize,
n_theta: usize,
cup: bool,
) -> Result<(Vec<Vec<f64>>, Vec<Vec<f64>>, Vec<Vec<f64>>), StrError>
pub fn draw_hemisphere( &mut self, c: &[f64], r: f64, alpha_min: f64, alpha_max: f64, n_alpha: usize, n_theta: usize, cup: bool, ) -> Result<(Vec<Vec<f64>>, Vec<Vec<f64>>, Vec<Vec<f64>>), StrError>
Draws a hemisphere
§Input
c– (len=3) center coordinatesr– radiusalpha_min– min α angle in [-180, 180) degreesalpha_max– max α angle in (-180, 180] degreesn_alpha– number of divisions along α (must be ≥ 2)n_theta– number of divisions along θ (must be ≥ 2)cup– upside-down; like a cup
§Output
x,y,z– the coordinates of all points as in a meshgrid
§Example
use plotpy::{Plot, StrError, Surface};
use std::path::Path;

fn main() -> Result<(), StrError> {
    // draw hat
    let mut hat = Surface::new();
    let c = &[-0.5, 0.0, 0.0];
    hat.set_surf_color("#17af14")
       .draw_hemisphere(c, 0.5, -180.0, 180.0, 20, 20, false)?;

    // draw cup
    let mut cup = Surface::new();
    let c = &[0.5, 0.0, 0.0];
    cup.set_surf_color("#ff8787")
       .draw_hemisphere(c, 0.5, -180.0, 180.0, 20, 20, true)?;

    // add surfaces to plot
    let mut plot = Plot::new();
    plot.add(&hat).add(&cup);

    // save figure
    plot.set_range_3d(-1.0, 1.0, -1.0, 1.0, 0.0, 1.0)
        .set_equal_axes(true)
        .save("/tmp/plotpy/doc_tests/doc_hemisphere.svg")?;
    Ok(())
}
See also integration test in the tests directory.
Sourcepub fn draw_superquadric(
&mut self,
c: &[f64],
r: &[f64],
k: &[f64],
alpha_min: f64,
alpha_max: f64,
theta_min: f64,
theta_max: f64,
n_alpha: usize,
n_theta: usize,
) -> Result<(Vec<Vec<f64>>, Vec<Vec<f64>>, Vec<Vec<f64>>), StrError>
pub fn draw_superquadric( &mut self, c: &[f64], r: &[f64], k: &[f64], alpha_min: f64, alpha_max: f64, theta_min: f64, theta_max: f64, n_alpha: usize, n_theta: usize, ) -> Result<(Vec<Vec<f64>>, Vec<Vec<f64>>, Vec<Vec<f64>>), StrError>
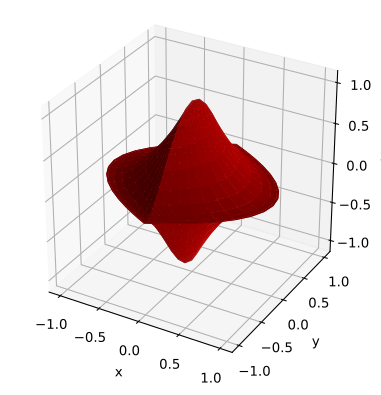
Draws a superquadric (includes sphere, super-ellipsoid, and super-hyperboloid)
§Input
c– (len=3) center coordinatesr– (len=3) radiik– (len=3) exponents (must all be ≥ 0)alpha_min– min α angle in [-180, 180) degreesalpha_max– max α angle in (-180, 180] degreestheta_min– min θ angle in [-90, 90) degreestheta_max– max θ angle in (-90, 90] degreesn_alpha– number of divisions along α (must be ≥ 2)n_theta– number of divisions along θ (must be ≥ 2)
§Output
x,y,z– the coordinates of all points as in a meshgrid
Reference: https://en.wikipedia.org/wiki/Superquadrics
§Example
use plotpy::{Plot, StrError, Surface};
use std::path::Path;

fn main() -> Result<(), StrError> {
    // configure and draw surface
    let c = &[0.0, 0.0, 0.0];
    let r = &[1.0, 1.0, 1.0];
    let k = &[1.0, 2.0, 0.5];
    let mut surface = Surface::new();
    surface.set_surf_color("#cd0000")
        .draw_superquadric(c, r, k, -180.0, 180.0, -90.0, 90.0, 40, 20)?;

    // add surface to plot
    let mut plot = Plot::new();
    plot.add(&surface);

    // save figure
    plot.set_equal_axes(true)
        .save("/tmp/plotpy/doc_tests/doc_superquadric.svg")?;
    Ok(())
}
See also integration test in the tests directory.
Sourcepub fn draw_sphere(
&mut self,
c: &[f64],
r: f64,
n_alpha: usize,
n_theta: usize,
) -> Result<(Vec<Vec<f64>>, Vec<Vec<f64>>, Vec<Vec<f64>>), StrError>
pub fn draw_sphere( &mut self, c: &[f64], r: f64, n_alpha: usize, n_theta: usize, ) -> Result<(Vec<Vec<f64>>, Vec<Vec<f64>>, Vec<Vec<f64>>), StrError>
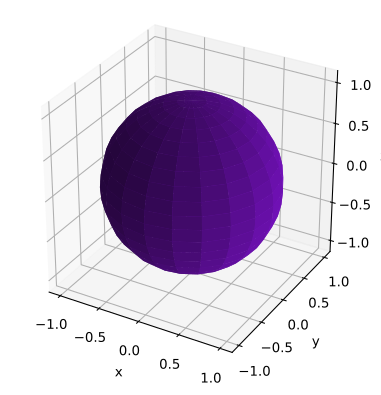
Draws a sphere
§Input
c– (len=3) center coordinatesr– radiusn_alpha– number of divisions along α (must be ≥ 2)n_theta– number of divisions along θ (must be ≥ 2)
§Output
x,y,z– the coordinates of all points as in a meshgrid
§Example
use plotpy::{Plot, StrError, Surface};
use std::path::Path;

fn main() -> Result<(), StrError> {
    // configure and draw surface
    let mut surface = Surface::new();
    let c = &[0.0, 0.0, 0.0];
    surface.set_surf_color("#7812c3")
           .draw_sphere(c, 1.0, 20, 20)?;

    // add surface to plot
    let mut plot = Plot::new();
    plot.add(&surface);

    // save figure
    plot.set_equal_axes(true)
        .save("/tmp/plotpy/doc_tests/doc_sphere.svg")?;
    Ok(())
}
See also integration test in the tests directory.
Examples found in repository?
3fn main() -> Result<(), StrError> {
4    let mut surf = Surface::new();
5    surf.set_surf_color("#ff880090") // Orange with some transparency
6        .set_with_wireframe(true)
7        .set_wire_line_color("black")
8        .draw_sphere(&[0.0, 0.0, 0.0], 1.0, 30, 30)?;
9
10    let mut plot = Plot::new();
11    plot.add(&surf)
12        .set_equal_axes(true) // Forces 1:1:1 aspect ratio so it's a perfect sphere
13        .set_zoom_3d(1.5) // Zooms in optically
14        .set_figure_size_points(800.0, 800.0)
15        .save("/tmp/plotpy/sphere_zoomed.png")?;
16
17    println!("Saved /tmp/plotpy/sphere_zoomed.png");
18
19    Ok(())
20}