pub struct Chart { /* private fields */ }Expand description
The Chart struct contains the configuration for displaying some data.
By default, a chart has a radius of 9, an aspect ratio of 2 and doesn’t show its legend.
§Example usage:
use piechart::{Chart, Color, Data};
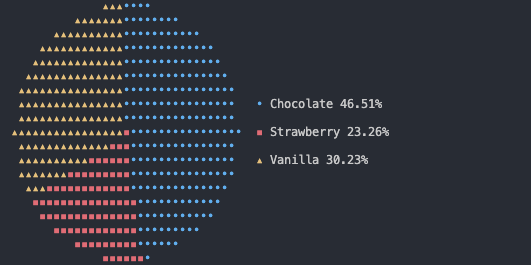
let data = vec![
Data { label: "Chocolate".into(), value: 4.0, color: Some(Color::Blue.into()), fill: '•' },
Data { label: "Strawberry".into(), value: 2.0, color: Some(Color::Red.into()), fill: '▪' },
Data { label: "Vanilla".into(), value: 2.6, color: Some(Color::Yellow.into()), fill: '▴' },
];
Chart::new()
.radius(9)
.aspect_ratio(3)
.legend(true)
.draw(&data);will result in
Implementations§
Source§impl Chart
impl Chart
Sourcepub fn new() -> Self
pub fn new() -> Self
Contructs a new chart initialized with its default values
Examples found in repository?
More examples
3fn main() {
4    #[rustfmt::skip]
5    let data = vec![
6        Data { label: "Chocolate".into(), value: 4.0, color: Some(Color::Blue.into()), fill: '•' },
7        Data { label: "Strawberry".into(), value: 2.0, color: Some(Color::Red.into()), fill: '▪' },
8        Data { label: "Vanilla".into(), value: 2.6, color: Some(Color::Yellow.into()), fill: '▴' },
9    ];
10
11    Chart::new()
12        .radius(9)
13        .aspect_ratio(3)
14        .legend(true)
15        .draw(&data);
16}3fn main() {
4 #[rustfmt::skip]
5 let data = vec![
6 Data { label: "dd1".into(), value: 4.0, color: Some(Color::Red.into()), fill: '•' },
7 Data { label: "dd2".into(), value: 2.0, color: Some(Color::Green.into()), fill: '•' },
8 Data { label: "dd3".into(), value: 2.6, color: Some(Color::Blue.into()), fill: '•' },
9 ];
10
11 let mut chart = Chart::new();
12
13 for a in 0..=12 {
14 chart.radius(a);
15 chart.draw(&data);
16 println!();
17 }
18}Sourcepub fn radius(&mut self, radius: u16) -> &mut Self
pub fn radius(&mut self, radius: u16) -> &mut Self
Sets the radius of the pie chart. To choose which size fits the best, you can run a code snippet like this:
let mut chart = Chart::new();
for radius in 0..=12 {
chart.radius(radius);
chart.draw(&data);
}Examples found in repository?
3fn main() {
4 #[rustfmt::skip]
5 let data = vec![
6 Data { label: "Chocolate".into(), value: 4.0, color: Some(Color::Blue.into()), fill: '•' },
7 Data { label: "Strawberry".into(), value: 2.0, color: Some(Color::Red.into()), fill: '▪' },
8 Data { label: "Vanilla".into(), value: 2.6, color: Some(Color::Yellow.into()), fill: '▴' },
9 ];
10
11 Chart::new()
12 .radius(9)
13 .aspect_ratio(3)
14 .legend(true)
15 .draw(&data);
16}More examples
3fn main() {
4    #[rustfmt::skip]
5    let data = vec![
6        Data { label: "dd1".into(), value: 4.0, color: Some(Color::Red.into()), fill: '•' },
7        Data { label: "dd2".into(), value: 2.0, color: Some(Color::Green.into()), fill: '•' },
8        Data { label: "dd3".into(), value: 2.6, color: Some(Color::Blue.into()), fill: '•' },
9    ];
10
11    let mut chart = Chart::new();
12
13    for a in 0..=12 {
14        chart.radius(a);
15        chart.draw(&data);
16        println!();
17    }
18}Sourcepub fn aspect_ratio(&mut self, aspect_ratio: u16) -> &mut Self
pub fn aspect_ratio(&mut self, aspect_ratio: u16) -> &mut Self
The aspect ratio controls how stretched or squished the circle is. Since terminal columns are more tall than wide a ration of 2 or 3 is the best in most cases.
Examples found in repository?
3fn main() {
4    #[rustfmt::skip]
5    let data = vec![
6        Data { label: "Chocolate".into(), value: 4.0, color: Some(Color::Blue.into()), fill: '•' },
7        Data { label: "Strawberry".into(), value: 2.0, color: Some(Color::Red.into()), fill: '▪' },
8        Data { label: "Vanilla".into(), value: 2.6, color: Some(Color::Yellow.into()), fill: '▴' },
9    ];
10
11    Chart::new()
12        .radius(9)
13        .aspect_ratio(3)
14        .legend(true)
15        .draw(&data);
16}Sourcepub fn legend(&mut self, legend: bool) -> &mut Self
pub fn legend(&mut self, legend: bool) -> &mut Self
Specifies whether the chart should render a legend with the labels and their percentages.
Examples found in repository?
3fn main() {
4    #[rustfmt::skip]
5    let data = vec![
6        Data { label: "Chocolate".into(), value: 4.0, color: Some(Color::Blue.into()), fill: '•' },
7        Data { label: "Strawberry".into(), value: 2.0, color: Some(Color::Red.into()), fill: '▪' },
8        Data { label: "Vanilla".into(), value: 2.6, color: Some(Color::Yellow.into()), fill: '▴' },
9    ];
10
11    Chart::new()
12        .radius(9)
13        .aspect_ratio(3)
14        .legend(true)
15        .draw(&data);
16}Source§impl Chart
impl Chart
Sourcepub fn draw(&self, data: &[Data])
pub fn draw(&self, data: &[Data])
Renders the chart and outputs it onto stdout.
The method panics in case of an error. If you want more fine-grained control about error recovery
and how the buffer the chart is rendered into the buffer, use Chart::draw_into.
Examples found in repository?
More examples
3fn main() {
4    #[rustfmt::skip]
5    let data = vec![
6        Data { label: "Chocolate".into(), value: 4.0, color: Some(Color::Blue.into()), fill: '•' },
7        Data { label: "Strawberry".into(), value: 2.0, color: Some(Color::Red.into()), fill: '▪' },
8        Data { label: "Vanilla".into(), value: 2.6, color: Some(Color::Yellow.into()), fill: '▴' },
9    ];
10
11    Chart::new()
12        .radius(9)
13        .aspect_ratio(3)
14        .legend(true)
15        .draw(&data);
16}3fn main() {
4 #[rustfmt::skip]
5 let data = vec![
6 Data { label: "dd1".into(), value: 4.0, color: Some(Color::Red.into()), fill: '•' },
7 Data { label: "dd2".into(), value: 2.0, color: Some(Color::Green.into()), fill: '•' },
8 Data { label: "dd3".into(), value: 2.6, color: Some(Color::Blue.into()), fill: '•' },
9 ];
10
11 let mut chart = Chart::new();
12
13 for a in 0..=12 {
14 chart.radius(a);
15 chart.draw(&data);
16 println!();
17 }
18}