# xct2cli
Library and CLI for transforming Xcode Instruments `.trace` bundles
into output that's useful to humans **and** LLMs. Apple Silicon only.
The crate is library-forward: `xct2cli` (the binary) is a thin `clap`
shell over `xct2cli` (the lib). Other tools can depend on the lib with
`default-features = false` to skip the CLI deps.
**NOTE:** This is kind of some LLM bullshit. I kept having Claude Code
use Instruments to profile code and it would always create a Python
script to interpret the results. This project is my attempt to kill the
Python script it would always generate, and get richer info at the same
time.
## Requirements
- macOS with Xcode (`/usr/bin/xctrace` ships with it).
- Apple Silicon for the disassembler (we use `capstone` in arm64 mode).
- Optional: `cargo-instruments` for recording from Cargo projects.
## Commands
```
xct2cli toc <trace> # what's in the bundle
xct2cli hotspots <trace> [--binary BIN] [--dsym DSYM] [--filter SUBSTR]
xct2cli slide <trace> [--binary BIN] [--dsym DSYM]
xct2cli annotate <trace> --function NAME [--mode interleaved] [--event NAME | --metric N]
xct2cli callgraph <trace> [--function NAME] [--top 10]
xct2cli counters <trace> [--sort-by N]
xct2cli events <trace> # list metric / pmi-event names
xct2cli record -t TEMPLATE -o OUT.trace [-f] -- ./bin args
```
Global flags: `--color {auto,always,never}` (auto-detect TTY + honor
`NO_COLOR`), `--verbose`, `--json` on every command for
machine-readable output. ASLR slide is recovered automatically from
the trace's kdebug image-load events whenever `--binary` is provided;
`xct2cli slide` is the escape hatch when that fails. `<binary>.dSYM`
next to the binary is picked up automatically - pass `--dsym` only for
non-standard layouts.
## Time profile (Time Profiler trace)
### Record and inspect the bundle
```sh
xct2cli record -f -t "Time Profiler" -o /tmp/run.trace -- \
target/release/examples/profile_compress
xct2cli toc /tmp/run.trace
```
`-f`/`--force` removes an existing bundle at `--output` first; `xctrace`
itself errors if the bundle already exists.
```
run #1
template: Time Profiler
duration: 1.354983s
device: caladan (MacBook Pro, 26.4 (25E246))
process: profile_compress (pid 85408)
processes:
pid 0 kernel /System/Library/Kernels/kernel.release.t8142
pid 85408 profile_compress /Users/lander/dev/acceleration/target/release/examples/profile_compress
tables (40):
tick
time-sample
time-profile
kdebug
...
```
### Hotspots: per-CPU summary + top PCs
```sh
xct2cli hotspots /tmp/run.trace
```
```
samples: 500
per CPU:
CPU 0 CPU 0 (E Core) 1 samples
CPU 6 CPU 6 (S Core) 152 samples
CPU 7 CPU 7 (S Core) 118 samples
CPU 8 CPU 8 (S Core) 111 samples
CPU 9 CPU 9 (S Core) 118 samples
timeline (10ms buckets, 51 buckets):
ms_off cpu0 cpu6 cpu7 cpu8 cpu9
0 0 2 1 3 2
40 0 6 0 4 0
70 0 9 0 0 1
130 0 8 2 0 0
...
top 25 PCs:
94 0x0000000100ac249c lzxc::match_finder::MatchFinder::process match_finder.rs:202
68 0x0000000100ac237c lzxc::match_finder::MatchFinder::process match_finder.rs:182
38 0x0000000100ac2460 lzxc::match_finder::MatchFinder::process match_finder.rs
31 0x0000000100ac236c lzxc::match_finder::MatchFinder::process match_finder.rs:182
...
```
### Filter out stdlib / system noise
`--filter SUBSTR` keeps only PCs whose resolved function name contains
`SUBSTR` (case-insensitive), applied after symbolication and before
`--top` truncation:
```sh
xct2cli hotspots /tmp/run.trace --filter lzxc:: --top 5
```
### Callgraph: flamegraph-style top-down view
Inclusive samples (function appears anywhere in the stack - bar width
in a flamegraph):
```sh
xct2cli callgraph /tmp/run.trace
```
```
top functions (inclusive) (499 samples)
497 99.6% _main
497 99.6% std::rt::lang_start::{{closure}}
497 99.6% std::sys::backtrace::__rust_begin_short_backtrace
497 99.6% profile_compress::main
495 99.2% lzxc::Encoder::encode_chunk
359 71.9% lzxc::match_finder::MatchFinder::process
128 25.7% lzxc::verbatim::emit_verbatim_block
9 1.8% lzxc::huffman::build_path_lengths
```
### Drill into a hot function's callees
```sh
xct2cli callgraph /tmp/run.trace --function encode_chunk
```
Shows what `encode_chunk` was calling at sample time (its stack-frame
children):
```
callees of encode_chunk (495 samples)
359 72.5% lzxc::match_finder::MatchFinder::process
128 25.9% lzxc::verbatim::emit_verbatim_block
3 0.6% 0x182ea9418
```
### Annotate: per-instruction view with source
`callgraph` works on stack-walked frames, so functions that were
inlined into their caller are *invisible* - kperf only saw one stack
frame for the whole inline chain. To see source-level inlined callees
of a function, use `annotate` instead:
```sh
xct2cli annotate /tmp/run.trace --function MatchFinder::process --mode interleaved
```
`--mode interleaved` groups consecutive instructions by their innermost
inlined source location, prints stats + function + source per group,
then the asm:
```
[931 samples / 3 insns] lzxc::match_finder::MatchFinder::find_best_match match_finder.rs:278 inlined into MatchFinder::process at match_finder.rs:182
let next_candidate_abs = prev[c_rel] as u64;
931 ########## 0x10250e378 ldr w15, [x22, x11, lsl #2]
```
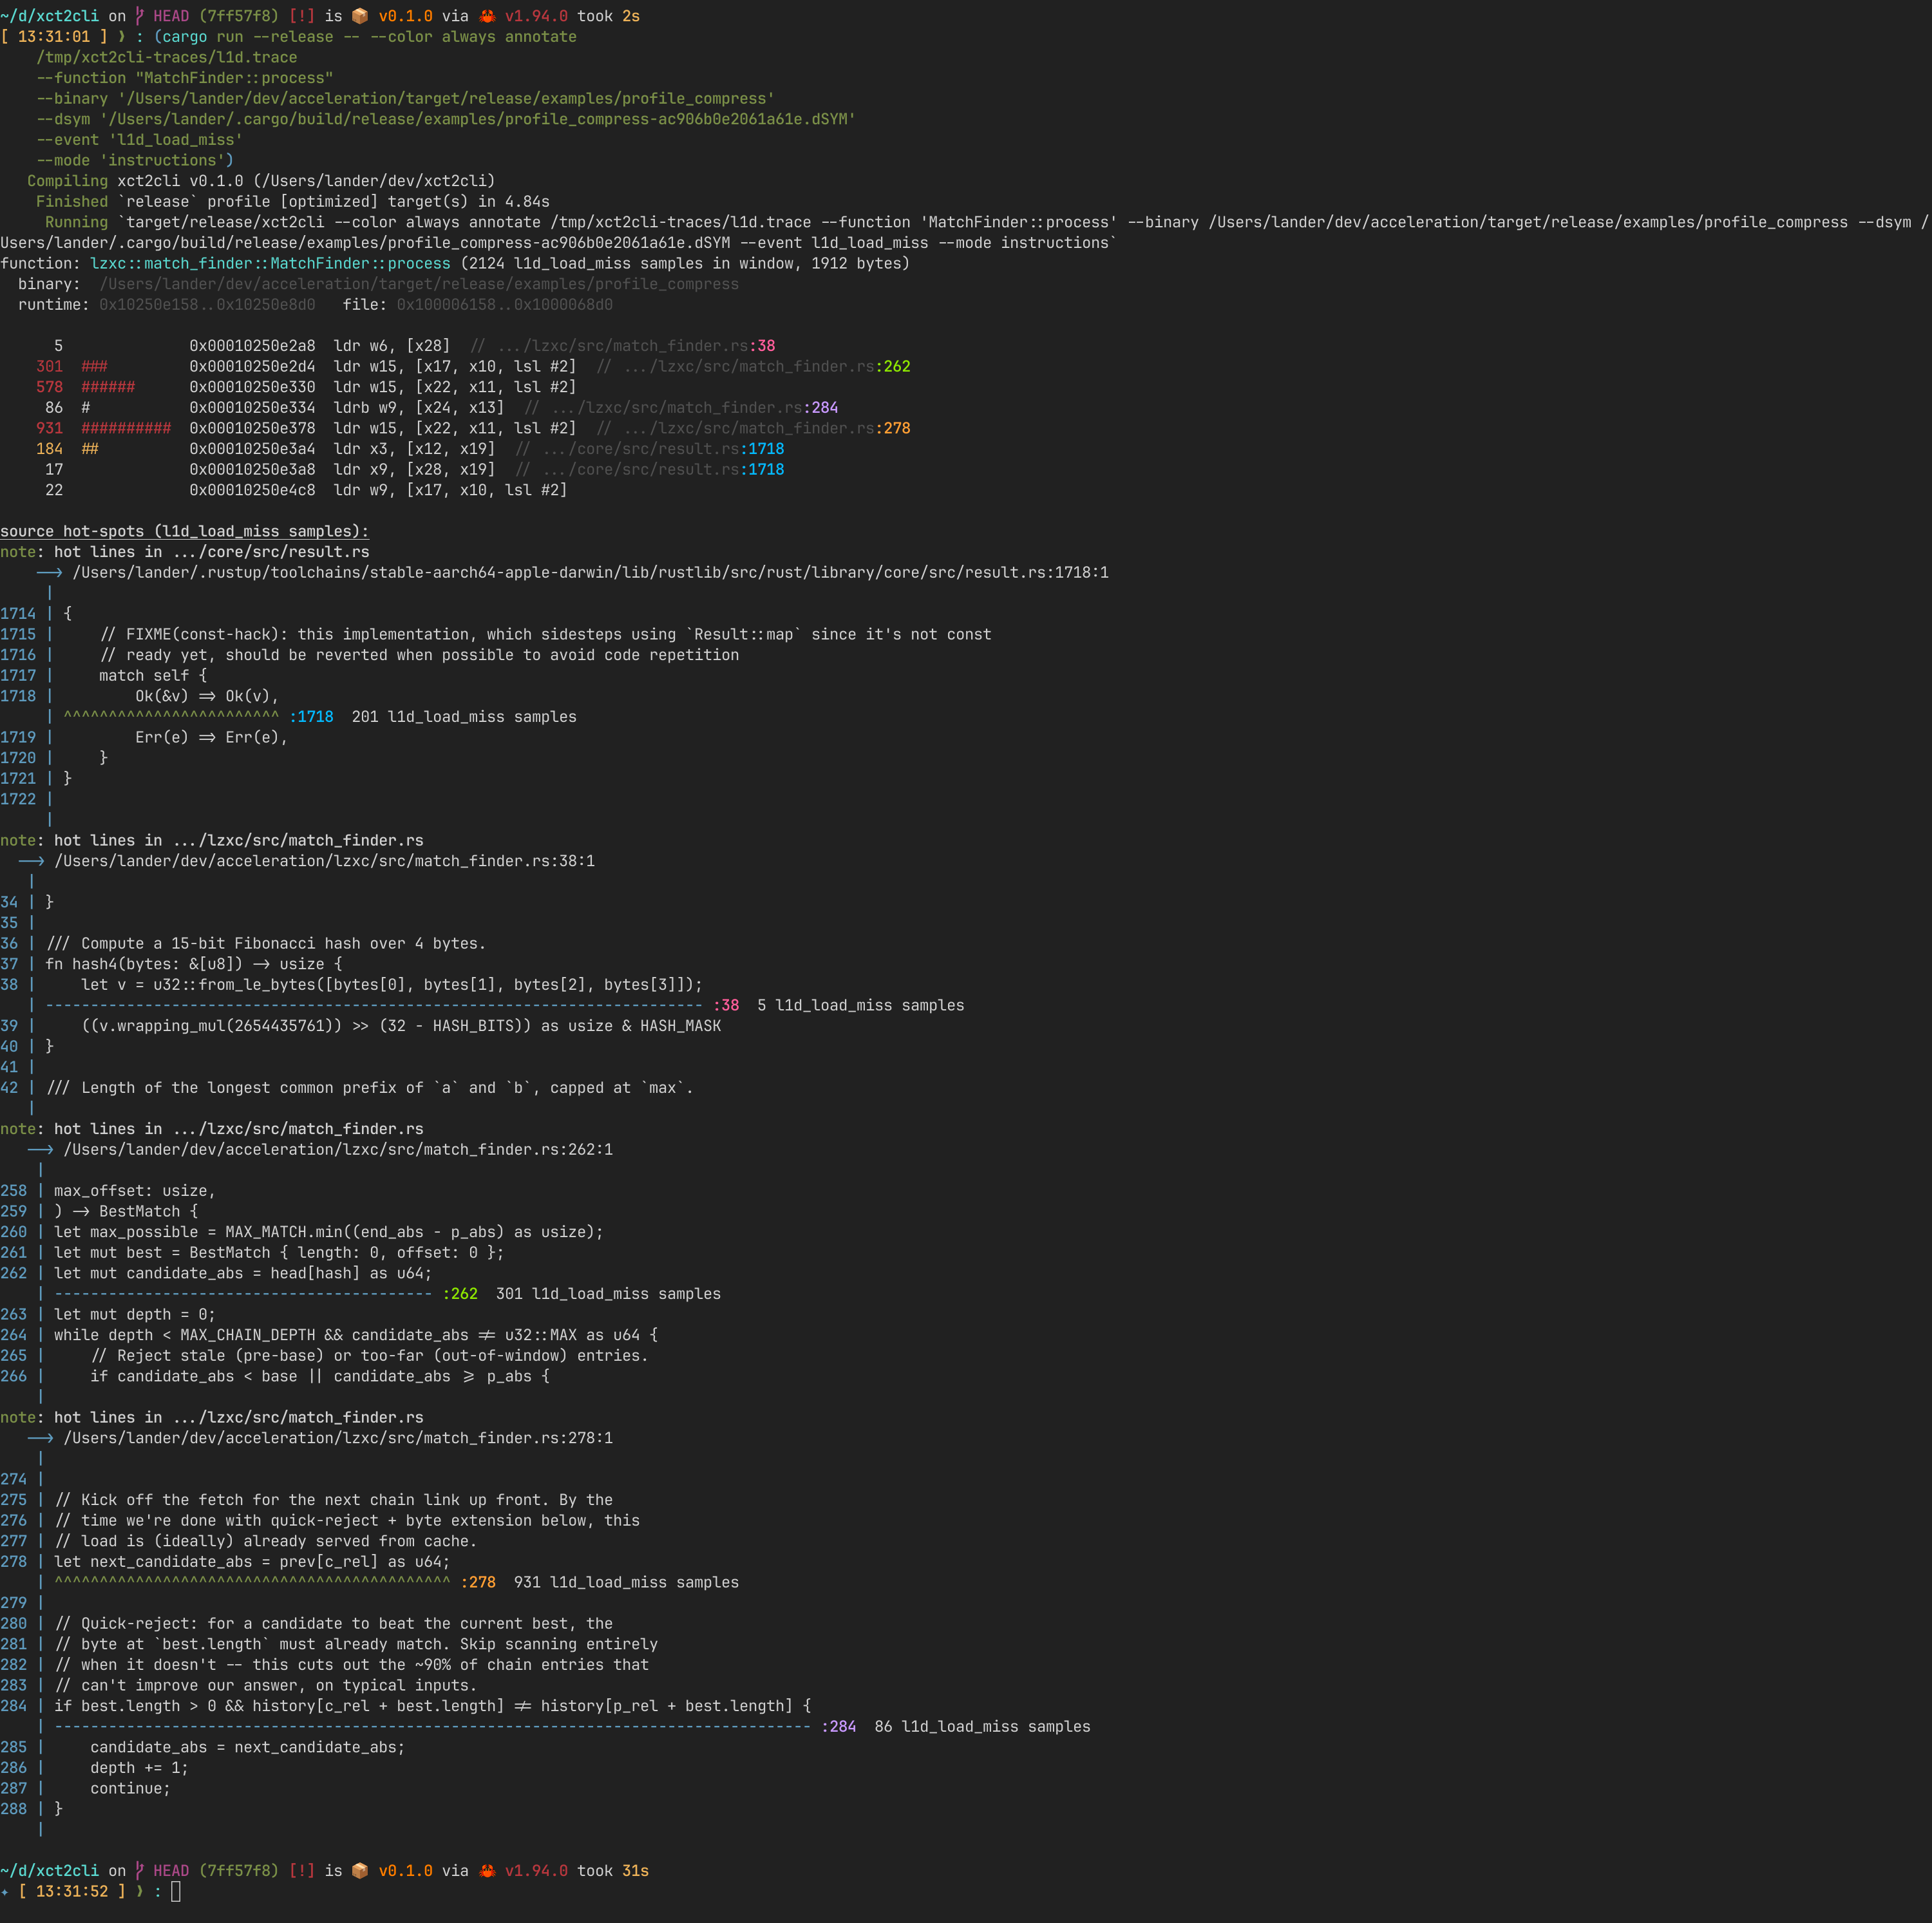
The default `--mode instructions` is asm-first: every sampled
instruction with its sample count + heat bar + source-line comment,
followed by an `annotate-snippets` block per source file showing the
hot lines in context (hot-line clusters more than `2 * --context` lines
apart split into separate snippets):
`--mode source` collapses to just the `annotate-snippets` source-line
callouts.
## Per-instruction cache miss attribution (CPU Counters trace)
### Picking a template
For literal cache miss attribution you need a `.tracetemplate`
configured for PMI-overflow sampling on a memory event. Two are
checked in under `templates/`:
- `templates/L1D_Miss.tracetemplate` - Apple's Guided "L1D Miss
Sampling" mode. Captures `l1d_load_miss`, `l1d_store_miss`,
`l1d_tlb_miss` events with full callstacks at the PMI overflow.
- `templates/l2_miss.tracetemplate` - Manual mode sampling
`PL2_CACHE_MISS_LD` (Apple Silicon's per-cluster L2). Manual mode
doesn't capture per-PMI callstacks, so PCs are recovered by joining
each PMI sample to the nearest `time-sample` row from the
co-recorded Time Profiler.
### Record and list available events
```sh
xct2cli record -t templates/L1D_Miss.tracetemplate -o /tmp/l1d.trace -- \
target/release/examples/profile_compress
xct2cli events /tmp/l1d.trace
```
```
metrics (use with `annotate --metric N` or `counters --sort-by N`):
[0] Cycles
[1] L1D Cache Load Misses
[2] L1D Cache Store Misses
[3] L1D TLB Misses
pmi events (use with `annotate --event NAME`):
l1d_load_miss 2473 61.2%
l1d_store_miss 1546 38.3%
l1d_tlb_miss 20 0.5%
```
### Attribute misses to specific source lines
```sh
xct2cli annotate /tmp/l1d.trace --function MatchFinder::process \
--event l1d_load_miss --mode interleaved
```
```
function: lzxc::match_finder::MatchFinder::process (2124 l1d_load_miss samples in window, 1912 bytes)
[301 l1d_load_miss samples / 3 insns] lzxc::match_finder::MatchFinder::find_best_match match_finder.rs:262 inlined into MatchFinder::process at match_finder.rs:182
let mut candidate_abs = head[hash] as u64;
301 ### 0x10250e2d4 ldr w15, [x17, x10, lsl #2]
[578 l1d_load_miss samples / 1 insns] (no source mapping) inlined into MatchFinder::process at match_finder.rs:182
578 ###### 0x10250e330 ldr w15, [x22, x11, lsl #2]
[931 l1d_load_miss samples / 3 insns] lzxc::match_finder::MatchFinder::find_best_match match_finder.rs:278 inlined into MatchFinder::process at match_finder.rs:182
let next_candidate_abs = prev[c_rel] as u64;
931 ########## 0x10250e378 ldr w15, [x22, x11, lsl #2]
```
In color:
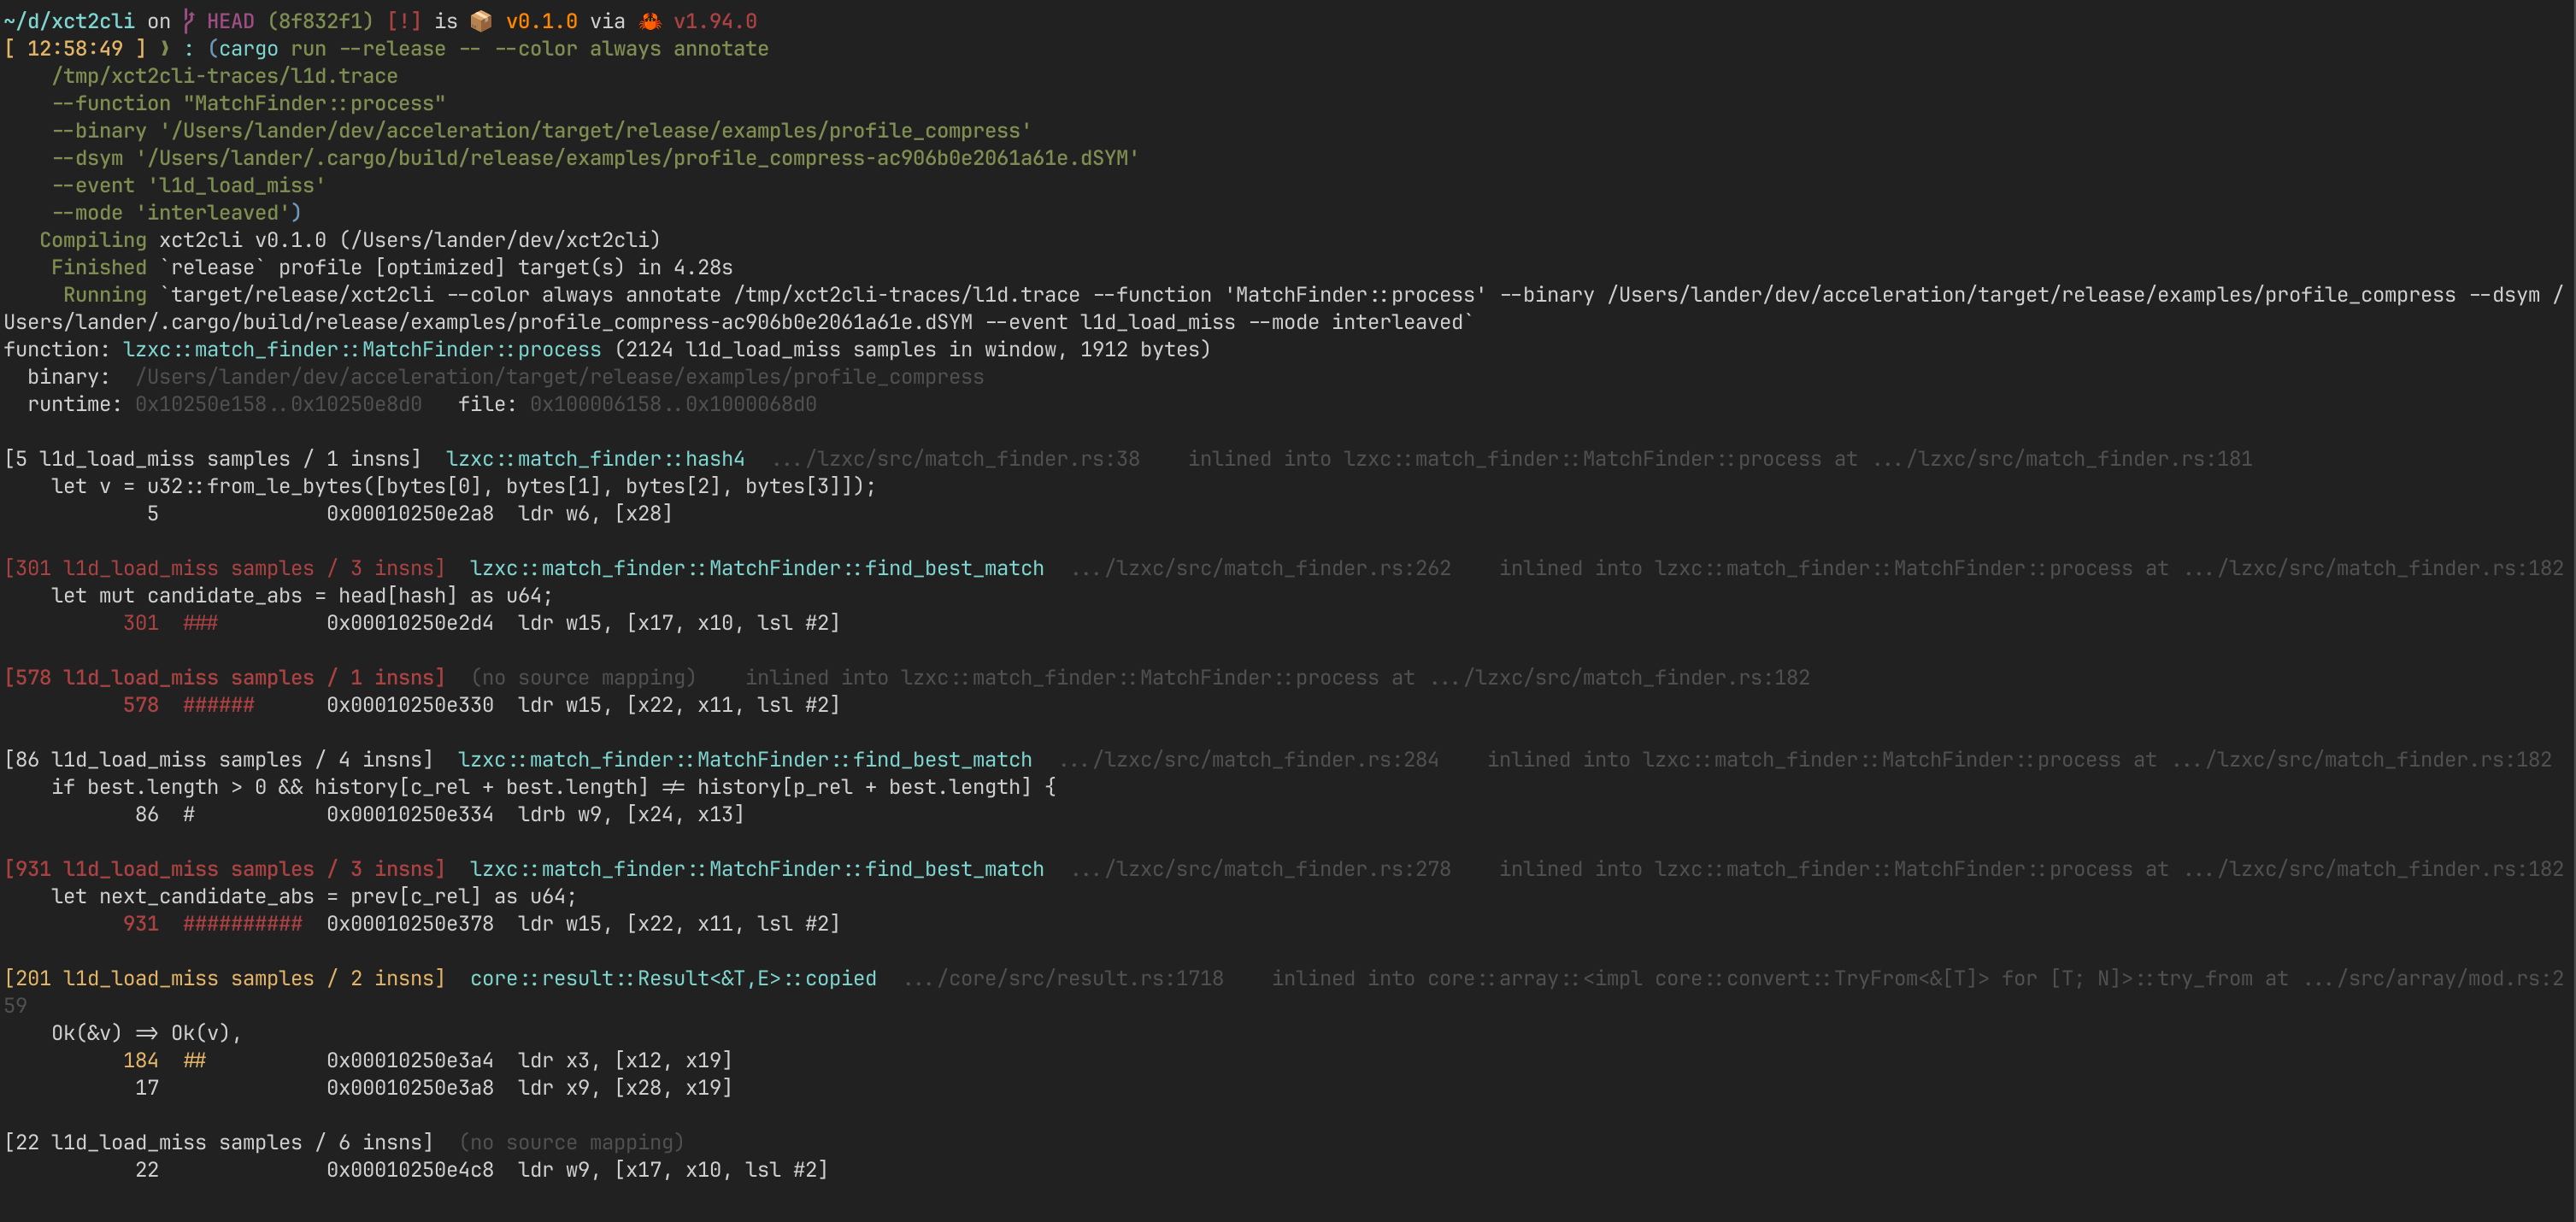
In this trace, 931 of 2124 L1D load misses (44%) come from a single
`prev[c_rel]` read in `find_best_match` at `match_finder.rs:278` - the
hash-chain walk that the compiler inlined into `MatchFinder::process`.
## Adding new templates
`xctrace`'s CLI doesn't expose CPU Counters' Mode dropdown, so any new
sampling mode (e.g. branch-mispredict, store-buffer-stall) needs a
`.tracetemplate` built once in Instruments.app:
1. New Document -> Blank -> add **CPU Counters** instrument.
2. Configuration **Manual**, Sample By **Events**, pick the Sampling
Event, set Sample Every (start at 1M; lower if samples are sparse).
3. Add a **Time Profiler** instrument with **High Frequency Sampling**
on so PMI samples can be joined to a PC.
4. File -> Save as Template -> put it in `templates/`.
`xct2cli events <trace>` will show whatever event name Apple wrote
into the trace; `--event NAME` works the same as for the bundled
templates.
## Library use
```rust
use xct2cli::trace::TraceBundle;
use xct2cli::analysis::HotspotsBuilder;
use xct2cli::render::Palette;
let bundle = TraceBundle::open("run.trace")?;
let report = HotspotsBuilder::new(&bundle)
.top(50)
.binary(Some("target/release/myapp".into()))
.run()?;
println!("{}", report.to_text(Palette::new(false)));
```
Most data-extraction helpers are inherent methods on `TraceBundle`:
`pc_samples`, `pmi_samples`, `pmi_event_names`, `metric_labels`,
`per_pc_pmi_count`, `per_pc_metric_deltas`, `image_loads`,
`counters_profile_event`. `BinaryInfo::open(path)` parses Mach-O and
exposes `slide_from(&loads)` for ASLR-slide detection.