import matplotlib.pyplot as plt

plt.plot([1000, 5000, 100000, 500000], [2.8, 3.48, 18.451, 71.49], color = "red")
plt.plot([1000, 5000, 100000, 500000], [4.02, 9.415, 137.980, 680.18], color = "blue")
plt.ylabel("Benchmarked time (ms)")
plt.xlabel("Number of iterations")
plt.title("Arc vs Trc performance (Ubuntu + x86_64)")
plt.legend(("Trc","Arc"), shadow=True, fancybox=True)
plt.savefig("ubuntu_x86_64.png")
plt.clf()

plt.plot([1000, 5000, 100000, 500000], [10.945, 12.3, 30.666, 88.387], color = "red")
plt.plot([1000, 5000, 100000, 500000], [13.854, 18.104, 126.330, 534.67], color = "blue")
plt.ylabel("Benchmarked time (ms)")
plt.xlabel("Number of iterations")
plt.title("Arc vs Trc performance (WSL2 + x86_64)")
plt.legend(("Trc","Arc"), shadow=True, fancybox=True)
plt.savefig("wsl2_x86_64.png")
plt.clf()

plt.plot([1000, 5000, 100000, 500000], [1.883, 2.424, 16.585, 71.543], color = "red")
plt.plot([1000, 5000, 100000, 500000], [2.913, 7.672, 119.950, 590.530], color = "blue")
plt.ylabel("Benchmarked time (ms)")
plt.xlabel("Number of iterations")
plt.title("Arc vs Trc performance (Debian + aarch64)")
plt.legend(("Trc","Arc"), shadow=True, fancybox=True)
plt.savefig("debian_aarch64.png")
plt.clf()

plt.plot([1000, 5000, 100000, 500000], [1.6875, 1.9675, 8.0951, 34.526], color = "red", label = "Trc")
plt.plot([1000, 5000, 100000, 500000], [2.6682, 6.4880, 97.976, 477.23], color = "blue", label = "Arc")
plt.ylabel("Benchmarked time (ms)")
plt.xlabel("Number of iterations")
plt.title("Arc vs Trc performance (M1 Apple Darwin + aarch64)")
plt.legend(shadow=True, fancybox=True)
plt.savefig("apple_darwin_aarch64.png")
plt.clf()


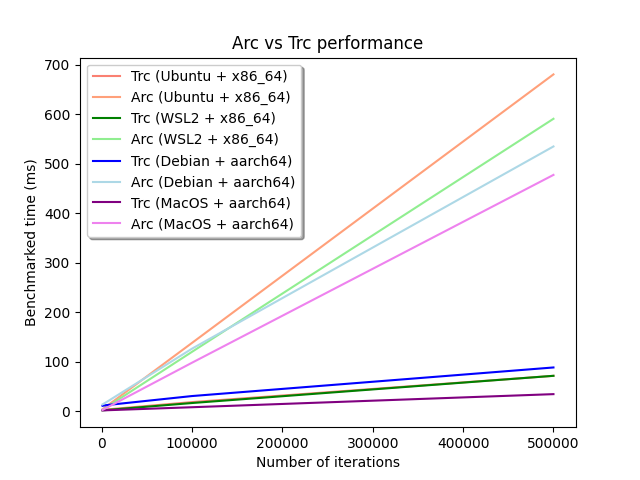
plt.plot([1000, 5000, 100000, 500000], [2.8, 3.48, 18.451, 71.49], color = "salmon", label = "Trc (Ubuntu + x86_64)")
plt.plot([1000, 5000, 100000, 500000], [4.02, 9.415, 137.980, 680.18], color = "lightsalmon", label = "Arc (Ubuntu + x86_64)")
plt.plot([1000, 5000, 100000, 500000], [1.883, 2.424, 16.585, 71.543], color = "green", label = "Trc (WSL2 + x86_64)")
plt.plot([1000, 5000, 100000, 500000], [2.913, 7.672, 119.950, 590.530], color = "lightgreen", label = "Arc (WSL2 + x86_64)")
plt.plot([1000, 5000, 100000, 500000], [10.945, 12.3, 30.666, 88.387], color = "blue", label = "Trc (Debian + aarch64)")
plt.plot([1000, 5000, 100000, 500000], [13.854, 18.104, 126.330, 534.67], color = "lightblue", label = "Arc (Debian + aarch64)")
plt.plot([1000, 5000, 100000, 500000], [1.6875, 1.9675, 8.0951, 34.526], color = "purple", label = "Trc (MacOS + aarch64)")
plt.plot([1000, 5000, 100000, 500000], [2.6682, 6.4880, 97.976, 477.23], color = "violet", label = "Arc (MacOS + aarch64)")

plt.ylabel("Benchmarked time (ms)")
plt.xlabel("Number of iterations")
plt.title("Arc vs Trc performance")
plt.legend(shadow=True, fancybox=True)
plt.savefig("performance.png")
plt.clf()