## toprs
Cross platform alternative top with a focus on analysing memory usage.
In addition to each process having only their memory usage, it also has the sum of all child process memory usage.
## running
Install via
`$ cargo install toprs`
Run `toprs` for console or `toprs -g` for gui
If you want to always run as Gui mode, add the following to your config file located
- `~/.config/toprs/config.toml`
- `c:\Users\Name\.config\toprs\config.toml`
- `/etc/toprs/config.toml`
```toml
mode="Gui"
```
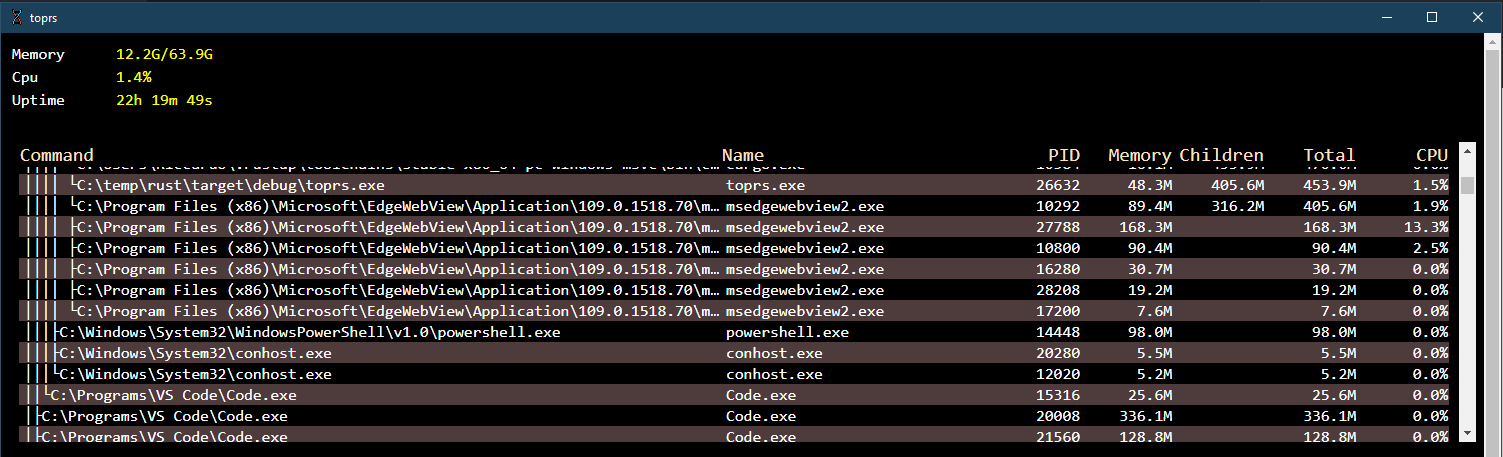
Gui mode
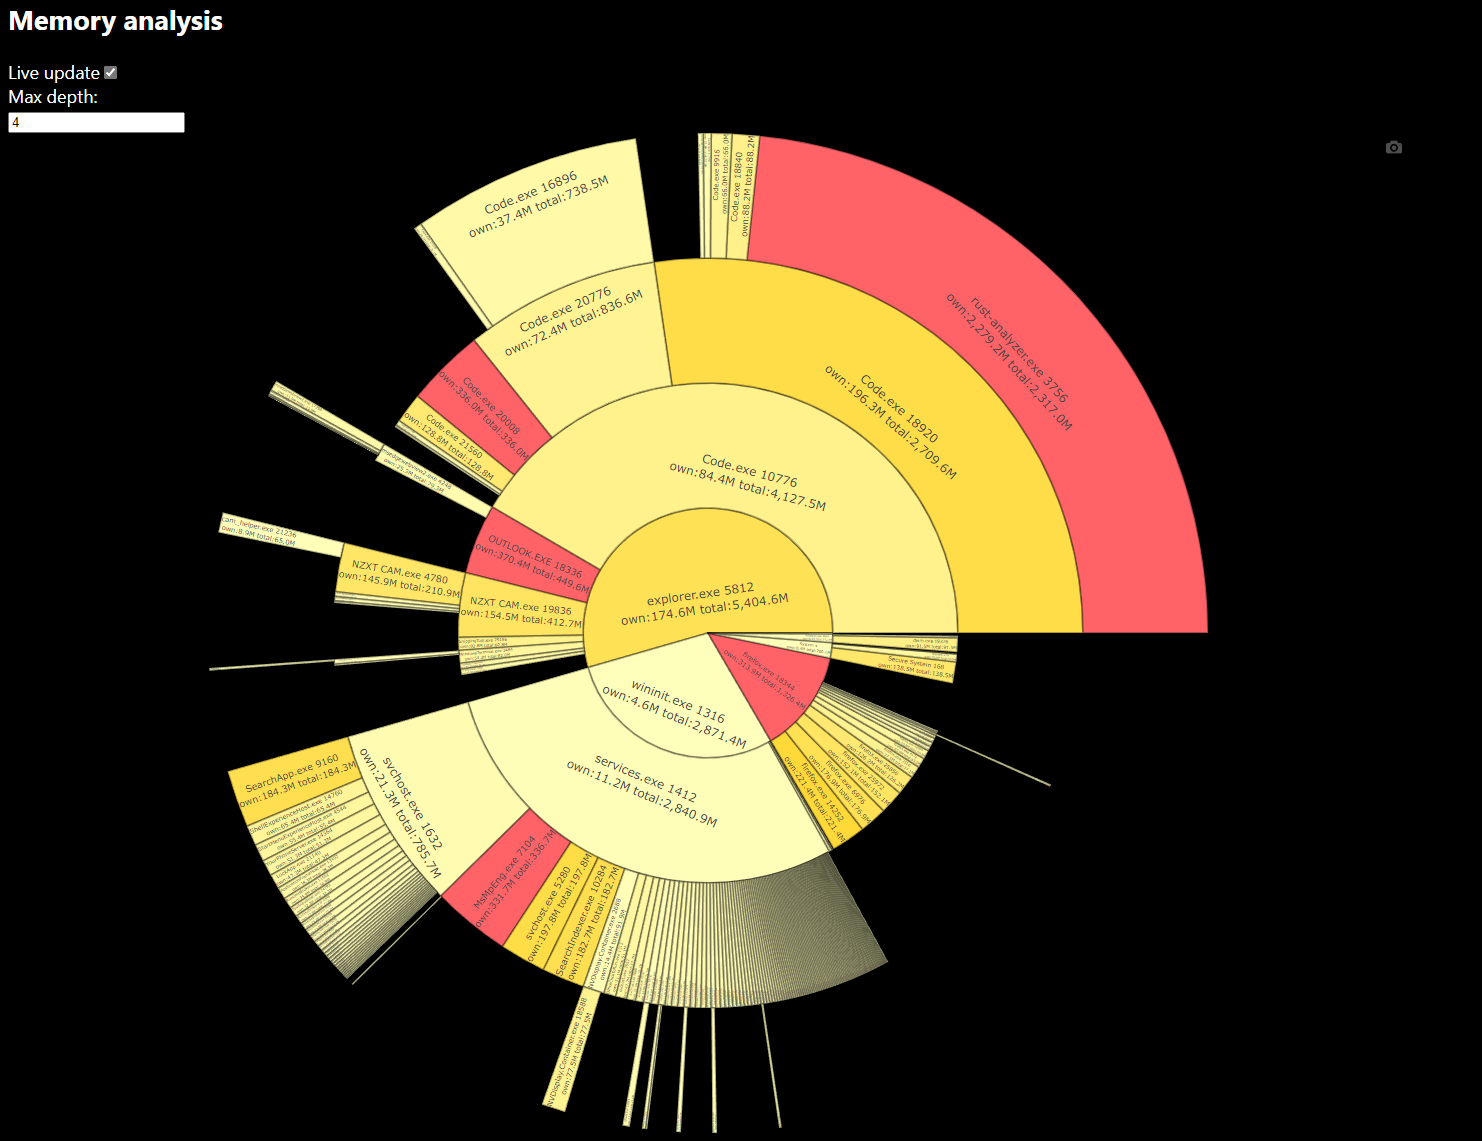
Memory analysis
SVG
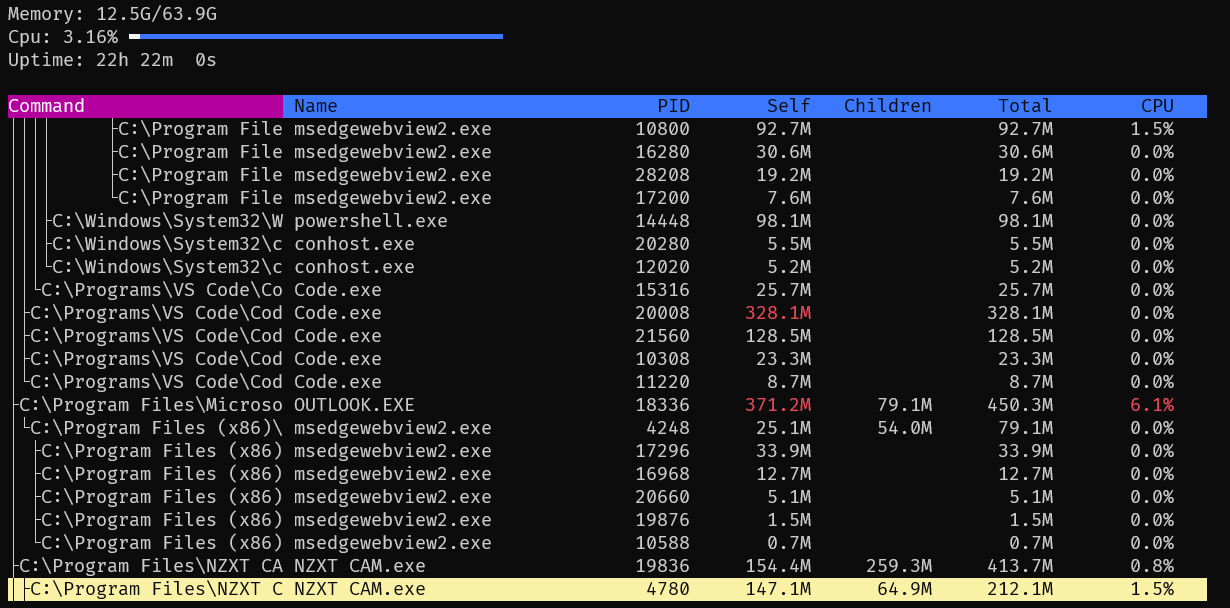
Tui mode
### Operating modes
Run toprs with the following flags
- Console (TUI) mode [-t]
- GUI mode [-g]
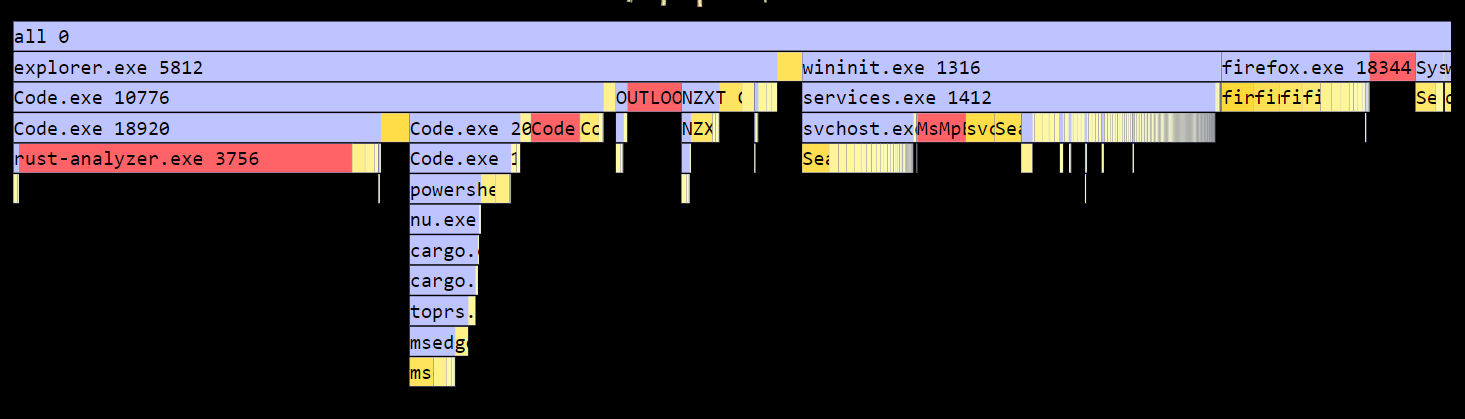
- Output flamegraph to SVG [-s <filename>]
- Output memory usage to terminal [-o]
### Gui
Processes are listed like in TUI mode, but there is also a memory analysis section which analyses the memory usage in two modes: Sunburst and Flamegraph.
Sunburst mode allows you to click on a process to drill down. You can increase or decrease the max depth to your preference.
Both Sunburst and Flamegraph indicate top 5 (own memory) processes in Red, and the rest in fading yellow, depending on amount.
Flamegraph blue portion is child memory, and red/yellow is its own memory
### Tested on
- [X] Linux
- [X] Windows 10
- [X] MacOS
### FAQ
- What memory is it using?
- In windows this is the "working set"
- In Linux this is the "resident" memory i.e. used physical memory
### Thanks
Shoutout to the following projects that made this possible:
- rust Sysinfo lib
- GUI mode uses Dioxus to manage window and contents
- TUI mode uses tuirs
- Plotly for chart