# thag_profiler
An accurate lightweight cross-platform profiling library for Rust applications, offering time and/or memory profiling with minimal boilerplate and your choice of color schemes.
An independent offshoot of the `thag(_rs)` script runner and REPL.
Why choose `thag_profiler`?:
- quick and easy to set up and run
- clear and accurate interactive flamegraphs
- time and memory profiling
- detailed profiling option for memory hotspots
- any mix of synchronous and asynchronous code
- pure Rust with no platform dependencies
---
[](https://durbanlegend.github.io/thag_rs/thag_profiler/assets/flamechart_rust_time.svg)<br>
*Time profile in `inferno` "Rust" color scheme. Click on image for interactive version with clickable bars and search.*
---
Instrumentation:
- `#[enable_profiling]` attribute for your lowest-level profiled function, typically `main`
- `#[profiled]` attribute for other functions
- `profile!` ... `end!` macro pairs for code sections.
Each of these items offers a range of options for any combination of time, memory summary and memory detail profiling.
Instrumentation tools:
- `thag_instrument` command to add the attributes to every function and method of a .rs file
- `thag_uninstrument` command to remove them.
Output analysis:
- `thag_profile` to select, filter and display:
- interactive flamegraphs, flamecharts, comparisons
- function statistics for time profiles
- allocation statistics and size distribution for memory profiles
---
[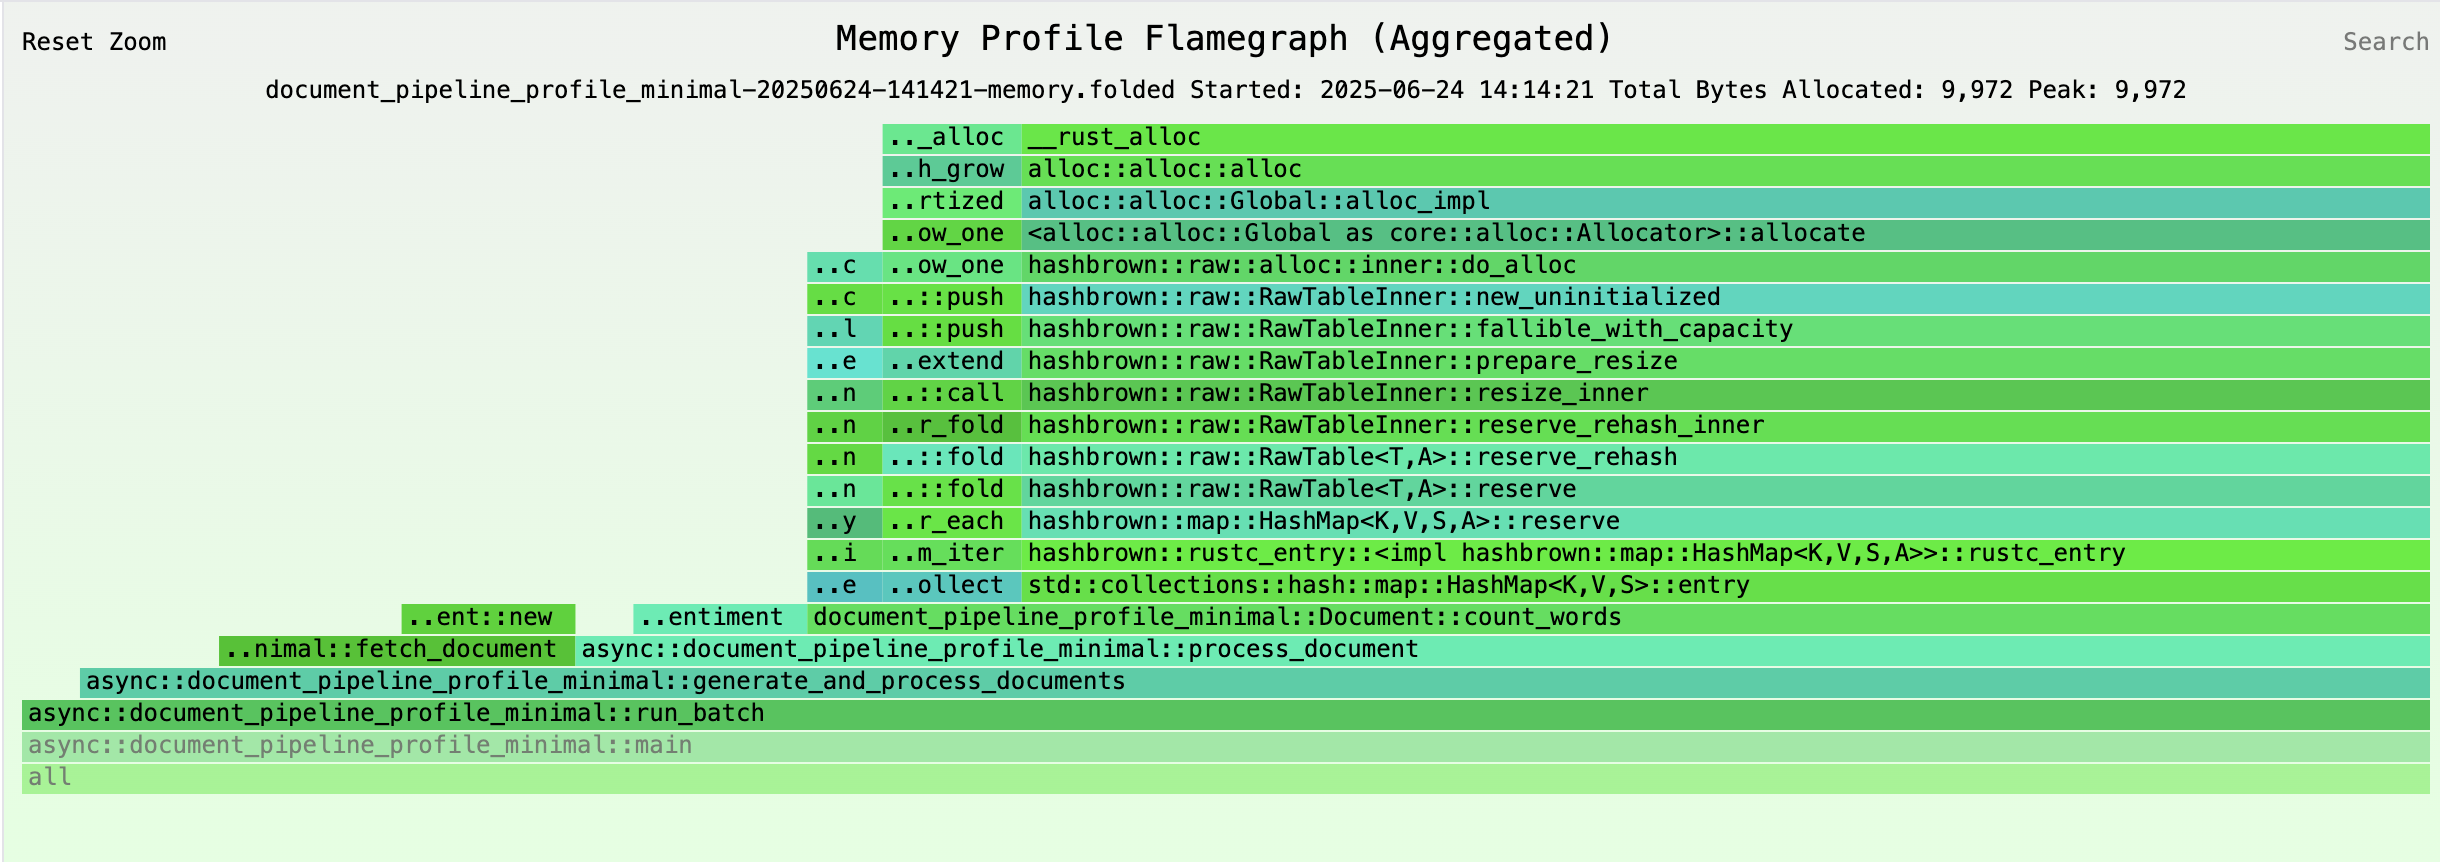](https://durbanlegend.github.io/thag_rs/thag_profiler/assets/flamegraph_mem_20250624-141421.svg)<br>
*Filtered memory profile in <code>inferno</code> "memory" color scheme with `count_words` function profiled in detail. Click on image for interactive version with clickable bars and search.*
---
## 🎬 Demo: Profiled from scratch in 1 minute
### Part 1: Instrument, profile and start analysis (1 min 0 sec)
[](https://asciinema.org/a/YP6mW01gYgW9EgZ5c01hL0vhc)
*Click to watch: The demo shows building and running an instrumented program, then generating an interactive flamegraph*
*Tip: View in full-screen mode for best legibility*
Use ***`f`*** to toggle full-screen mode.
<details>
<summary>📋 **Detailed steps shown in video**</summary>
1. **Instrument** - Auto-add profiling with `thag_instrument`
2. **View changes** - See the diff in `vimdiff`
3. **Run** - Execute the instrumented program as normal
We run with `thag` because it's a stand-alone `thag script`
4. **Analyze 1: select** - Select analysis type and data with `thag_profile`
We could have chosen memory and/or a sequential flamechart instead.
5. **Analyze 2: generate** - Select flamegraph color scheme, generate and open in browser
</details>
- Since the lightweight `asciinema` tool can't see the browser, we exit at this point and return to view it interactively in Part 2.
### Part 2: View and interact with the flamegraph (21 sec)
<details>
<summary>📋 **Try this**</summary>
1. **Hover to see details** and see the following displayed for each one as a tooltip and also in the bottom area:
a. function name, preceded by `async` if applicable
b. elapsed time in microseconds
c. percentage of total elapsed time that this bar accounts for.
2. **Search for functions** Find the `count_words` function:
- Click on the `Search` link in the top right corner, enter `count` in the dialog that pops up, and press Enter. Bars with matching text will display in pink. Notice that the `count_words` function appears in two different call stacks.
3. **Expand bars and undo** Click on one of the pink bars and see how it expands to the full width of the screen, with its call stack below it.
Click on the `main` or `all` bar at the bottom to restore the full view.
Click on the other pink bar and see it do the same, showing its slightly different call stack below it.
4. **Reset view** To remove the pink highlighting, click on the `Reset` link.
</details>
[](https://durbanlegend.github.io/thag_rs/thag_profiler/assets/thag_profile_demo.svg)<br>
*Interactive flamegraph showing execution time across nested function calls. Click image for interactive version with clickable bars and search.*
---
## Features
- **Zero-cost abstraction**: No runtime overhead when `thag_profiler`'s profiling features are turned off.
- **Execution time profiling**: Low-overhead profiling to highlight hotspots. Profiler overhead is stripped out for accuracy even at small scale.
- **Accurate memory profiling**: Memory allocations are accurately tracked at line number level and ring-fenced from profiler code so that the latter can't distort the measurements. Allocations may be summarized by function or section, or broken out in detail where desired.
- **Function and section profiling**: Profiling can be applied to any number of specific non-overlapping code sections, down to single instructions.
- **Async support**: Seamlessly works with `tokio` or other async code.
- **Automatic instrumentation**: Tools to quickly bulk add and remove profiling annotations to/from source code without losing comments or formatting.
- **Interactive flamegraphs and flamecharts**: Visualize performance bottlenecks with `inferno` flamegraphs and flamecharts, and easily do before-and-after comparisons using `inferno` differential flamegraphs.
- **Graph filtering**: Filter out dead or unwanted sections of flamegraphs and flamecharts for a better view.
- **Proc macro based**: All instrumentation is provided via proc macros that provide a simple flexible interface, precise control, ring-fencing of profiler code from user code and zero-cost abstractions when profiling features are turned off.
- **Development or release build profiling**: Although `thag_profiler` is focused on the development cycle, it supports profiling release builds, subject to enabling debug information and to any limitations imposed by the `backtrace` crate.
- **One-line full detailed transitive memory profiling option**: Track all memory allocations and deallocations for your project and dependencies with a single `#[enable_profiling(runtime)]` and the `THAG_PROFILER` environment variable.
- **Intelligent output naming**: Output files are named with the source program, timestamp and profile type for quick and easy selection.
- **Cross-platform**: Works on macOS, Linux and Windows.
## Installation
Add `thag_profiler` to your `Cargo.toml`:
For inactive instrumentation, no features are needed:
```toml
[dependencies]
thag_profiler = "0.1.0"
```
To activate time profiling alone, you need the `time_profiling` feature:
```toml
thag_profiler = { version = "0.1.0", features = ["time_profiling"] }
```
For comprehensive profiling (memory and optionally time), you need the `full_profiling` feature:
```toml
thag_profiler = { version = "0.1.0", features = ["full_profiling"] }
```
Install the profiling tools:
```bash
# Install all tools
cargo install thag_profiler --features=tools
# Or install tools individually
cargo install thag_profiler --features=instrument_tool --bin thag_instrument
cargo install thag_profiler --features=instrument_tool --bin thag_uninstrument
cargo install thag_profiler --features=analyze_tool --bin thag_profile
```
## Getting Started
### 1. Instrument Your Code for Profiling
You can instrument your code permanently or semi-permanently, and activate profiling via a feature only as and when needed.
#### a. Automatically instrument your code:
Replace `2021` below with your project's Rust edition:
```bash
thag_instrument 2021 < path/to/your/file.rs > path/to/your/instrumented_file.rs
```
* Ensure your original source is backed up or committed before instrumenting.
* Replace `2021` with your project's Rust edition.
* Do NOT redirect the output to your source file.
* Compare generated code with the original to ensure correctness before overwriting any original code with instrumented code.
Repeat for all modules you want to profile.
#### ... AND / OR ...
#### b. Manually add profiling annotations:
**Imports**
```rust
use thag_profiler::{enable_profiling, profile, profiled};
```
**Enable profiling**
NB: exactly **one function** in your app should be annotated with `#[enable_profiling]`. Normally this is `fn main`, but it is possible to annotate a different function instead, to narrow the scope of profiling to a section of particular interest.
```rust
// Enable profiling for the program.
// To disable it while keeping the instrumentation, you can either
// disable the profiling features in the `thag_profiler` dependency
// or simply specify `#[enable_profiling(no)]`.
#[enable_profiling]
fn main() -> u64 {
// Function code...
42
}
```
**Instrument a function**
```rust
// Instrument a function
#[profiled]
fn expensive_calculation() -> u64 {
// Function code...
42
}
```
**Profile a section**
```rust
// Profile a specific section with `profile!` and matching `end!`
#[profiled] // Optional
fn complex_operation() {
// Some code...
profile!(expensive_part);
// Expensive operation
...
end!(expensive_part);
// More code...
}
```
**Profile a section of an async function**
For a section in a profiled async function, it's best to add `async_fn` as a second argument, as explained in the _Best Practices_ section of this document.
```rust
// Profile a specific section of an async function
#[profiled] // Optional
async fn complex_async_operation() {
// Some code...
profile!(expensive_part, async_fn);
// Expensive operation
...
end!(expensive_part);
// More code...
}
```
**Profile to the end of a function with `unbounded`**
```rust
// Profile the remainder of a function
#[profiled] // Optional
fn complex_operation() {
// Some code...
// Must be scoped to end of function
profile!(rest_of_function, unbounded);
// All code to end of function will be profiled
}
// 🚫 INCORRECT:
#[profiled] // Optional
fn complex_operation() {
// Some code...
{
// ⚠️ Unbounded keyword misused here
profile!(rest_of_block, unbounded); // 🚫
} // ⚠️ Profile will be dropped here unknown to allocation tracker
// ⚠️ The following section profiling may not work correctly due to the above
profile!(another_section);
// Expensive operation
...
end!(another_section);
}
```
### 2. Enable the Profiling Feature
In order to activate profiling, the desired `thag_profiler` feature - `time_profiling` or `full_profiling` - must be enabled at build time in one of two ways:
1. Via a `features` keyword on the `thag_profiler` dependency in the manifest (Cargo.toml or `thag` toml block).
2. Via a command-line `--features` option.
#### In regular Cargo projects
**1. Cargo.toml only**:
Either expose it directly in the dependency:
```toml
[dependencies]
thag_profiler = { version = "0.1", features = ["full_profiling"] }
```
or via a feature of your own project, with a default:
```toml
[dependencies]
thag_profiler = "0.1.0"
[features]
my_profiling = ["thag_profiler/time_profiling"]
default = [my_profiling]
```
**OR**
**2. Cargo.toml and command line**:
Either via a feature of your own project as above, but without specifying a default:
```toml
[dependencies]
thag_profiler = "0.1.0"
[features]
my_profiling = ["thag_profiler/time_profiling"]
```
then run with:
```bash
cargo run --features my_profiling
```
OR directly via the command line:
```toml
[dependencies]
thag_profiler = "0.1.0"
```
then run with:
```bash
cargo run --features thag_profiler/time_profiling
```
#### In scripts run with the `thag(_rs)` script runner
This section applies only to the `thag(_rs)` script runner [thag](../README.md), of which `thag_profiler` is an offshoot. You can safely ignore it if you're not using `thag(_rs)`.
Snippets may be profiled provided they have a function to be annotated with `#[enable_profiling]`, since the generated `fn main` will be unannotated. For an example see `demo/factorial_ibig_product_instr.rs`.
When using `thag_profiler` in `thag` scripts, for a start you have the same two options as above, except for using a `toml` block in place of a `Cargo.toml`. You also have a third option using only dependency inference and configuration:
**1. Manifest (toml block) only**:
Either expose it directly in the dependency:
```rust
/*[toml]
[dependencies]
thag_profiler = { version = "0.1", features = ["time_profiling"] }
*/
```
or via a feature of your own script, with a default:
```toml
/*[toml]
[dependencies]
thag_profiler = "0.1.0"
[features]
my_profiling = ["thag_profiler/full_profiling"]
default = [my_profiling]
*/
```
**OR**
**2. Manifest (toml block) and command line**:
Sample script configuration:
Either via a feature of your own script as above, but without specifying a default:
```toml
/*[toml]
[dependencies]
thag_profiler = "0.1.0"
[features]
# For time profiling only
my_profiling = ["thag_profiler/time_profiling"]
# OR for comprehensive profiling (time + memory)
my_profiling = ["thag_profiler/full_profiling"]
*/
```
then run with:
```bash
cargo run bank/mem_prof.rs --features=my_profiling
```
OR directly via the command line:
```rust
/*[toml]
[dependencies]
thag_profiler = "0.1.0"
*/
```
then run with:
```bash
cargo run bank/mem_prof.rs --features thag_profiler/full_profiling
```
**OR**
**3. Dependency inference and/or default feature configuration**:
The *dependency* may be omitted and will be inferred either from imports (`use thag_profiler::{enable_profiling, ...};`) or if you use the qualified forms of the macros, for example #`[thag_profiler::enable_profiling]`.
The *feature* may be configured as as a default in `~/.config/thag_rs/config.toml`, which you can conveniently edit via `thag -C`.
```toml
[dependencies.feature_overrides.thag_profiler]
required_features = ["full_profiling"]
```
Alternatively you can specify it in a toml block in your script, even in combination with dependency inference:
```toml
/*[toml]
[features]
default = ["thag_profiler/full_profiling"]
*/
```
As the examples show, you may pair any dependency option with any feature option, as long as `thag` is able to pick up both the `thag_profiler` dependency itself and the desired `thag_profiler` feature.
### 3. Run Your Application
Ensure that the `thag_profiler` feature you need is enabled by one of the methods discussed above. If using `cargo run` from the command line, and the desired feature is not specified by the manifest, you need to do so via the `--features` argument of `cargo run`.
If your app is annotated with `#[enable_profiling(runtime)]`, specify the environment variable `THAG_PROFILER=[profile_type][,[output_dir][,[debug_level][,memory_detail]]]`*.
*In other words, there are 4 parameters, all optional. Comma separators are required as placeholders but trailing commas may be dropped.
If using `thag` to run a script annotated with `#[enable_profiling(runtime)]` and features not specified in a toml block or configured:
`THAG_PROFILER=both,,announce thag --features=thag_profiler/full_profiling demo/document_pipeline_profile.rs -ft`
If using `thag` to run a script annotated with `#[enable_profiling]` and features specified in a toml block or configured via `thag -C`:
`thag demo/document_pipeline_profile.rs -ft`
### 4. Analyze Results
When you run your application with profiling enabled, `thag_profiler` generates folded stack files in the current working directory, unless that location is overridden by the second argument of a `THAG_PROFILER` environment variable used in conjunction with `#[enable_profiling(runtime)]`.
Use the included analysis tool to visualize the results:
```bash
thag_profile <output_dir>
```
By default:
```bash
thag_profile .
```
This opens an interactive menu to explore your profiling data and display various flamegraphs, flamecharts or simple statistics.
`thag_profile` uses two extremely helpful third-party crates:
- `inquire` to help you select output for analysis and optionally filter out any unwanted functions.
- `inferno` to display the results in your browser as interactive flamegraphs and flamecharts.
For time profiles you can also choose to display function statistics (inclusive or exclusive of children according to the `.folded` file naming convention), and ranked by total duration or call frequency.
Flamegraphs are not offered for `*-inclusive.folded` files, since the bar lengths and displayed values would show multiple counting of descendants (double counting at every level of the stack), so these files are only useful for the statistics report.
For memory profiles you can also choose to display memory statistics and an allocation size analysis.
## Detailed Usage
### Manually Instrumenting Code for Profiling
While the `thag_instrument` tool should very quickly provide good default instrumentation, this section describes how to fine-tune the profiling to suit your needs.
In addition to enabling the appropriate `thag_profiler` feature, you must enable profiling in your code by adding the `#[enable_profiling]` attribute to the top-level function to be profiled, which is preferably but not necessarily the `main` function.
If using this attribute to annotate any function other than `main`, you need to take extra care. Annotating more than one function with `#[enable_profiling]` is not supported and behavior is undefined in such a case. The same applies to annotating an async function or a descendant of an async function with `#[enable_profiling]`, if this could cause overlap in their execution. It is safer to do the conventional thing and annotate the function in question with `#[profiled]` and the `main` function with `#[enable_profiling]`.
**NB:** The `#[enable_profiling]` attribute also profiles the function it annotates, so the `#[profiled]` attribute need not and should not be specified on the same function.
**#[enable_profiling] arguments**
The following optional arguments are available:
- `both`: Specifies both time and memory profiling.
- `memory`: Specifies memory profiling only.
- `time`: Specifies time profiling only.
- `no`: Disables profiling as a convenient alternative to disabling the profiling features of the `thag_profiler` dependency. Unlike disabling the features, this only provides zero-cost abstraction for the current function. However, at runtime the profile instantiation code generated by the other macros immediately returns `None` instead of `Some(Profile)` when profiling is disabled, so the overhead is still very slight.
- `yes`: (default) Enables profiling according to the feature specified for the `thag_profiler` dependency, which must be either `full_profiling` or `time_profiling`.
- `runtime`: Specifies that a detailed specification is to be provided at runtime via the `THAG_PROFILER` environment variable. This is the only option that allows you to influence profiling at runtime. This includes switching profiling off, thus trading the efficiency of zero-cost abstraction for the flexibility of runtime configuration. That being said, the overhead is still very small, for the reasons stated under the `no` option above.
- `function(...)`: Configures profiling options specific to the current function. Within the parentheses, you can specify any of the arguments that would be accepted by the `#[profiled]` attribute: `time`, `mem_summary`, `mem_detail`, `both`, `global`, `test`
Examples:
Basic memory profiling:
```rust
#[enable_profiling(memory)]
fn main() {
...
}
```
Enable memory profiling for the program, together with detailed memory profiling for the function itself.
Detailed memory profiling picks up all descendant functions as a matter of course, but you may
still choose to annotate any of them with #[profiled] for time profiling:
```rust
#[enable_profiling(memory, function(mem_detail))]
fn process_data() {
...
}
```
Runtime global profiling with function-specific time and detailed memory profiling:
```rust
#[enable_profiling(runtime, function(time, mem_detail))]
fn main() {
...
}
```
**Format of the `THAG_PROFILER` environment variable to be used with `#[enable_profiling(runtime)]`**
The `THAG_PROFILER` environment variable has 4 optional positional comma-separated arguments.
If `#[enable_profiling(runtime)]` is
specified but either the environment variable or its first argument is missing, no profiling is done.
Format:
`THAG_PROFILER=[profile_type][,[output_dir][,[debug_level][,memory_detail]]]`
*All parameters are optional. Commas are required as placeholders, but trailing commas may be dropped.*
| Parameter | Description |
|----------------|-------------|
| `profile_type` | `both`, `memory`, `time`, `none` (default) |
| `output_dir` *(optional)* | Output dir for `.folded` files. Default: current directory |
| `debug_level` *(optional)* | `none` (default), `announce`, or `quiet`. Logs to `temp_dir()/thag_profiler/...`. Requires `debug_logging` feature |
| `memory_detail` *(optional)* | `true` = detailed `.folded`; `false` (default) = minimal |
Examples:
```bash
THAG_PROFILER=both,$TMPDIR,announce,true cargo run
```
...specifies both memory and time profiling, `.folded` files to $TMPDIR, debug log path to be written to user program output, and full memory detail allocation and deallocation tracking (caution: may be slow) into separate `.folded` files.
```bash
THAG_PROFILER=time cargo run
```
...specifies time profiling only, `.folded` files to current directory, no debug log, no detailed memory files as not applicable to time profiling.
```bash
THAG_PROFILER=memory,,quiet thag demo/document_pipeline_profile_minimal.rs -ft
```
...runs `thag` demo script document_pipeline_profile_minimal.rs with forced rebuild (-f) and timings (-t), memory profiling only, internal debug logging without announcing the log file path, and no detailed output `.folded` files. Note that debug logging requires the `debug_logging` feature of the `thag_profiler` dependency to be enabled, otherwise the `debug_log!` macro compiles to `()` to provide a zero-cost abstraction.
The function annotated with `#[enable_profiling]` is taken to be the root of the profiling callstack.
```rust
#[enable_profiling]
fn main() {
// Your program...
}
```
### Function Profiling with `#[profiled]`
Add the `#[profiled]` attribute to any function you want to profile:
```rust
use thag_profiler::profiled;
```
Regular functions:
```rust
#[profiled]
fn expensive_calculation() -> u64 {
// Function code...
}
```
Works with async functions too:
```rust
#[profiled]
async fn fetch_data() -> Result<String, Error> {
// Async operations...
}
```
Methods in implementations:
```rust
impl MyStruct {
#[profiled]
fn process(&self, data: &[u8]) {
// Method code...
}
}
```
#### Attribute Options
The `#[profiled]` attribute macro accepts several arguments that configure how profiling is performed.
##### Usage
```rust
#[profiled]
fn my_function() { ... }
```
With arguments:
```rust
#[profiled(time, mem_detail)]
fn my_memory_intensive_function() { ... }
```
##### Available Arguments
| Argument | Description | Feature Required |
|----------|-------------|------------------|
| `time` | Enables time/performance profiling | `time_profiling` |
| `mem_summary` | Enables basic memory profiling | `full_profiling` |
| `mem_detail` | Enables detailed memory profiling | `full_profiling` |
| `both` | Shorthand to enable both time and memory profiling | `full_profiling` |
| `global` | Uses the global profile type setting | `Either` |
| `test` | Special flag for testing - enables clone of profile for test access | `Either` |
##### Notes
- **Argument Order**: The order of arguments doesn't matter - `#[profiled(time, mem_detail)]` is equivalent to `#[profiled(mem_detail, time)]`.
- **Default Behavior**: If no arguments are provided, the macro defaults to using the global profile type setting.
- **Feature Flags**: Memory-related profiling options require the `full_profiling` feature to be enabled. If only `time_profiling` is enabled, all memory profiling arguments are ignored.
- **Combined Profiling**: Using both `time` and any memory option (for example, `mem_detail` or `mem_summary`) is equivalent to using `both`.
##### Examples
Basic time profiling:
```rust
#[profiled(time)]
fn time_sensitive_function() { ... }
```
Detailed memory profiling:
```rust
#[profiled(mem_detail)]
fn memory_intensive_function() { ... }
```
Both time and memory profiling:
```rust
#[profiled(both)]
fn complex_function() { ... }
```
Or equivalently:
```rust
#[profiled(time, mem_summary)]
fn complex_function() { ... }
```
Use the global profile type:
```rust
#[profiled(global)]
fn standard_function() { ... }
```
Default - equivalent to global:
```rust
#[profiled]
fn simple_function() { ... }
```
Special case for tests:
```rust
#[profiled(time, test)]
async fn function_for_testing() { ... }
```
##### Testing Async Functions
For testing async functions with the `#[profiled]` attribute, use one of these approaches:
1. Add the `test` argument: `#[profiled(time, test)]`
2. Add a `_test` suffix to your function name: `async fn my_function_test()`
Both methods allow accessing the profile variable inside async function bodies during tests.
The `#[profiled]` attribute accepts various flags to control profiling behavior:
```rust
// Override the profile type for a specific function
#[profiled(both)]
fn allocating_function() { /* ... */ }
```
#### Order of attributes
If `#[enable_profiling]` is used in conjunction with either `#[tokio::main]` or `#[async_std::main]`, then `#[enable_profiling]` must appear _after_ the other attribute.
#### Interaction with features
If only the `time_profiling` feature is enabled, any memory profiling-specific arguments are invalid because they depend on the `full_profiling` feature. In this case they are ignored rather than raise an error.
For example:
```Rust
#[cfg(feature = "time_profiling")]
#[profiled(mem_detail)] // 🚫 Argument clashes with feature
```
### Code Section Profiling with `profile!` and `end!`
Section profiling with the `profile!` and `end!` macros allows you to profile hotspots within a function, down to single instructions.
#### Rules
1. **Global constraints take precedence**: Section profiling modes are overridden by the program defaults set by `#[enable_profiling]`.
2. **Limited integration with functions**: Profiled sections will have ancestors in the callstack, but no children. A function called from within a profiled section appears in flamegraphs, not as a child of the section but as a child of the parent function and a sibling of the section. This is because profiling hierarchies depend on built-in Rust backtraces, and sections are not a Rust feature but a `thag_profiler` artifact grafted on top of their parent function, and the complexity and overhead of transforming each backtrace to accommodate any sections is not considered worthwhile.
By the same token, there is no point in using `profile!..end!` purely to wrap a function for memory profiling, as memory allocations are only attributed once and as narrowly as possible, so they show up in the function and not in the section.
3. **No section nesting or overlaps**: Section profiles should not overlap or be nested in code. This is not checked, but memory allocations that fall within the scope of more than one section are attributed to only one of those sections rather than being double-counted.
#### Format
```Rust
profile!(name[, flag1[, flag2[, ...]]]);
```
Parameters
- **name**: A valid Rust identifier to be expanded to the variable name of the `Profile` for the section
- **flags**: Optional comma-separated identifiers that control profiling behavior
#### Available Flags
| Flag | Description |
|------|-------------|
| `time` | Enable time profiling for this section |
| `mem_summary` | Enable basic memory allocation tracking |
| `mem_detail` | Enable detailed memory allocation tracking |
| `async_fn` | Mark that this profile is for an async function |
| `unbounded` | This is equivalent to an `end!` macro at the end of the function |
#### Profile Types
The macro automatically determines the type of profiling based on the flags provided:
- **Time only**: When only the `time` flag is present
- **Memory only**: When `mem_summary` or `mem_detail` is present without `time`
- **Both**: When `time` is combined with either `mem_summary` or `mem_detail`
#### Examples
Basic time profiling:
```rust
profile!(calculate_result, time);
// calculation code here
...
end!(calculate_result);
```
Memory usage summary:
```rust
profile!(load_data, mem_summary);
// data loading code here
...
end!(load_data);
```
Detailed memory tracking:
```rust
profile!(process_image, mem_detail);
// image processing code here
...
end!(process_image);
```
Both time and memory profiling:
```rust
profile!(generate_report, time, mem_detail);
// report generation code here
...
end!(generate_report);
```
Async function profiling:
```rust
profile!(fetch_data, time, async_fn);
// data fetching code here
...
end!(fetch_data);
```
Unbounded memory profile (must NOT be manually ended):
```rust
fn multi_part_function() {
// other code here
...
profile!(long_running_task, mem_summary, unbounded);
// long running section to end of function
...
} // end of function
```
#### Notes
The macro captures source location information automatically for accurate profiling results.
Section profiling requires either:
**1. Recommended:** an `end!(<identifier>)` macro to drop the profile outside of user code and to mark the end of the section so that memory allocations can be
accurately attributed to the correct section by line number. This macro invocation must not be outside the normal Rust scope of the `profile!` macro.
The identifier must be identical to the one used in the matching `profile!` macro call, as it is used to match up the two.
or:
**2.** An `unbounded` argument to allow the profile to be dropped at the end of the _function_ and to assist memory profiling.
This is not preferred because:
a. The profile inevitably gets dropped in user code, leaving it up to the allocation tracker to identify and filter out its allocations in the first place. This is not as clean and precise as using the `end!` mechanism to ring-fence the profiler code, and thus creates more overhead and greater exposure to any potential loopholes in the filtering algorithm.
b. It has limited applicability and is open to misuse. It may only be used to profile the remainder of a function. For more limited scopes you must use an `end!` macro.
The 'unbounded` option may be dropped in future.
### Conditional Profiling
You can conditionally enable profiling based on build configuration:
**1. Function profiling examples**
Only profile function when a feature is enabled:
```rust
#[cfg_attr(feature = "my_profile_feature", profiled)]
fn expensive_calculation() { /* ... */ }
```
Only profile function in debug builds:
```rust
#[cfg_attr(debug_assertions, profiled)]
fn complex_operation() { /* ... */ }
```
**2. Section profiling example**
Only profile section in debug builds:
```rust
fn process_data(data: &[u8]) {
#[cfg(debug_assertions)]
profile!(process_data);
// Your code here...
#[cfg(debug_assertions)]
end!(process_data);
...
}
```
## In more depth
### Time Profiling
Time profiling measures the wall-clock time between profile creation and destruction, which closely approximates the time spent in the user code. It is async-compatible, has minimal overhead and is suitable for most performance investigations. It produces a regular `*.folded` file suitable for flamegraphs, flamecharts and function statistics *exclusive* of time spent in calls to other profiled functions, as well as an `*-inclusive.folded` file suitable only for function statistics *inclusive* of time spent in calls to other profiled functions. The analyzer handles these files accordingly.
### Memory Profiling
`thag_profiler` memory profiling attempts to provide a practical and convenient solution to memory profiling that is compatible with async operation.
Memory profiling (available via the `full_profiling` feature) accurately tracks every heap allocation (and for global detailed profiling, deallocation) requested by profiled user code, including reallocations, using a global memory allocator in conjunction with attribute macros to exclude `thag_profiler`'s own code from interfering with the analysis. It uses the official Rust `backtrace` crate to identify the source of the allocation or deallocation request.
**Note**: `thag_profiler` provides comprehensive memory tracking that includes allocator metadata, alignment overhead, and intermediate allocations during container growth. This may result in higher allocation counts compared to tools that only track payload data, but gives you the complete picture of your program's actual memory footprint.
#### One-Line Exhaustive Detailed Memory Profiling
A handy trick is that simply by annotating the `main` function of your project with `#[enable_profiling(runtime)]` and running it with `THAG_PROFILER=memory,,,true` you can get a fully detailed memory profile showing allocations and one showing deallocations. This also applies transitively to all the dependencies of your project!
Caution: this may be prohibitively slow, depending on your project, although the example below only took a few seconds.
##### A simple example of detailed memory profiling
Here we try the above trick on a `thag(_rs)` script that uses `syn` to print out an AST for a Rust source file. The code is available in the `thag_rs` project.
The script is `demo/syn_dump_syntax_profile_syn.rs` and we run it with `thag` to print out the `syn` AST for another, simple script called demo/hello_main.rs. Below is the execution showing the AST printout, followed by the detailed memory allocation profile for the run from `thag_profile`:
```zsh
donf@MacBook-Air thag_rs % THAG_PROFILER=both,,announce,true thag demo/syn_dump_syntax_profile_syn.rs --timings -- demo/hello_main.rs
Skipping unnecessary generation step. Use --force (-f) to override.
Skipping unnecessary cargo build step. Use --force (-f) to override.
──────────────────────────────────────────────────────────────────────
Thag Profiler debug log: /var/folders/rx/mng2ds0s6y53v12znz5jhpk80000gn/T/thag_profiler/syn_dump_syntax_profile_syn-20250521-105801-debug.log
is_profiling_enabled()? true, get_global_profile_type(): Both
File {
shebang: None,
attrs: [],
items: [
Item::Fn {
attrs: [
Attribute {
pound_token: Pound,
style: AttrStyle::Outer,
bracket_token: Bracket,
meta: Meta::NameValue {
path: Path {
leading_colon: None,
segments: [
PathSegment {
ident: Ident {
sym: doc,
span: bytes(1..60),
},
arguments: PathArguments::None,
},
],
},
eq_token: Eq,
value: Expr::Lit {
attrs: [],
lit: Lit::Str {
token: " Hello World as a program (posh Winnie-the-Pooh version)",
},
},
},
},
],
vis: Visibility::Inherited,
sig: Signature {
constness: None,
asyncness: None,
unsafety: None,
abi: None,
fn_token: Fn,
ident: Ident {
sym: main,
span: bytes(129..133),
},
generics: Generics {
lt_token: None,
params: [],
gt_token: None,
where_clause: None,
},
paren_token: Paren,
inputs: [],
variadic: None,
output: ReturnType::Default,
},
block: Block {
brace_token: Brace,
stmts: [
Stmt::Local {
attrs: [],
let_token: Let,
pat: Pat::Ident {
attrs: [],
by_ref: None,
mutability: None,
ident: Ident {
sym: other,
span: bytes(146..151),
},
subpat: None,
},
init: Some(
LocalInit {
eq_token: Eq,
expr: Expr::Lit {
attrs: [],
lit: Lit::Str {
token: "World 🌍",
},
},
diverge: None,
},
),
semi_token: Semi,
},
Stmt::Macro {
attrs: [],
mac: Macro {
path: Path {
leading_colon: None,
segments: [
PathSegment {
ident: Ident {
sym: println,
span: bytes(169..176),
},
arguments: PathArguments::None,
},
],
},
bang_token: Not,
delimiter: MacroDelimiter::Paren(
Paren,
),
tokens: TokenStream [
Literal {
lit: "Hello, {other}!",
span: bytes(178..195),
},
],
},
semi_token: Some(
Semi,
),
},
],
},
},
],
}
──────────────────────────────────────────────────────────────────────
Completed run in 4.44s
thag_rs completed processing script syn_dump_syntax_profile_syn.rs in 4.76s
donf@MacBook-Air thag_rs %
```
[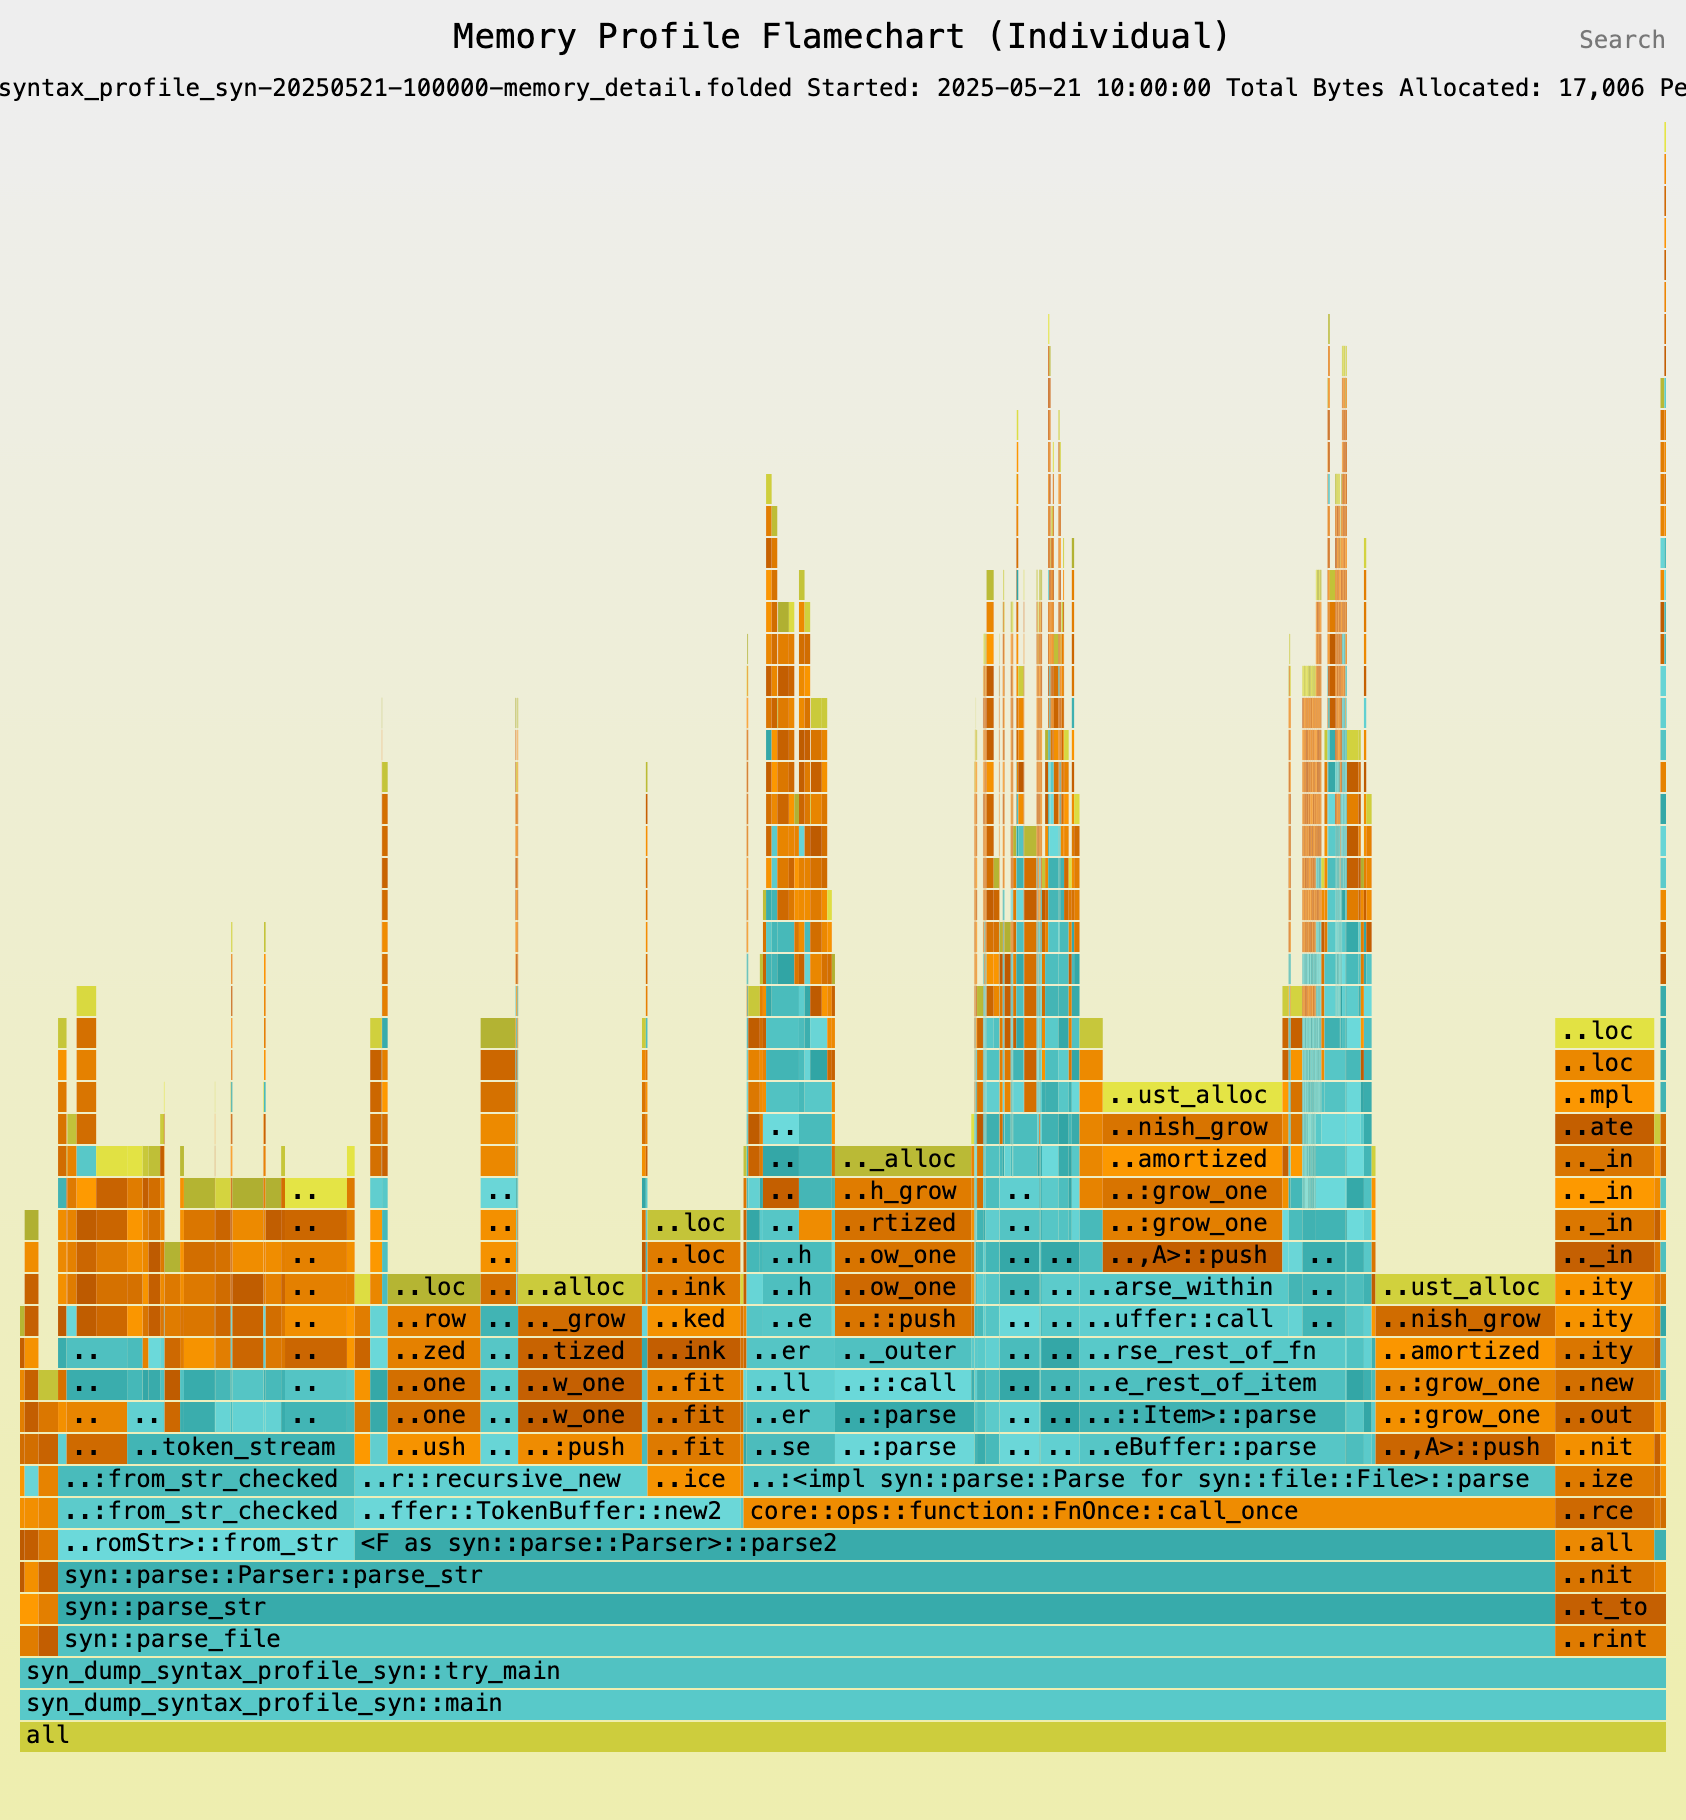](https://durbanlegend.github.io/thag_rs/thag_profiler/assets/memory_flamechart_20250521-100000.svg)<br>
*Global detailed memory profile in <code>inferno</code> "Rust" color scheme showing `syn` crate functions. Click on image for interactive version with clickable bars and search.*
##### A project example of detailed memory profiling
Here is `thag` itself in REPL mode, profiled in the same way:
[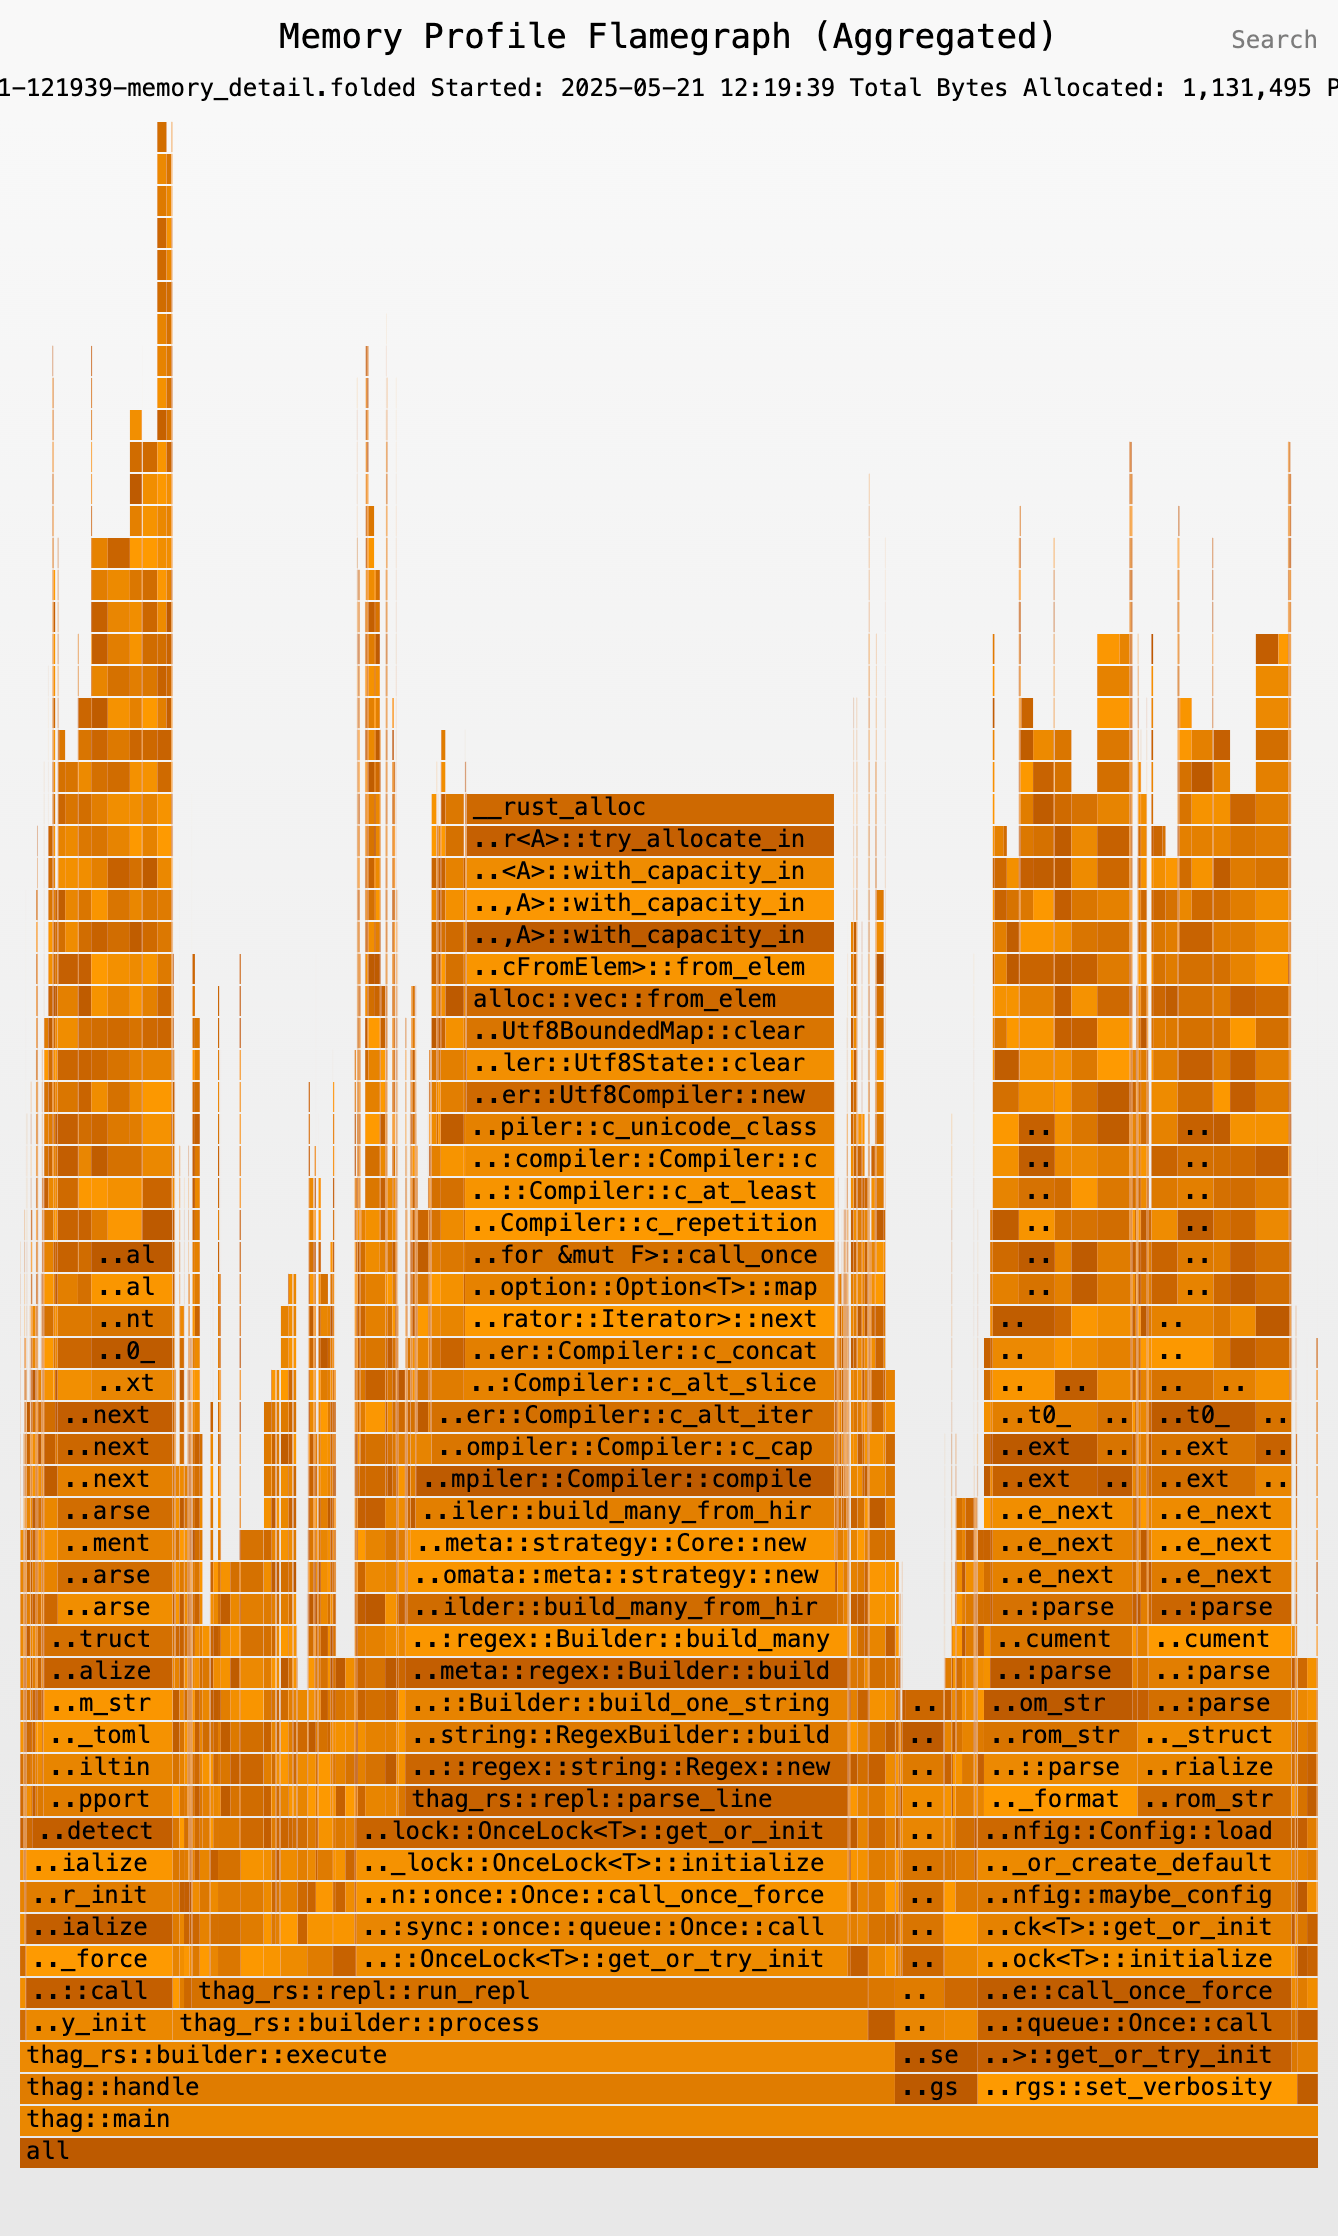](https://durbanlegend.github.io/thag_rs/thag_profiler/assets/memory_flamegraph_detail_thag.svg)<br>
*Detailed memory allocation profile in <code>inferno</code> "orange" color scheme showing all dependencies. Click on image for interactive version with clickable bars and search.*
#### Before-and-After (Differential) Memory Profiling
The `thag_profile` tool supports `inferno`'s differential profiling feature for both time and memory profiles. Simply select this option and the "before" and "after" .folded files.
[](https://durbanlegend.github.io/thag_rs/thag_profiler/assets/flamegraph_mem_diff.svg)<br>
*Differential memory profile showing reduced allocations in blue. Click on image for interactive version with clickable bars and search.*
#### Memory Profiling Limitations and Considerations
- **Performance Impact**: `thag_profiler` memory profiling introduces significant overhead compared to time profiling. Expect your application to run appreciably more slowly when memory profiling is enabled. It's strongly recommended to use memory profiling selectively for occasional health checks and targeted investigations rather than leave it enabled indefinitely.
- **Comparison with Other Memory Profilers**: `thag_profiler` aims to provide comprehensive memory tracking and may show higher allocation counts than some other profiling tools because it captures:
- Allocator metadata and alignment overhead
- Intermediate allocations during Vec/HashMap growth and reallocation
- Function-level aggregation of all allocations within profiled scopes
This comprehensive approach provides a more accurate picture of actual memory usage that your program experiences in production, including overhead that other tools might filter out.
- **Mitigating Performance Impact with Optional Tracking Threshold Size**: Detailed memory profiling in particular is obviously the slowest profiling option and may be prohibitively slow for some applications.
To mitigate this, `thag_profiler` provides a `SIZE_TRACKING_THRESHOLD=<bytes>` environment variable allowing you to track only individual allocations that exceed the specified threshold size (default value 0). This is obviously at the cost of accuracy, particularly if your app mainly does allocations below the threshold. To get a good idea of a suitable threshold value, you can first do _detailed_ memory profiling (cancel if you need to once you see significant detailed output being generated in the output directory). Then in the `thag_profile` tool, select the detailed output, then select `Show Allocation Size Distribution`. This needs to be the detailed allocations `.folded` file, because the normal memory profiling shows aggregated values per function rather than the detailed values being tracked.
The catch-22 with overriding the default zero threshold is that if there are enough small allocations below the threshold to make a significant difference in profiling speed, those small allocations may themselves be worth investigating. So rather than screen them out, you may well get a better outcome by first identifying hotspots using summary profiling, and then doing very focused detailed profiling only on these, avoiding setting a threshold if at all possible.
For accuracy it's recommended *not* to use the `SIZE_TRACKING_THRESHOLD` override if you don't have to.
- **Custom Global Allocator**: Memory profiling (the optional `full_profiling` feature) uses a custom global allocator to track memory allocations.
1. This is incompatible with specifying your own global allocator in your application (`#[global_allocator]`), as Rust only allows one global allocator.
2. **Note about thread-local storage (TLS)**: The profiler is designed to be compatible with code that uses thread-local storage. If you encounter the error "fatal runtime error: the global allocator may not use TLS with destructors", please report it as a bug.
In older versions of `async_std` (pre-1.10), there were known interactions that could cause this error in certain usage patterns. If you experience issues with a particular async runtime, consider trying alternatives like `smol` or `tokio`.
- **Thread-Safety Considerations**: Memory profiling uses global state protected by mutexes. While this works for most cases, extremely high-concurrency apps may experience contention.
- **Potential Allocator Race Conditions in Async Environments**: Unfortunately, Rust only allows a single global allocator (which `thag_profiler` refers to as the dispatcher), so profiler code must share this with user code. `thag_profiler` uses a thread-local variable to indicate to the dispatcher to use the system allocator for profiler code in place of the default "tracking" allocator.
The dispatcher delegates memory requests from user code to the tracking allocator, which records the point of origin in user code (the "allocation site") and the request type (allocation, deallocation or reallocation) and size, before in turn delegating the request to the Rust system allocator to honour the request. The dispatcher delegates requests from profiler code directly to the system allocator.
Thread-local storage is not a panacea, as `tokio` work stealing can cause a suspended task to resume on a different thread. This means that in an async environment, particularly under stress, the thread-local boolean variable that reflects the current allocator could end up out of sync with the workload it was intended to interact with, either causing user allocations to be processed through the system allocator and thus not be recorded, or causing profiler code allocations to be processed through the tracking allocator. The latter not only risks profiler code allocations being incorrectly recorded as user allocations, but risks causing the whole app to hang due to infinite recursion through the tracking allocator.
Should it be suspected that allocations are being processed through the wrong allocator, leading to inaccuracies, some mitigations you may consider are:
1. To use detailed profiling to reveal unexpected or missing allocations.
2. To compare results with another tool such as `DHAT`.
3. To reduce the number of profiled functions and sections, and if possible the number of threads, to the practical minimum in the final stages of profiling, in order to minimise contention.
4. To check for consistency in the processing of the same functions and sections over time under different load conditions and with different amounts of profiled code competing for the dispatcher.
5. If possible, to copy the relevant sections of code to a profiled `thag` script so as to study the allocations in isolation.
Fortunately, this potential issue has not shown up in unit testing, and results so far have been very consistent, so contention does not seem to be a significant issue in practice. However the potential for race conditions is a caveat when memory profiling in async environments.
- **Complete Allocation Tracking**: All allocations, including those from libraries and dependencies, are tracked and included in profiling data. This provides a comprehensive view of memory usage
across your entire application stack, revealing hidden costs from dependencies like async runtimes.
Detailed memory profiling allows you to drill down into these allocations as well as the resulting deallocations.
- **Peak memory allocation on flamegraphs and flamecharts**: The peak bytes allocated total shown in the graph headers is simply calculated at the available granularity and may therefore be a gross over-estimate. For a normal summary memory graph this is not very accurate as in the absence of profiled child functions it assumes that memory allocated over the life of a profiled function is only deallocated at the end of the function. The global detailed flamegraph, which shows the relative lifespan of each allocation in the call stack, should give an accurate figure which may be much lower.
### Profiling release builds
Although `thag_profiler` is focused on the development cycle, you may wish to do a profiling exercise on a release build. Since `thag_profiler` relies on the `backtrace` crate, see the entry for that crate on `docs.rs` for the backtrace considerations that may affect you. Specifying the following in your `Cargo.toml` or in the toml block of a `thag` script should generally work:
```toml
[profile.release]
debug = true
strip = false
```
You also need to provide the features information at build time as described in a previous section.
If you build your app with `#[enable_profiling(runtime)]`, then at runtime you need to provide the `THAG_PROFILER` environment variable specifying the runtime parameters.
### Windows Memory Profiling
For memory profiling on Windows, your application requires:
1. Debug information in the executable, which can be enabled with:
```toml
[profile.release]
debug = true
strip = false
```
2. PDB files generated by the build must be distributed alongside the executable.
These files contain the debug information needed for accurate profiling.
### Async Compatibility
`thag_profiler` supports profiling async code with some considerations:
- **Basic Time Profiling**: Works well with the async runtimes tested including tokio and smol.
- **Memory Profiling with Async**: Memory profiling in async contexts is more complex:
- Works with `tokio` and `smol` for most common patterns.
- Has a (small?) degree of exposure to race conditions, as discussed above.
- Examples of using `thag_profiler` in async contexts may be found at:
- `https://github.com/durbanlegend/thag_rs/demo/document_pipeline_profile.rs` (tokio)
- `https://github.com/durbanlegend/thag_rs/demo/smol_chat_server_profile.rs` (smol)
- `https://github.com/durbanlegend/thag_rs/demo/flume_async_profile.rs` (async-std)
- For best results in async code, use explicit section profiling with `profile!(<section_name>, async)`
### Implementation Details
`thag_profiler` uses several internal mechanisms to track profiling data:
- **Tracking allocations by line number of origin**: Memory profiling attributes allocations to the correct point of origin ("allocation site") by matching the file, function and line number of the allocation site with the file, function and line number ranges of the profiles generated by the `thag_profiler` macros.
- **Thread safety**: The profiler uses atomic operations and mutex-protected shared state to coordinate profiling across threads, with one caveat already mentioned relating to dispatching of memory allocation.
- **Guard objects**: TaskGuard objects help manage the lifetime of profiling tasks and ensure proper cleanup when tasks complete.
- **Profiler code ring-fencing**: The profiler carefully isolates its own allocations and operations from user code through the use of a dual-allocator system. This ensures that profiling overhead
doesn't contaminate the results, providing clean separation between the measurement apparatus and the code being measured.
Note that deallocations are not reported for normal memory profiling, as they invite a fruitless attempt to identify memory leaks by matching them up by function against the allocations, whereas the deallocations are often done by a parent function. However, deallocations are reported for detailed memory profiling in order to give a complete picture, so this is a better tool for identifying memory leaks, although still not a walk in the park.
#### Profiling data recording
The recording takes two forms:
a. For summary memory profiling, the allocations are attributed to a profile (a `Profile` instance representing an active execution of a function or code section) in a mutex-protected registry, by matching the allocation site against the registered active profiles. The allocation size is passed to the profile, which accumulates it. When the function completes execution the profile goes out of scope and is automatically dropped, and its `drop` trait method writes out the accumulated total to the `-memory.folded` file.
Time profiling also uses these same profiles, but in a simpler way: all that's needed is to record the duration between the activation and dropping of the profile.
In both cases, since the metrics for the function are measured over the lifetime of its profile instance, `thag_profiler` takes care to ensure that the profile lifetime coincides as closely as possible with the lifetime of the function, in order to ensure accurate measurement.
b. For detailed memory profiling, allocations and deallocations alike are not accumulated or even tracked back to a `Profile`, but immediately written with a lightly tidied-up stack to the `-memory_detail.folded` and `-memory_detail_dealloc.folded` files respectively.
Being the default, the tracking allocator is automatically used for user code and must not be used for profiler code.
To avoid getting caught up in the default allocator and causing recursion or polluting the user allocation data with its own allocations, all of the profiler's own code that runs during memory profiling execution is passed directly to the untracked System allocator in a closure or function via a `with_sys_alloc()` function (`pub fn with_sys_alloc<T, F: FnOnce() -> T>(f: F) -> T`).
### Profile Output
Profiles generate "folded" stack traces in the output directory by default:
- `your_program-<yyyymmdd>-<hhmmss>.folded`: Time profiling data for graphs and stats reporting
- `your_program-<yyyymmdd>-<hhmmss>-inclusive.folded`: Time profiling data for stats reporting
- `your_program-<yyyymmdd>-<hhmmss>-memory.folded`: Summary memory allocation data
- `your_program-<yyyymmdd>-<hhmmss>-memory_detail.folded`: Detailed memory allocation data (if enabled in 4th argument of THAG_PROFILER with #[enable_profiling(runtime)])
- `your_program-<yyyymmdd>-<hhmmss>-memory_detail_dealloc.folded`: Detailed memory deallocation data (if enabled in 4th argument of THAG_PROFILER with #[enable_profiling(runtime)])
These files can be visualized with the included `thag_profile` or with tools like [inferno-flamegraph](https://github.com/jonhoo/inferno) or the beautiful [speedscope](https://www.speedscope.app/).
`thag_profile` is recommended because it offers:
1. Correct handling of units.
2. File grouping and sorting for ease of selection and comparison.
3. Built-in file comparisons using `inferno` differential flamegraphs.
4. Filtering out of dead space in flamegraphs.
a. Irrelevant substacks
b. Dead parts of functions (as illustrated below)
### Filtering Flamegraphs and Flamecharts
[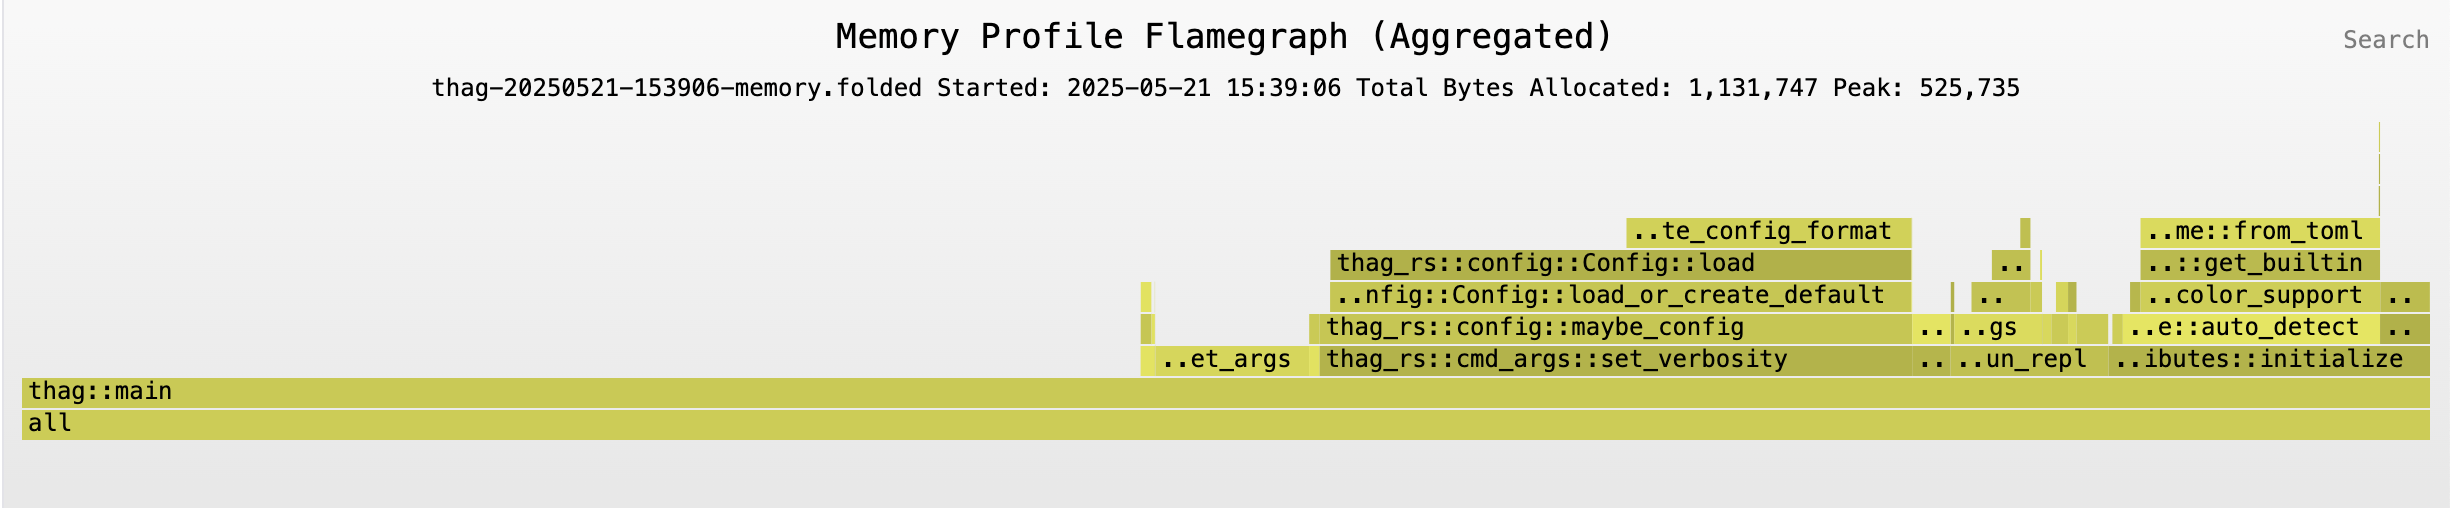](https://durbanlegend.github.io/thag_rs/thag_profiler/assets/memory_flamegraph_unfiltered.svg)<br>
*Unfiltered profile showing wasted space. <code>inferno</code> "yellow" color scheme. Click on image for interactive version with clickable bars and search.*
---
[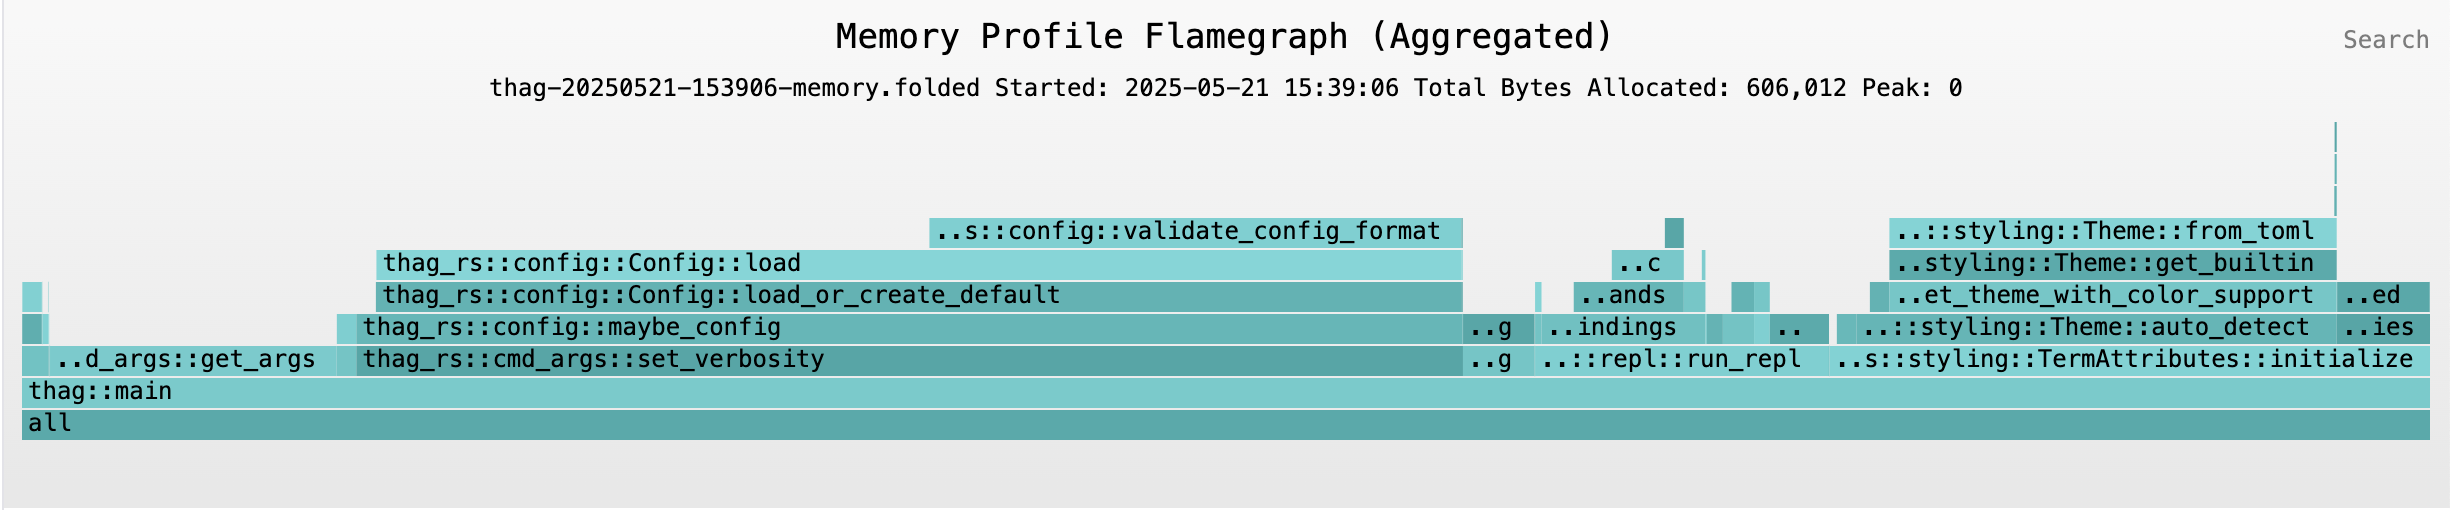](https://durbanlegend.github.io/thag_rs/thag_profiler/assets/memory_flamegraph_filtered.svg)<br>
*The same .folded file, but with the dead section of `main` filtered out for a clearer view. <code>inferno</code> "aqua" color scheme. Click on image for interactive version with clickable bars and search.*
### Profiling Tools
`thag_profiler` includes three command-line tools for working with profiles.
***Important notice:***
By using the tools, you agree to the license terms and take full responsibility for any consequences. Please take care to back up and protect your code before instrumenting or removing instrumentation.
Take care not to overwrite your code when using the instrumenting tools unless you have a backup.
[License reminder](https://durbanlegend.github.io/thag_rs/thag_profiler/assets/dont_make_me_tap_the_sign.jpg)
#### Instrumentation: thag_instrument and thag_uninstrument
Automatically add or remove profiling attributes to/from code, outputting to a different file.
These tools aim to be lossless, i.e. preserving comments and formatting intact. For this purpose
they rely on `rust-analyzer`'s `ra_ap_syntax` and `ra-ap-rustc_lexer` crates rather than `syn` and `quote`.
Input is from `stdin` and output is to `stdout`.
***NB:*** always direct output to a different file.
Replace `2021` with your project's Rust edition (2015, 2018, 2021, 2024) as required by the `rust-analyzer` crates:
***thag_instrument:*** Add profiling attributes to code
```bash
thag_instrument 2021 < path/to/your/file.rs > path/to/your/instrumented_file.rs
```
***thag_uninstrument:*** Remove profiling attributes from code
```bash
thag_uninstrument 2021 < path/to/your/instrumented_file.rs > path/to/your/de-instrumented_file.rs
```
* Ensure your original source is safely backed up or committed before instrumenting.
* Replace `2021` with your project's Rust edition.
* Do NOT redirect the output back to your source file in the same command.
* In the case of `thag_uninstrument`, you may need to remove the relevant imports manually.
`thag_uninstrument` may leave the occasional trailing space and one or two blank lines at the very top of the file.
* Compare the original and instrumented files to ensure correctness, especially if
you're using a custom edition.
For example Comparing before and after with `vimdiff`:
```
vimdiff demo/factorial_ibig_product.rs demo/factorial_ibig_product_profile.rs
```
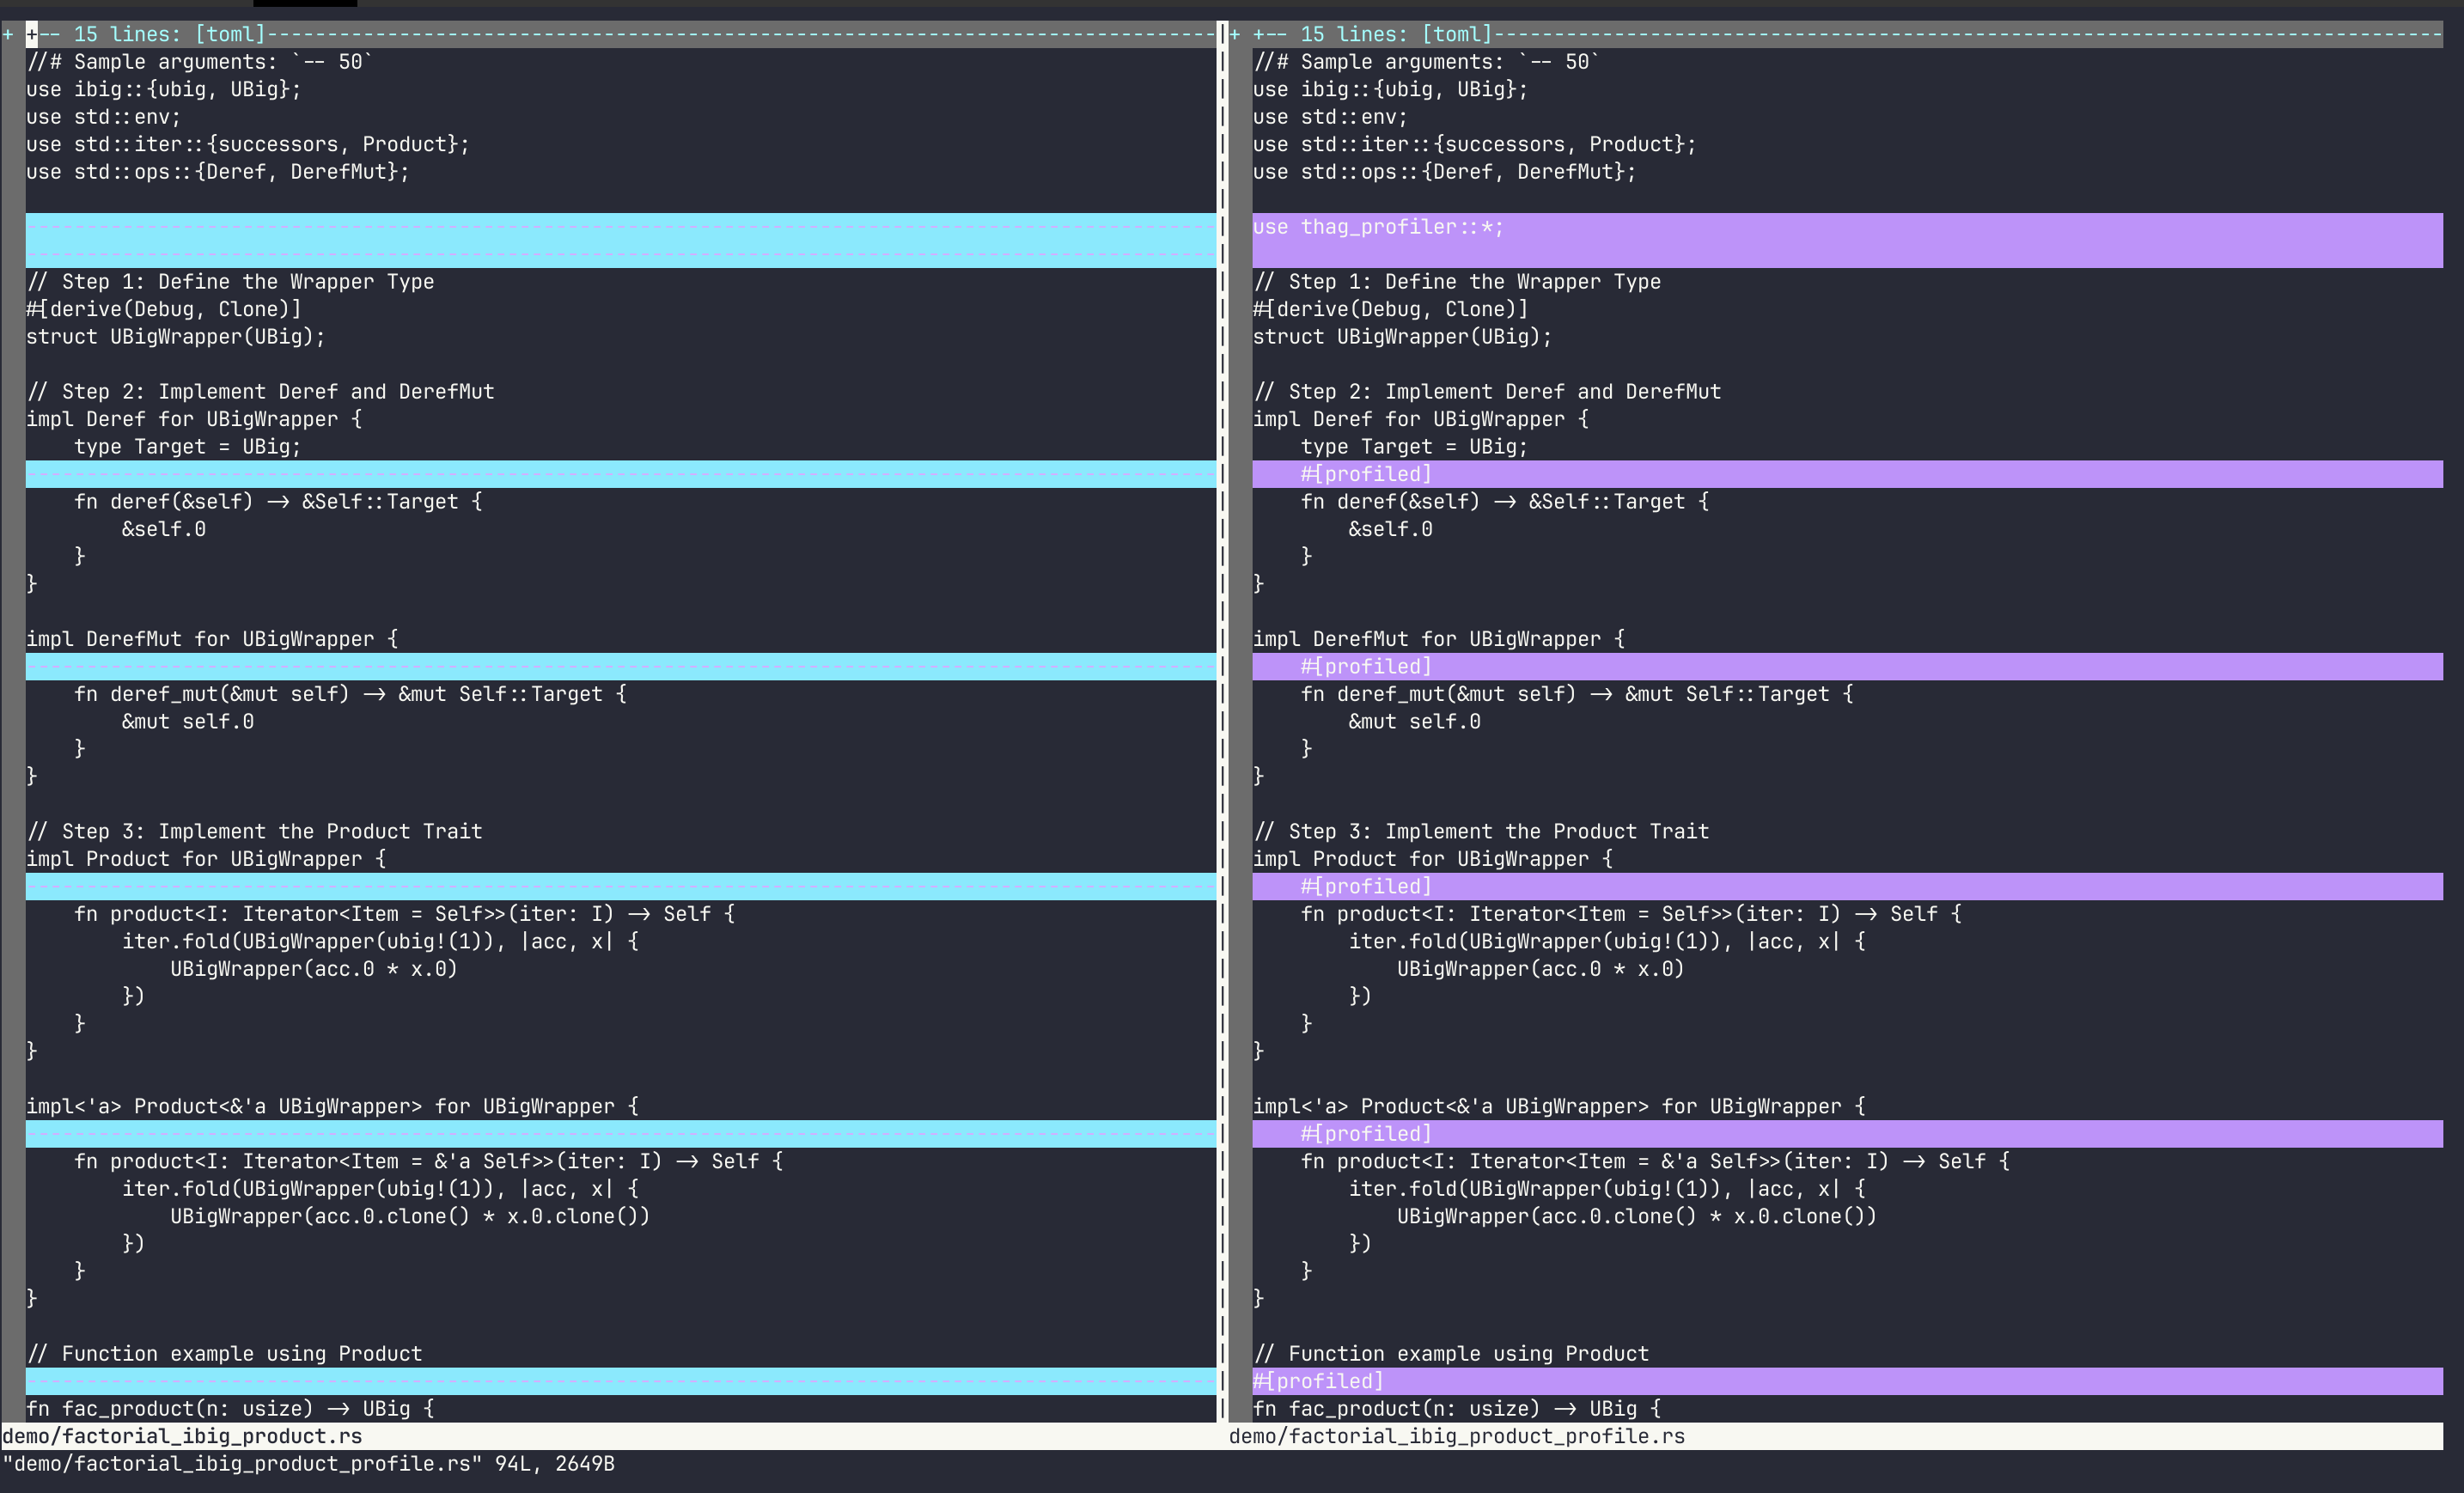
If you're profiling a project source file, at this point you'd want to replace the uninstrumented code with the instrumented version.
Repeat for all modules you want to profile.
#### Analysis: thag_profile
Interactive analysis of profiling results:
```bash
thag_profile <dirname>
```

## Profile Analysis Features
The analyzer provides:
**1. Statistical Reports**: Shows function calls, total time, average time, memory allocations by function, and memory allocation size analysis.
**2. Interactive Flamegraphs and Flamecharts**: Visual representation of performance data, both cumulative and detailed
**3. Differential Analysis**: Before/after comparisons using `inferno` differential flamegraphs module.
**4. Grouping, selection and ordering of output for analysis**: Groups files by program name and displays them with most-recent first.
**5. Graph filtering**: Filter out irrelevant sections of flamegraphs and flamecharts for a better view.
### Flamegraphs and Flamecharts
Cumulative flamegraphs and detailed flamecharts provide an intuitive interactive visualization of your profiling data. The wider a function appears, the more time (or allocated / deallocated memory) it represents relative to the total for the execution.
Flamegraphs and flamecharts are interactive SVGs that allow you to:
- Zoom in on specific functions
- Hover over functions to see detailed information
- Search for specific functions
- Compare before/after optimizations
`thag_profiler` uses the `inferno` crate to generate flamegraphs and flamecharts.
The analysis tool allows you to choose which `inferno` color scheme to use and remembers your last choice for each type (time and memory).
### Flamegraphs vs. Flamecharts
`thag_profiler` can generate both flamegraphs and flamecharts:
#### Flamegraphs
[](https://durbanlegend.github.io/thag_rs/thag_profiler/assets/flamegraph_time_20250302-080709.svg)<br>
*Example flamegraph in <code>inferno</code> "purple" color scheme. Click on image for interactive version with clickable bars and search.*
**Flamegraphs** aggregate all executions of a function into one, making them ideal for identifying which functions consume the most resources overall. Use flamegraphs when you want to identify your application's hottest functions regardless of when they occur. Flamegraphs organize functions alphabetically, so unlike flamecharts there is no significance to the horizontal sequence of items - it is only the width and the parent-child relationships that are important.
#### Flamecharts
[](https://durbanlegend.github.io/thag_rs/thag_profiler/assets/flamechart_time_20250519-155436.svg)<br>
*Example flamechart of same data in <code>inferno</code> "green" color scheme. Click on image for interactive version with clickable bars and search.*
**Flamecharts** organize functions chronologically, showing the sequence of operations over time. They're particularly valuable for:
- Understanding the progression of your application's execution
- Identifying patterns in memory allocation/deallocation
- Seeing how different phases of your application behave
Note that `inferno` still aggregates consecutive entries with the same key into a single bar. So if a profiled function or section `f` is called repeatedly in a loop in a synchronous program, these executions are shown as one. In an async environment, the consecutive entries for `f` may be arbitrarily interleaved with entries written by unrelated asynchronous profiles being dropped, for example `f,f,f,a,f,f,b,c,f`. This causes `inferno` to group the consecutive entries for `f` in the arbitrary consecutive groups thus created.
In other words, while `thag_profiler` should always attribute an allocation event to the right function or section, or in a worst case to an ancestor at least, be aware that in an async environment it may attribute the event to the wrong *execution* of that function. We could consider working around this, for example by giving each execution a unique subscript, but in the async scenario when multiple instances of `f` are running concurrently, `thag_profiler`'s memory tracker has no sure way to tell them apart anyway, and must resort to arbitrarily attributing the allocation to the most recently instantiated active one of them, falling back to the closest matching ancestor as a last resort.
For time profiling, flamecharts show when each function executed relative to others. For summary memory profiling, they are less significant because all allocations for a function are shown as at the end of execution of the function, because it is at this point that the `Profile` object generated for that execution of the function is dropped, causing its `drop` method to write the function's accumulated allocations to the `-memory.folded` file.
For detailed memory profiling, flamecharts are again more significant. They show when the allocations (for `-memory_detail.folded` and deallocations (for `-memory_detail_dealloc.folded`) actually occurred, as they are recorded immediately the allocation or deallocation requests are received and identified by the global allocator.
In general, choose flamegraphs for a high-level view of resource usage and flamecharts for detailed analysis of execution flow.
## Best Practices
**1. Profile representative workloads**: Make sure your test cases represent real-world usage
**2. Focus on hot paths**: Look for the widest blocks in your flamechart - these are your performance bottlenecks
**3. Compare before/after**: Always compare profiles before and after optimization
**4. Watch for memory bloat**: Use memory profiling to identify excessive allocations
**5. Verify changes**: Always verify automated changes with a diff tool
**6. Don't run with option `both` for serious time profiling**: The memory profiling overhead tends to distort the relative execution times of the functions and sections
**7. Section profiling in async functions**: For accurate callstack representation in async contexts, use the `async_fn` parameter when manually creating profile sections within async functions
**8. Profiling efficiency**: Every execution of an actively profiled function requires a Profile struct to be set up at the beginning and torn down at the end after logging the captured data for that function execution. The Profile setup and teardown time amount to about 1ms (based on an M1 MacBook). This time is stripped out of the results, but still has an appreciable effect on runtime when profiling very lightweight functions that are called many thousands, millions or billions of times during execution. If such a function is called from a loop, consider profiling the loop as a whole (with a section profile or by factoring it out to a separate profiled function) rather that incurring the extra overhead of profiling the inner function to record each individual function call.
**9. Understand how differential profiling graphs work in `inferno`**: `thag_profiler` delegates these entirely to `inferno`, which does not report straight comparisons but normalises the "before" profile count to match the "after" one in an attempt to compensate for inferred changes in external variables such as machine loading, even though they may in fact be almost entirely due to the changes being compared. This seems to have been optional in the Brendan Gregg's original flamegraph toolkit but not in `inferno`. I don't have strong views on the merits of this implementation, but it may cause small but worthwhile changes to literally pale into insignificance beside the most substantial ones, and not show up as improvements until hovered over.
```rust
async fn fetch_data() {
// Tell the profiler this section is within an async function
profile!(database_query, async_fn);
// Async operations...
let result = query_database().await;
end!(database_query);
}
```
This ensures that the profile correctly associates the section with its async parent function in the profiling output. Without this parameter, the section will appear a second time in the flamegraph without its async identifier, as there is no way to link the two automatically.
## Troubleshooting
### Common Issues
**1. Missing profile output**: Ensure that the `time_profiling` or `full_profiling` feature of the `thag_profiler` dependency is enabled.
Ensure profiling is enabled and you have write permissions in the current directory.
Ensure your code is compiled with the `debug` option while profiling. For example in release mode:
```toml
[profile.release]
debug = true
strip = false
```
Ensure that unbounded section profiles do not go out of scope before the end of the current _function_.
Ensure that bounded section profiles do not go out of scope before the `end!` macro.
**2. Inaccurate profile output**: Ensure you have no nested or overlapping profile sections. A high degree of contention between threads could also lead to memory allocations not being reported or reported against an ancestor function (that is, one higher up the callstack).
**3. Test failures**: Profiled tests must use serialization.
**4. Performance impact**: Memory profiling adds significant overhead. Consider using SIZE_TRACKING_THRESHOLD=n as discussed above to ignore small allocations of integer `n` bytes or smaller.
**5. File redirect issues**: Never redirect output from the instrumentation tools back to the input file.
### Inspecting Profile Files
The folded stack files are human-readable:
```bash
head your_executable-<yyyymmdd>-<hhmmss>.folded
```
## Verification against `dhat` crate
The `bash` script `scripts/compare_profilers.sh` can be used to verify the accuracy of `thag_profiler` memory profiling against the established `dhat` crate.
```bash
scripts/compare_profilers.sh
```
You need to have `jq` installed to summarize the `dhat` results.
Notes:
1. `thag_profiler` does not offer a `PowerShell` version of `scripts/compare_profilers.sh`. Short of rolling your own or getting AI to convert it, you may instead find the following suggestion useful:
Install `Git for Windows` and run the `Git Bash` app.
Running `scripts/compare_profilers.sh` within the `Git Bash` window will still run the Windows version of `thag`, as opposed to using `WSL`.
2. `dhat` itself provides no guarantees. See the warning on its [docs.rs page](https://docs.rs/dhat/latest/dhat/).
3. `dhat` and `thag_profiler` both use the `backtrace` crate to identify memory allocation sites, so to this extent they are not giving completely mutually independent assessments of memory usage.
4. To dig deeper than the summary results and investigate the extra allocation reported (at time of writing) by `thag_profiler` for the `allocate_hashmap` function, you can run a detailed `thag_profiler` analysis like this:
```bash
THAG_PROFILER=memory,,announce,true thag --features full_profiling demo/thag_profile_benchmark.rs -f
```
Then run `thag_profile .` and choose `Memory Profile - Single` and the most recent `thag_profile_benchmark-<yyyymmdd>-<hhmmss>-memory_detail.folded`. Drill down to the affected functions by clicking on each one in turn and compare it to the various occurrences of the same function in the `DHAT` viewer. This currently shows that `thag_profiler` is correctly reflecting 103 kB for the inserts (`std::collections::hash::map::HashMap<K,V,S>::insert
`) which `dhat` is not. There are some other minor discrepancies, but these are due to the DHAT viewer suppressing them as insignificant, and they can be tracked down in the `dhat-heap.json` file.
## Documentation
This library provides two levels of documentation to serve different audiences:
### Public API Documentation (Default)
Generate clean, user-focused documentation that hides implementation details:
```bash
cargo doc --package thag_profiler --features document-features,full_profiling,debug_logging --no-deps
```
This shows only the essential public API that most users need:
- Core profiling attributes (`#[profiled]`, `#[enable_profiling]`)
- Main configuration types (``ProfileType`)
- Essential functions (`disable_profiling`, `is_profiling_enabled`)
- Memory profiling utilities (when `full_profiling` feature is enabled)
### Internal Documentation (Development)
Generate comprehensive documentation including implementation details:
```bash
cargo doc --package thag_profiler --features document-features,full_profiling,debug_logging,internal_docs --no-deps
```
For the most comprehensive documentation including private items:
```bash
cargo doc --package thag_profiler --features document-features,full_profiling,debug_logging,internal_docs --no-deps --document-private-items
```
This includes everything from the public API plus:
- Internal utility functions
- Debug logging infrastructure
- Advanced configuration functions
- Implementation macros and helpers
- Development and debugging tools
- Private functions and modules (when using `--document-private-items`)
### Implementation
The library provides two convenient ways to mark internal items:
1. **Using the `#[internal_doc]` macro** (recommended):
```rust
use thag_profiler::internal_doc;
#[internal_doc]
pub fn internal_utility() {
// Hidden from public API docs
}
```
2. **Using the manual attribute**:
```rust
#[cfg_attr(not(feature = "internal_docs"), doc(hidden))]
pub fn internal_utility() {
// Hidden from public API docs
}
```
### Rationale
Many internal functions need to be `pub` for use across modules and by generated macros, but they're not intended for direct use by library consumers. The `internal_docs` feature flag allows:
- **Library users** get clean, focused documentation showing only what they need
- **Contributors/maintainers** can generate complete documentation for development
- **docs.rs** can show comprehensive documentation with all features enabled
Use the provided `doc_examples.sh` script to see all documentation modes in action.
## Terminology
### Ancestor and descendant functions
An **ancestor function** of a function `f` means any function that may directly or indirectly call function `f` during execution.
A **descendant function** of a function `f` means any function that may be called directly or indirectly by function `f` during execution.
### Manifest
In a normal project, the manifest is the Cargo.toml file. In a Rust script to be run with `thag(_rs)`, the manifest is a "toml block" consisting of a `/**[toml!] ... */` comment embedded at the top of the script and containing entries in Cargo.toml format. `thag` uses the toml block contents in conjunction with any additional dependencies inferred from the Rust code to generate a Cargo.toml for the script.
## License
SPDX-License-Identifier: Apache-2.0 OR MIT
Licensed under either of
Apache License, Version 2.0 (LICENSE-APACHE or http://www.apache.org/licenses/LICENSE-2.0)
or
MIT license (LICENSE-MIT or http://opensource.org/licenses/MIT)
as you prefer.
## Contributing
Contributions will be considered (under MIT/Apache 2 license) if they align with the aims of the project.
Rust code should pass clippy::pedantic checks.