# thag_demo
[](https://crates.io/crates/thag_demo)
[](https://docs.rs/thag_demo)
Interactive demos for `thag_rs` and `thag_profiler` - run Rust profiling examples without installing thag!
## Quick Start
**One-line demo experience:**
```bash
**Or install manually:**
```bash
cargo install thag_demo
thag_demo --list
```
## What is thag_demo?
`thag_demo` is a lightweight facade over `thag_rs` that provides curated profiling examples and demonstrations. It's designed to let you explore the capabilities of `thag_profiler` without needing to install the full `thag_rs` toolkit.
## Available Demos
### 🔥 Basic Profiling
```bash
thag_demo basic-profiling
```
Learn the fundamentals of function timing and profiling with the `#[profiled]` attribute.
### ⏱️ Time Profiling
```bash
thag_demo time-profiling
```
Execution time profiling of nested functions with automatic flamegraph generation and browser visualization.
#### Demo
[](https://asciinema.org/a/yafJCMFioVa6vur4Pdk52ZG2A)
*Click to watch: The demo shows building and running an instrumented program, then generating an interactive flamegraph*
<details>
<summary>📋 **Detailed steps**</summary>
- Type thag_demo to show the welcome screen showing options.
- Type thag_demo time-profiling to invoke the time profiling demo.
- Builds (if needed) and runs a sample program instrumented with thag_profiler execution time profiling.
- Offers to show a flamegraph of the results. Respond ‘y’.
- Displays collected stats while it builds and shows the flamegraph in the browser.
- The flamegraph is not recorded by the `asciinema` recorder because the latter is terminal-based, but is shown both as PNG and interactive SVG in thag_demo README.md.
- End of demo.
</details>
[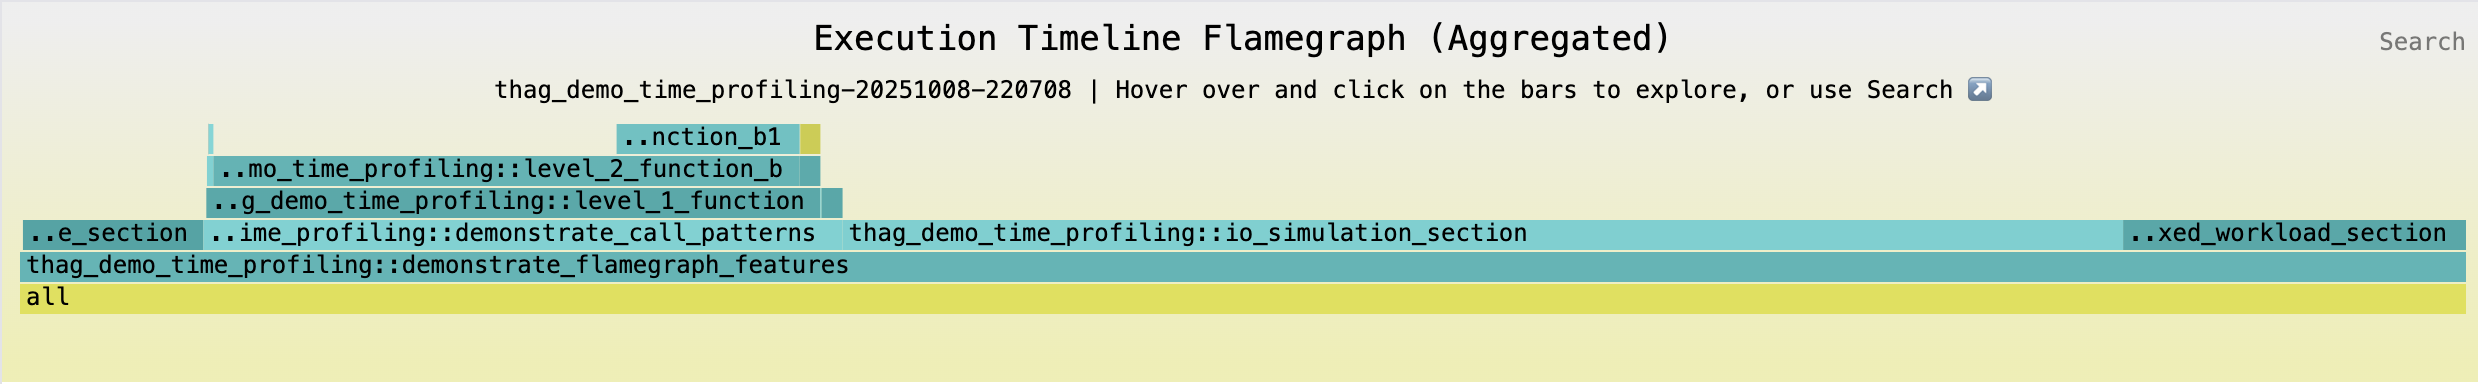](https://durbanlegend.github.io/thag_rs/thag_demo/assets/time_profiling_demo.svg)<br>
*Interactive flamegraph showing execution time across nested function calls. Click image for interactive version with clickable bars and search.*
<details>
<summary>📋 **Try this**</summary>
1. **Hover to see details** and see the following displayed for each one as a tooltip and also in the bottom area:
a. function name, preceded by `async` if applicable
b. elapsed time in microseconds
c. percentage of total elapsed time that this bar accounts for.
2. **Search for functions** Find functions whose names contain `_a`:
- Click on the `Search` link in the top right corner, enter `_a` in the dialog that pops up, and press Enter. Bars with matching text will display in pink. Notice that matching functions appear in three different places stacks.
3. **Expand bars and undo** Click on one of the pink bars and see how it expands to the full width of the screen, with its call stack below it.
Click on the `main` or `all` bar at the bottom to restore the full view.
Click on another of the pink bars and see it do the same, showing its slightly different call stack below it.
4. **Reset view** To remove the pink highlighting, click on the `Reset` link.
</details>
### 🧠 Memory Profiling
```bash
thag_demo memory-profiling
```
Explore memory allocation tracking, heap analysis, and memory flamegraphs.
### 🤹♂️ Async Profiling
```bash
thag_demo async-profiling
```
Discover how to profile async functions, futures, and Tokio runtime integration.
### ⚖️ Performance Comparison
```bash
thag_demo comparison
```
See before/after performance analysis with differential profiling techniques.
### 📊 Interactive Flamegraphs
```bash
thag_demo flamegraph
```
Generate and understand interactive flamegraphs for visual performance analysis.
### 🏁 Comprehensive Benchmark
```bash
thag_demo benchmark
```
Run a full-featured benchmark showcasing all profiling capabilities.
### 🧭 Interactive Demo Browser
```bash
thag_demo browse
```
Browse and run demo scripts interactively with filtering and search.
#### Demo
[](https://asciinema.org/a/3TgTf3w3O57Zr7G6GYUuwlq4y)
*Click to watch: The demo shows running `thag_demo browse` to view all the `thag` scripts in $THAG_DEMO_DIR, and selecting and running the `ratatui` showcase demo. It also highlights the use of `thag_styling` integrations to automatically theme both the `inquire` selection list and the `ratatui` showcase screen with the current `catppuccin-mocha` theme.*
<details>
<summary>📋 **Detailed steps**</summary>
- Invoke thag_demo with the browse option.
- Inquire crate displays themed scrollable list of thag demo scripts.
- Type rata to narrow the search on the fly.
- Arrow down to select ratatui_theming_showcase script.
- Enter to invoke run options for the script.
- Final Enter builds script if needed and runs it.
- Demo shows `ratatui` showcase app, themed by `thag_styling` with the terminal’s current `catppuccin-mocha` theme, as specified by $THAG_THEME.
- Show first panel of app with progress bar responding to keys or mouse. **The dashed vertical border effect in some areas is an artefact of the video player**.
- Show pop-up help.
- Show remaining 3 panels in turn.
- Enter q to return to thag_demo browse.
- Esc to end thag_demo browse.
</details>
### 📋 List All Scripts
```bash
thag_demo list-scripts
```
See all available demo scripts with descriptions and categories.
### ⚙️ Demo Directory Management
```bash
thag_demo manage
```
Download, update, or manage the demo script collection.
### 📝 Custom Scripts
```bash
thag_demo script <script_name>
```
Run any script from the thag_rs demo collection.
## Features
- **Zero installation friction** - One command to install and run
- **Interactive demo browser** - Browse 330+ demo scripts with filtering and search
- **Automatic demo directory management** - Downloads demo collection as needed
- **Interactive examples** - Each demo explains what it's doing
- **Progressive complexity** - Start simple, work up to advanced features
- **Visual output** - Generates flamegraphs and performance visualizations
- **Educational** - Learn profiling techniques through practical examples
- **Comprehensive** - Covers time, memory, async, and differential profiling
- **Smart discovery** - Finds demo directory in multiple standard locations
## What You'll Learn
### Time Profiling
- Function-level timing with `#[profiled]`
- Flamegraph generation and interpretation
- Hotspot identification and analysis
### Memory Profiling
- Allocation tracking and visualization
- Memory leak detection
- Heap analysis and optimization
### Async Profiling
- Profiling async functions and futures
- Understanding async execution patterns
- Tokio runtime integration
### Advanced Features
- Differential profiling for before/after comparisons
- Custom profiling annotations
- Performance optimization techniques
## How It Works
`thag_demo` is a thin wrapper around `thag_rs` that:
1. **Bundles curated examples** - High-quality profiling demonstrations
2. **Manages demo collection** - Automatically downloads 330+ demo scripts
3. **Provides interactive browsing** - Filter and search through demos by name/category
4. **Configures thag_rs** - Pre-configured for optimal demo experience
5. **Provides guidance** - Explains what each demo teaches
6. **Generates artifacts** - Creates flamegraphs and profile data you can explore
### Demo Directory Discovery
The tool automatically searches for demo scripts in multiple locations:
- Sibling to thag_demo installation
- `~/.thag/demo` (standard user location)
- `$THAG_DEMO_DIR` environment variable
- `./demo` in current directory
If not found, it offers to download the demo collection using `thag_get_demo_dir`.
## Interactive Commands
### Browse Demos Interactively
```bash
thag_demo browse
```
- Filter demos by typing part of the name
- Navigate with arrow keys
- See descriptions and categories inline
- Run demos directly from the browser
### Manage Demo Directory
```bash
thag_demo manage
```
- Download the demo collection if not present
- Update existing demo collection
- View directory information and statistics
- Browse demos interactively
### List All Available Scripts
```bash
thag_demo list-scripts
```
- Shows both built-in demos and script demos
- Displays descriptions and categories
- Provides usage examples
## Requirements
- Rust toolchain (stable)
- Internet connection (for demo directory download)
- Git (for downloading demo collection)
## Output Files
Each demo generates several files you can explore:
- `*.svg` - Interactive flamegraphs (open in browser)
- `*.folded` - Raw profile data for analysis
- Console output with explanations and tips
## Integration with thag_profiler
All demos use `thag_profiler` annotations:
```rust
use thag_profiler::{enable_profiling, profiled};
#[profiled]
fn my_function() {
// Your code here
}
#[enable_profiling(time)]
fn main() {
my_function();
}
```
## Next Steps
After running the demos:
1. **Explore the flamegraphs** - Open the `.svg` files in your browser
2. **Try thag_profiler** - Add profiling to your own projects
3. **Use thag_rs** - Install the full toolkit for script development
4. **Read the docs** - Check out the full documentation
## Resources
- [thag_profiler documentation](https://docs.rs/thag_profiler)
- [thag_rs repository](https://github.com/durbanlegend/thag_rs)
- [Profiling guide](https://github.com/durbanlegend/thag_rs/blob/main/thag_profiler/README.md)
- [More examples](https://github.com/durbanlegend/thag_rs/tree/main/demo)
## License
Licensed under either of
- Apache License, Version 2.0 ([LICENSE-APACHE](LICENSE-APACHE) or http://www.apache.org/licenses/LICENSE-2.0)
- MIT license ([LICENSE-MIT](LICENSE-MIT) or http://opensource.org/licenses/MIT)
at your option.
## Contributing
Contributions will be considered (under MIT/Apache 2 license) if they align with the aims of the project.
Rust code should pass clippy::pedantic checks.