# Sysit
System Sit, check on the system with a quick glance!
[](https://crates.io/crates/sysit)
[](https://github.com/crodjer/sysit/actions?workflow=CI)
## About
System resources overview within 40 characters. Relies on
[sysinfo](https://github.com/GuillaumeGomez/sysinfo) to get all the relevant system
information.

## Install
Build it:
```
cargo install sysit
```
or download the pre-built binaries for the
[latest release](https://github.com/crodjer/sysit/releases/latest).
## Reasoning
When working headlessly with tmux or even when working on a desktop,
being able to quickly see basic system informatino can be useful.
There's `btm` (also based on `sysinfo`, `heim`), but you have to
actively switch to them.
For instance, when overclocking the RPi, it makes sense to monitor the
CPU frequency and temperature. Inspired by [cpu-temp-speed](https://gitlab.manjaro.org/manjaro-arm/packages/community/cpu-temp-speed)
on Manjaro, which has been quite useful in tuning the overclock and
colling system configuration.
# Usage
## From the console
Simply type `sysit` for a quick glance at the system information.
```
rohan in mir in sysit on master is 📦 v0.1.0 via 🦀 v1.49.0
at 17:45:13 ❯ sysit
This can also be used with a desktop manager's applets. For example,
Xfce's `genmon`.
## Continuous Monitoring
### Watch Mode
Works as if `watch sysit`. Can be used within tmux status line for
continuous monitoring. Eg:
```tmux.conf
set -g status-right '#[fg=yellow] #(sysit -wi 2) #[fg=colour235,bg=colour252,bold] %a %d %b %H:%M:%S #[fg=colour252,bg=colour238,nobold]#[fg=colour245,bg=colour238,bold]'
```
Watch mode with `sysit -wi 2` has a benefit of maintaining a single
process. Just using plain `sysit` command will also work, but that'd
mean tmux spawns a new process every time.
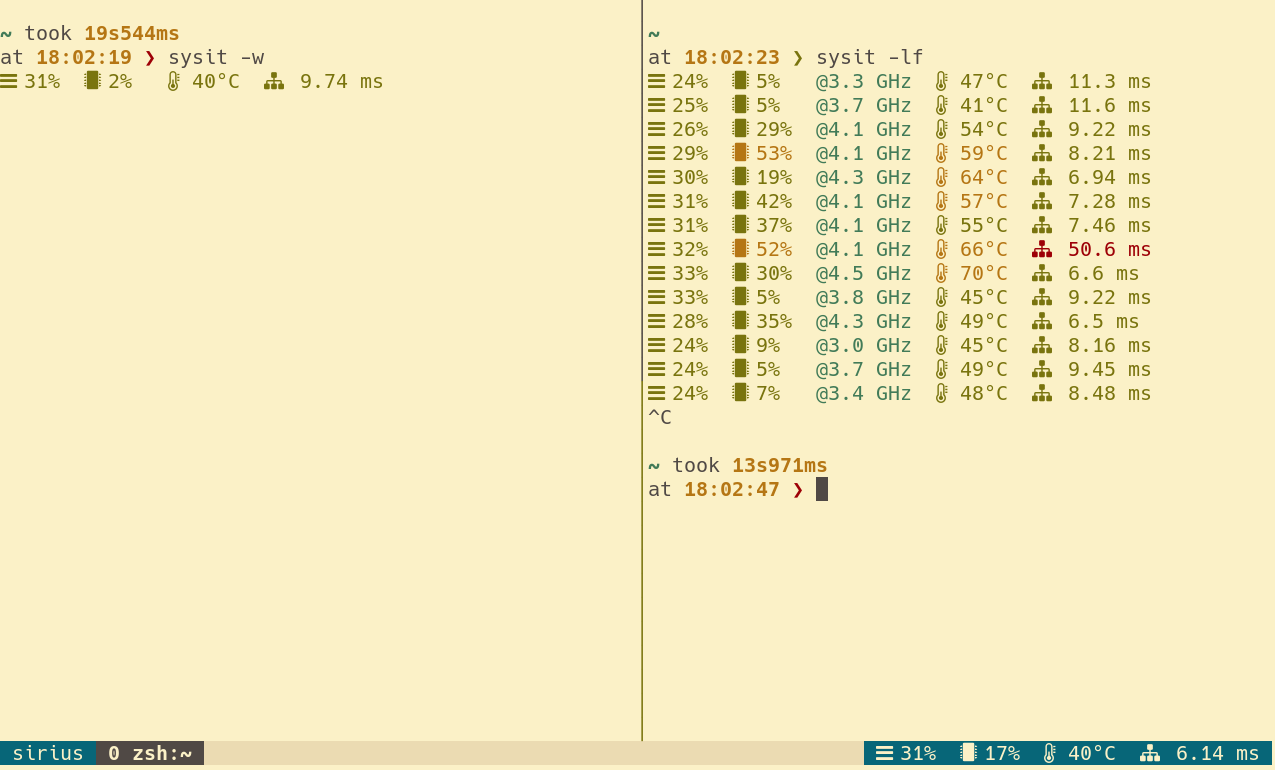
### Log Mode
At times it can be handy to log system stats, for instance, while
benchmarking.
```
rohan in mir in sysit on master [?] is 📦 v0.1.0 via 🦀 v1.49.0
at 19:22:44 ❯ sysit -li 1
M: 11% | C: 87% @ 2100 MHz | T: 56°C
M: 11% | C: 100% @ 2100 MHz | T: 60°C
M: 11% | C: 100% @ 2100 MHz | T: 63°C
M: 11% | C: 100% @ 2100 MHz | T: 61°C
M: 11% | C: 0% @ 600 MHz | T: 59°C
```
## Help
```
sysit
Get system resources overview in 40 characters. For usage details, try --help
USAGE:
sysit [FLAGS] [OPTIONS]
FLAGS:
-c, --colors force output to be always colorized
-h, --help Prints help information
-l, --log run in log mode (will continuously append a row to standard output)
--no-colors force output to be never colorized
-V, --version Prints version information
-w, --watch run in watch mode (will act as if running with the watch)
OPTIONS:
-i, --interval <interval>
update interval in seconds for watch/log mode [default: 1]
--threshold-cpu-high <threshold-cpu-high>
the threshold for high cpu usage (higher values will be rendered in red) [default:
80.0]
--threshold-cpu-medium <threshold-cpu-medium>
the threshold for medium cpu usage (higher values will be rendered in yellow) [default:
50.0]
--threshold-memory-high <threshold-memory-high>
the threshold for high memory usage (higher values will be rendered in red) [default:
80.0]
--threshold-memory-medium <threshold-memory-medium>
the threshold for medium memory usage (higher values will be rendered in yellow)
[default: 50.0]
--threshold-temp-hot <threshold-temp-hot>
the threshold for high temperature (higher values will be rendered in red) [default:
75.0]
--threshold-temp-warm <threshold-temp-warm>
the threshold for warm temperature (higher values will be rendered in yellow) [default:
55.0]
```