# sql2viz
Transform Raw SQL queries into visualizations using DuckDB and Iced.
## Installation
```toml
[dependencies]
sql2viz = { version = "0.1", features = ["gui"] }
```
## Usage
```rust
use sql2viz::vizcreate;
fn main() {
let query = "SELECT 'A' as x, 10 as y UNION ALL SELECT 'B', 20";
vizcreate(query.to_string()).unwrap();
}
```
### Example with Database and CSV
```rust
use sql2viz::vizcreate;
fn main() {
let queries = "
-- Connect to existing database
ATTACH 'mydata.db' AS mydb;
-- Query 1: Sales summary by category
SELECT category, SUM(amount) as total_sales
FROM mydb.sales
GROUP BY category
ORDER BY total_sales DESC;
-- Query 2: Load CSV file
SELECT * FROM 'test.csv' LIMIT 100;
";
vizcreate(queries.to_string()).unwrap();
}
```
### Screenshots
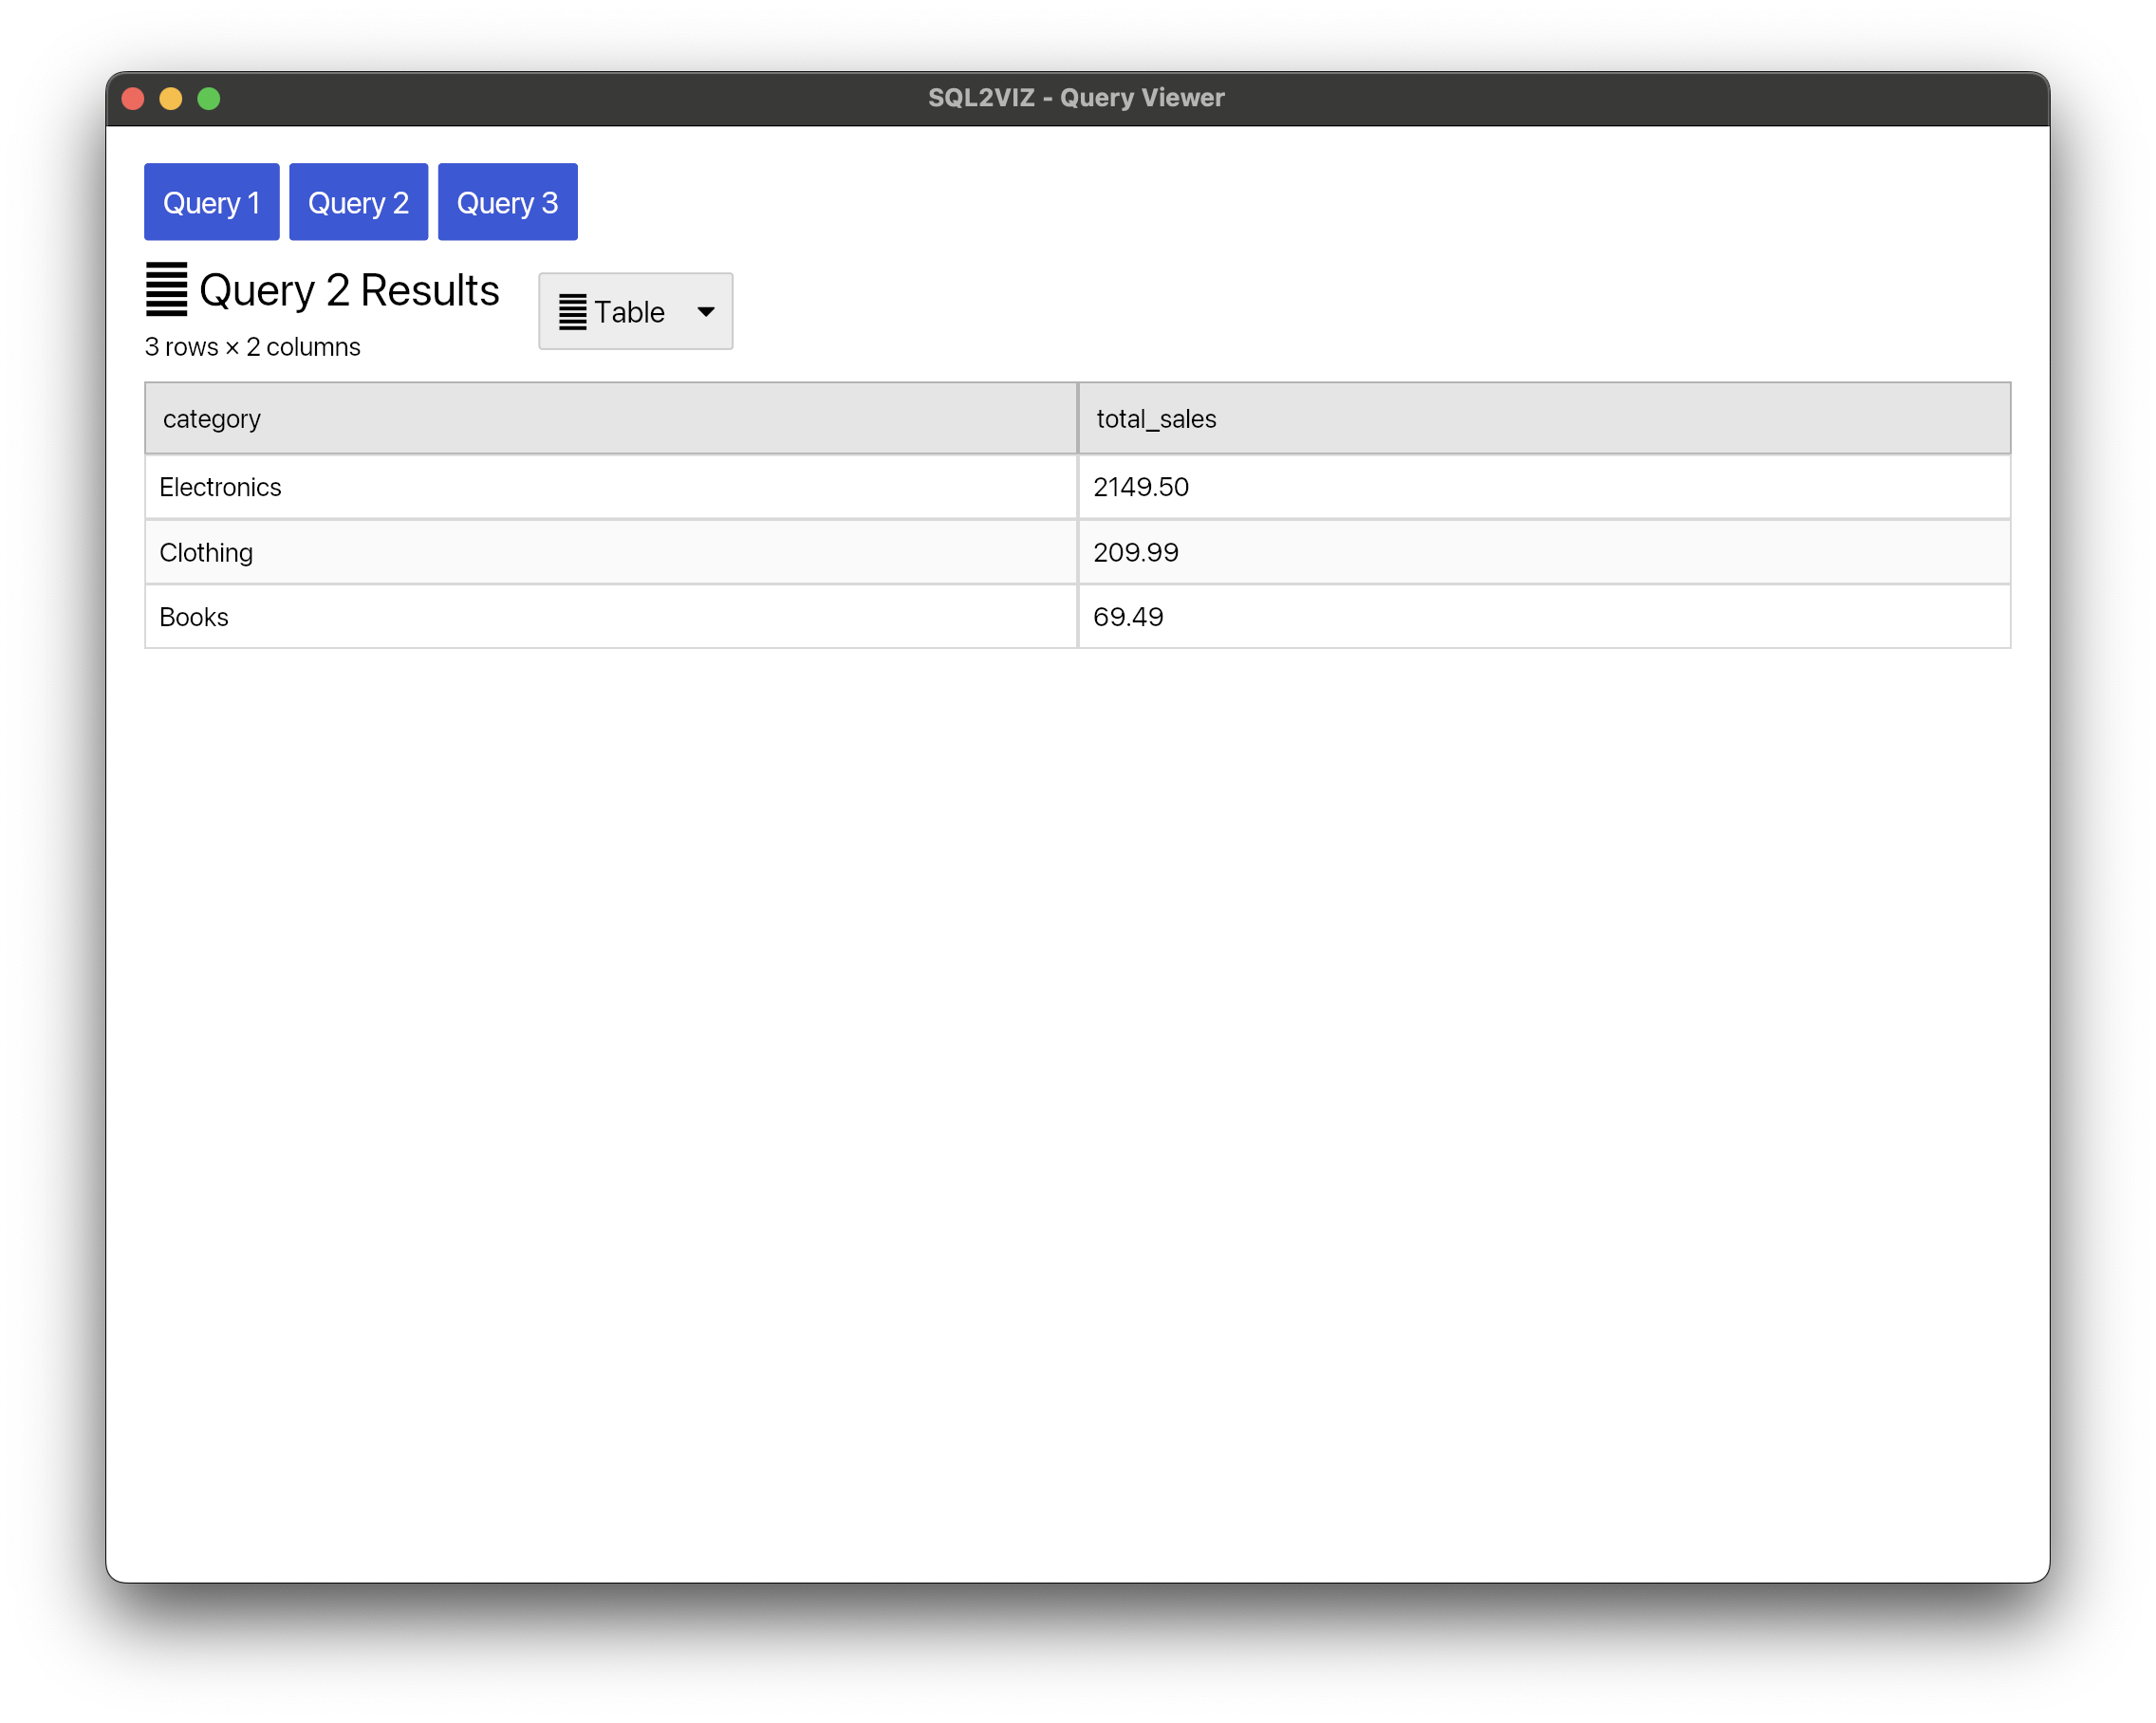

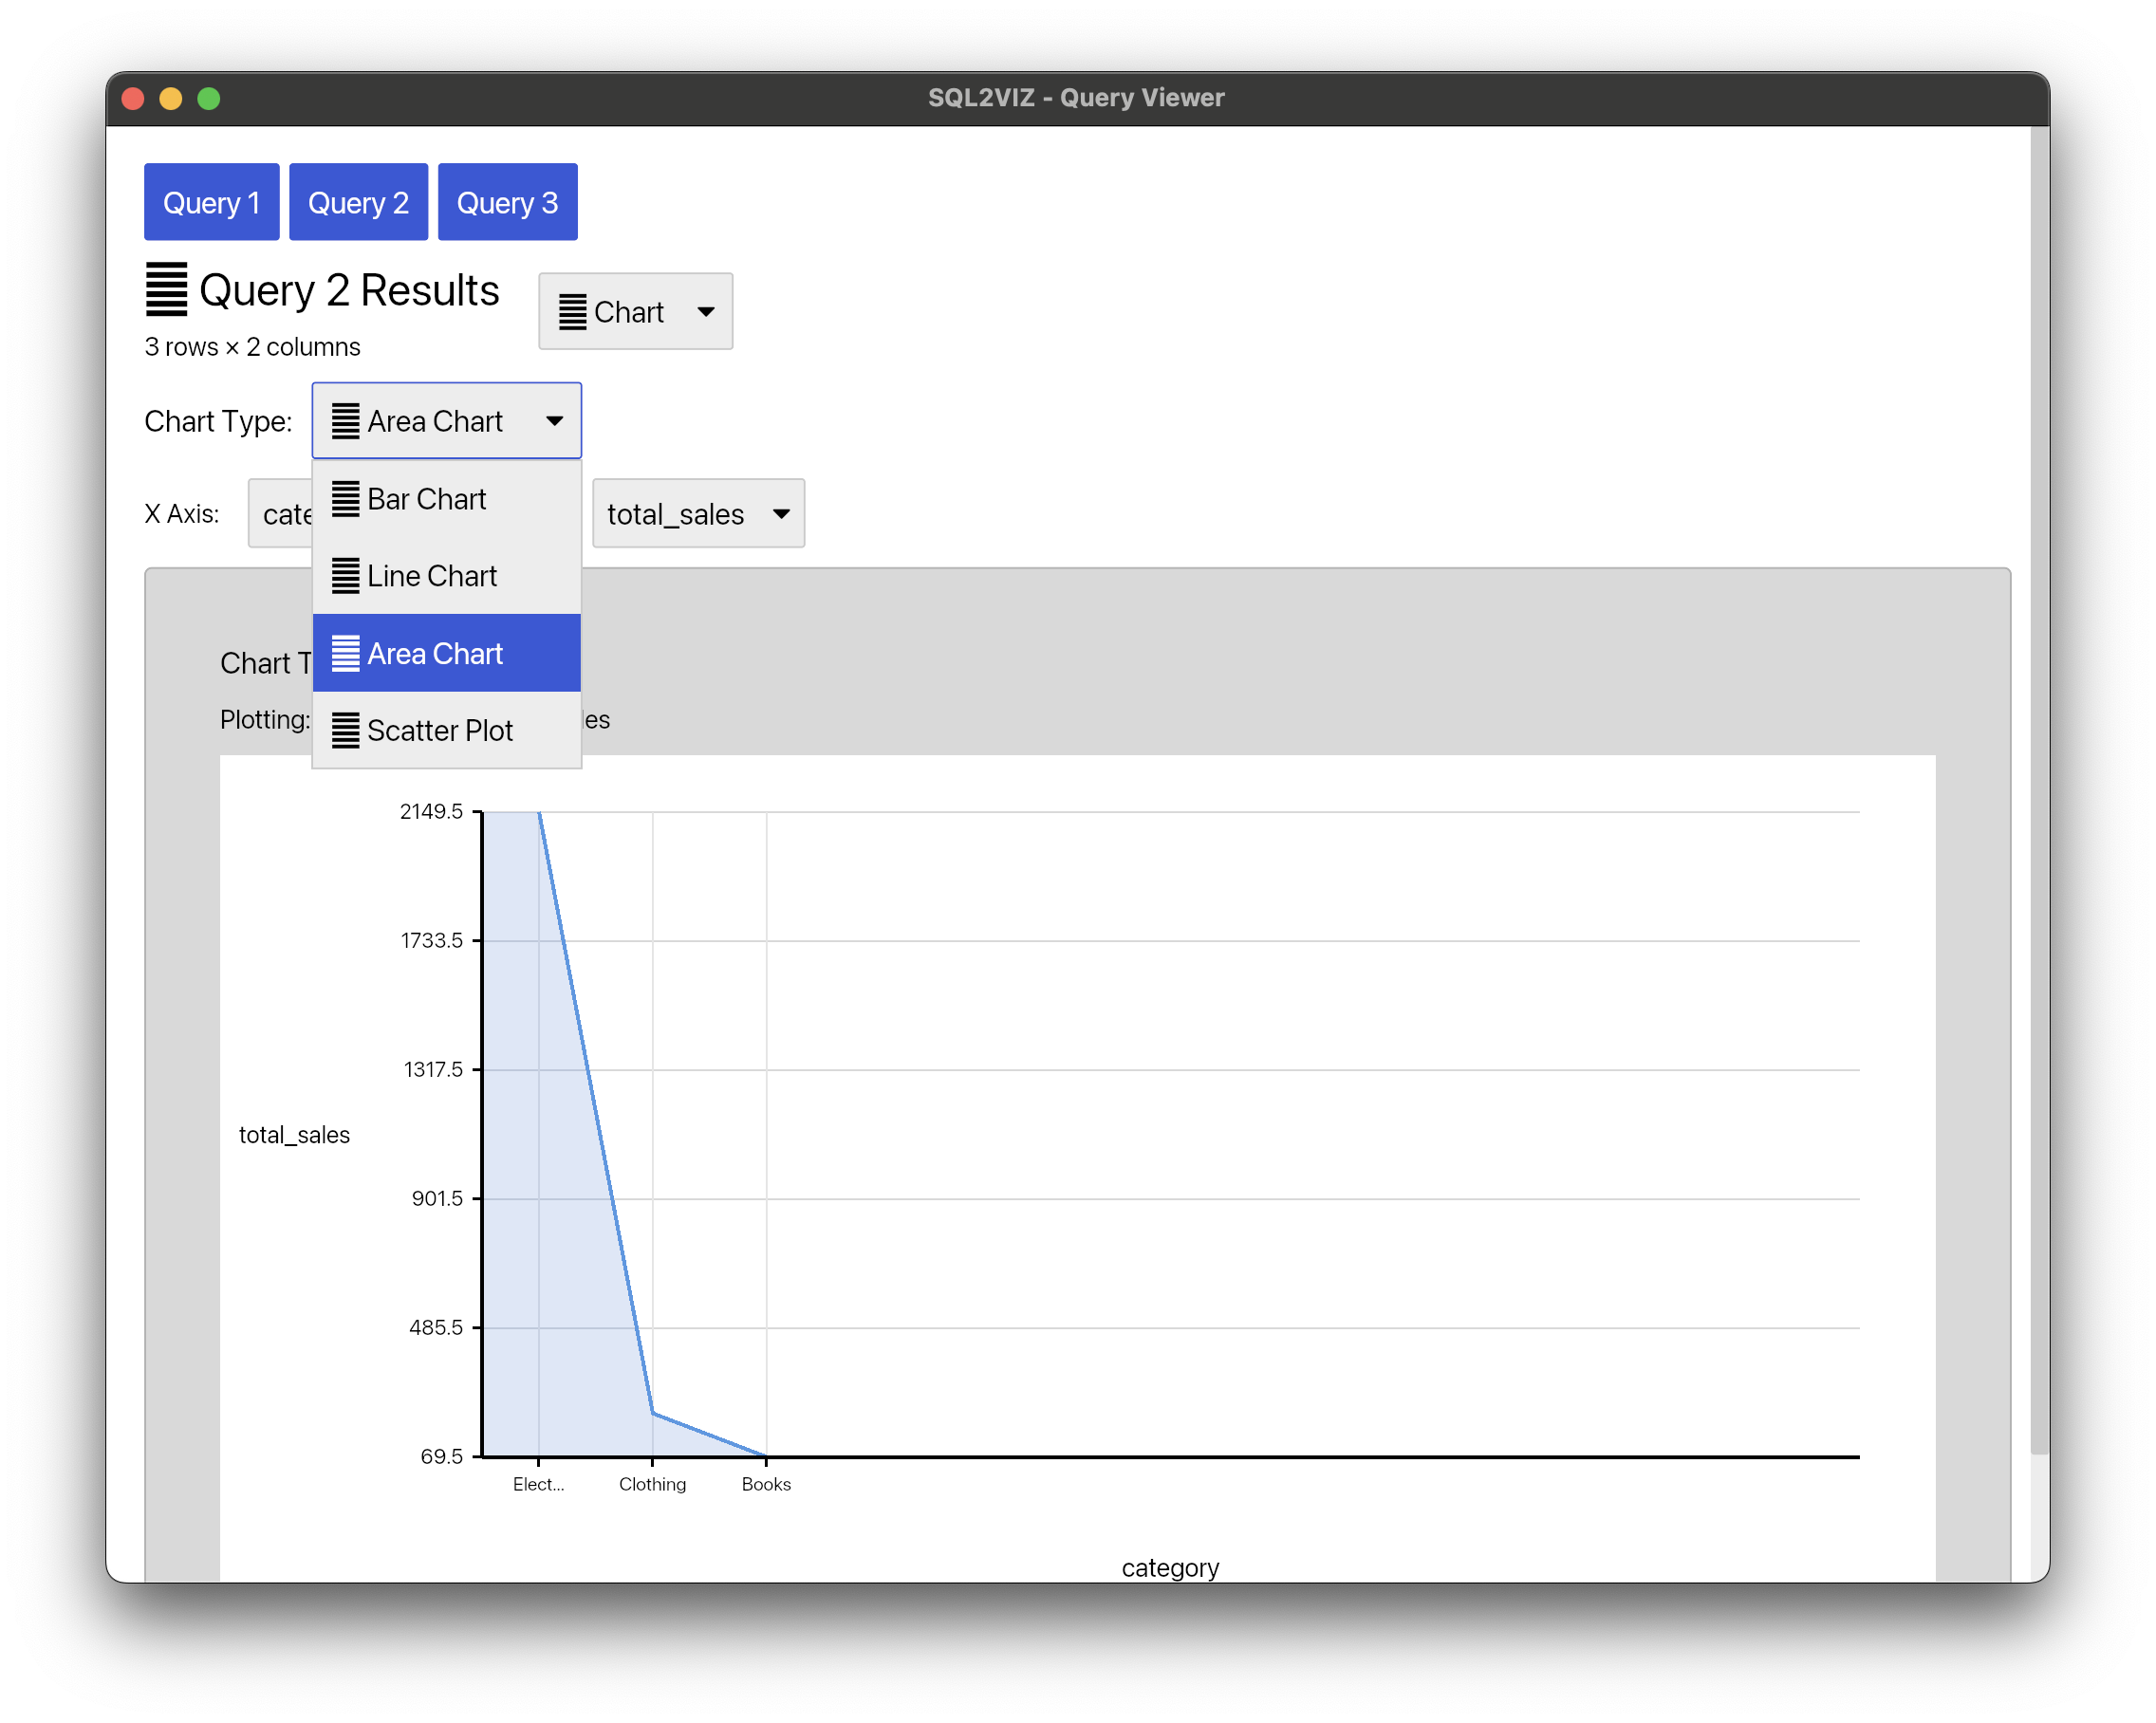
## Features
- SQL query execution with DuckDB
- Interactive charts (Bar, Line, Area, Scatter)
- Table view
- Column selection for chart axes
## License
MIT OR Apache-2.0