# Rust: library for frequency spectrum analysis using FFT
A simple and fast `no_std` library to get the frequency spectrum of a digital signal (e.g. audio) using FFT.
It follows the KISS principle and consists of simple building blocks/optional features.
**I'm not an expert on digital signal processing. Code contributions are highly welcome! :)**
## How to use
```rust
use spectrum_analyzer::{samples_fft_to_spectrum, FrequencyLimit};
use spectrum_analyzer::windows::hann_window;
fn main() {
// This lib also works in `no_std` environments!
let samples: &[f32] = get_samples(); // TODO implement
// apply hann window for smoothing; length must be a power of 2 for the FFT
let hann_window = hann_window(&samples[0..4096]);
// calc spectrum
let spectrum_hann_window = samples_fft_to_spectrum(
// (windowed) samples
&hann_window,
// sample rate
44100,
// optional frequency limit: e.g. only interested in frequencies 50 <= f <= 150?
FrequencyLimit::All,
// optional per element scaling function, e.g. `20 * log10(x)`; see doc comments
None,
// optional total scaling at the end; see doc comments
None,
);
for (fr, fr_val) in spectrum_hamming_window.raw_data().iter() {
println!("{}Hz => {}", fr, fr_val)
}
}
```
### How to scale values
```rust
// e.g. like this
fn get_scale_to_one_fn_factory() -> SpectrumTotalScaleFunctionFactory{
Box::new(
move |min: f32, max: f32, average: f32, median: f32| {
Box::new(
move |x| x/max
)
}
)
}
fn main() {
// ...
let spectrum_hann_window = samples_fft_to_spectrum(
&hann_window,
44100,
FrequencyLimit::All,
None,
// optional total scaling at the end; see doc comments
Some(get_scale_to_one_fn_factory()),
);
}
```
## Performance
*Measurements taken on i7-8650U @ 3 Ghz (Single-Core) with optimized build*
| Hann Window with 4096 samples | ≈70µs |
| Hamming Window with 4096 samples | ≈10µs |
| Hann Window with 16384 samples | ≈175µs |
| Hamming Window with 16384 samples | ≈44µs |
| FFT to spectrum with 4096 samples @ 44100Hz | ≈240µs |
| FFT to spectrum with 16384 samples @ 44100Hz | ≈740µs |
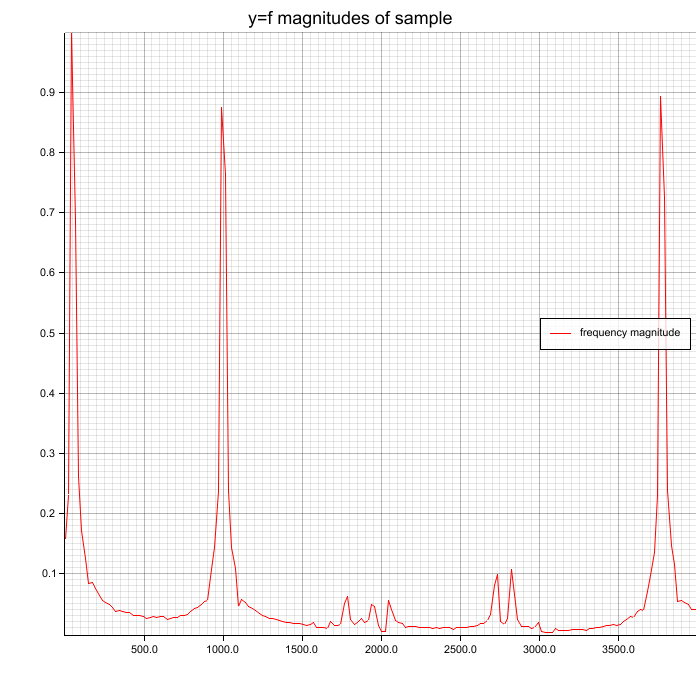
## Example visualization
In the following example you can see a basic visualization of frequencies `0 to 4000Hz` for
a layered signal of sine waves of `50`, `1000`, and `3777Hz` @ `41000Hz` sample rate. The peaks for the
given frequencies are clearly visible. Each calculation was done with `2048` samples, i.e. ≈46ms.
**The noise (wrong peaks) also comes from clipping of the added sine waves!**
### Spectrum without window function on samples
Peaks (50, 1000, 3777 Hz) are clearly visible but also some noise.
 are clearly visible but also some noise.")
### Hann window function on samples before FFT
Peaks (50, 1000, 3777 Hz) are clearly visible and Hann window reduces noise a little bit. Because this example has few noise, you don't see much difference.
 are clearly visible and Hann window reduces noise a little bit. Because this example has few noise, you don't see much difference.")
### Hamming window function on samples before FFT
Peaks (50, 1000, 3777 Hz) are clearly visible and Hamming window reduces noise a little bit. Because this example has few noise, you don't see much difference.
 are clearly visible and Hamming window reduces noise a little bit. Because this example has few noise, you don't see much difference.")
## Trivia / FAQ
### Why f64 and no f32?
I tested f64 but the additional accuracy doesn't pay out the ~40% calculation overhead (on x86_64).
### What can I do against the noise?
Apply a window function, like Hann window or Hamming window. But I'm not an expert on this.