# siplot
**silx-style scientific plotting for [egui](https://github.com/emilk/egui), rendered with [wgpu](https://github.com/gfx-rs/wgpu).**
`siplot` is a Rust port of [silx](https://www.silx.org/)'s `silx.gui.plot`
scientific plotting toolkit, rebuilt as an immediate-mode egui widget with a
wgpu data layer. It pairs GPU-rendered data items (colormapped images,
polyline curves, scatter clouds, triangle meshes) with egui-drawn chrome
(frame, grid, ticks, labels, colorbar, legend) under one shared coordinate
transform.
> **Status:** early release (`0.1.0`). The API still moves between releases.
> Parity with `silx.gui.plot` is tracked in
> [`doc/parity-roadmap.md`](doc/parity-roadmap.md).
License: MIT OR Apache-2.0.
---
## Gallery
A few of the high-level widgets, captured headlessly from the matching
`high_level_*` examples. Each image is rendered to an offscreen wgpu texture
by [`examples/gallery.rs`](examples/gallery.rs) — full egui chrome plus the
`egui_wgpu` data layer, no window — so the gallery can be regenerated with
`cargo run --example gallery`.
| 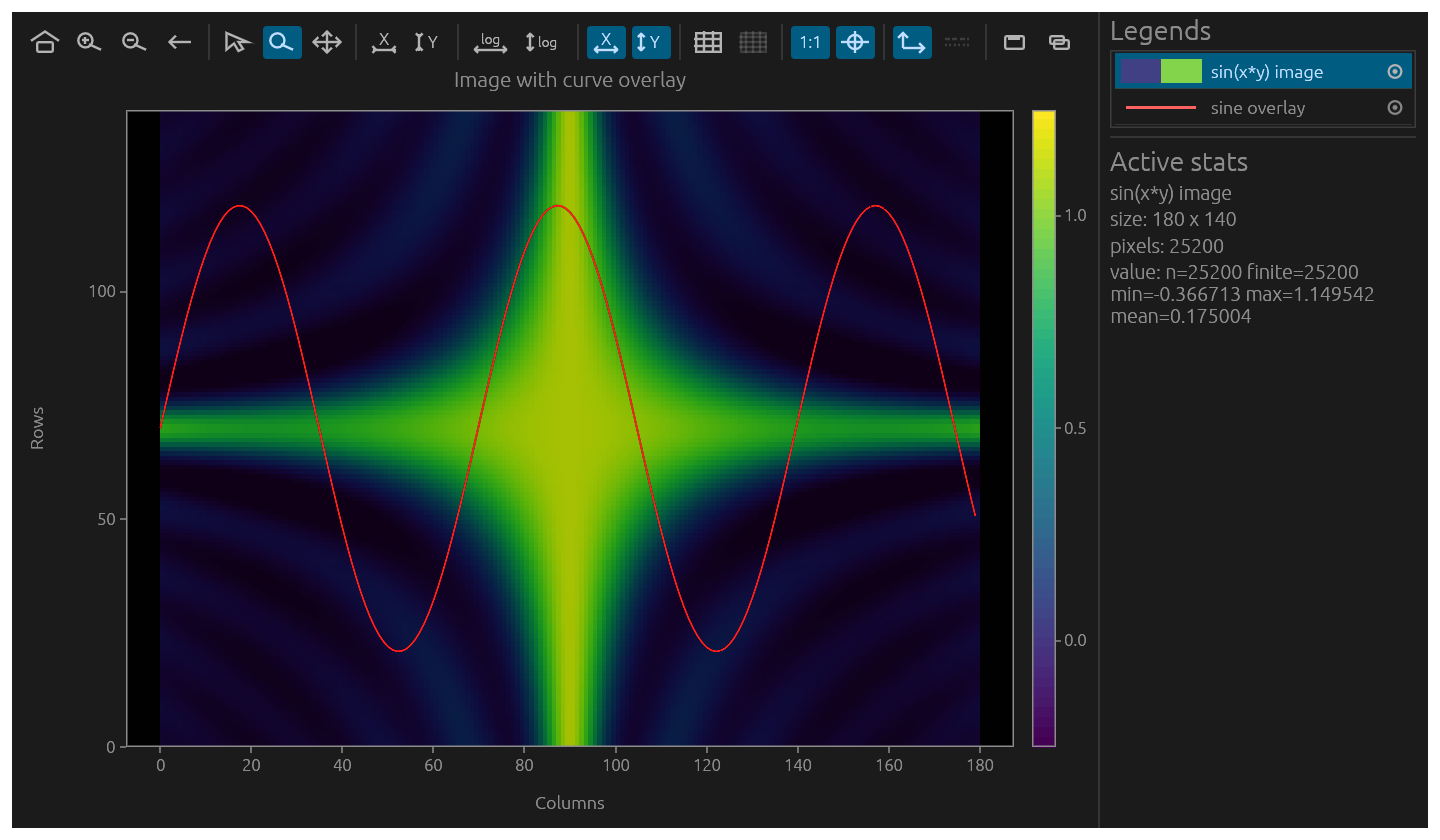 | 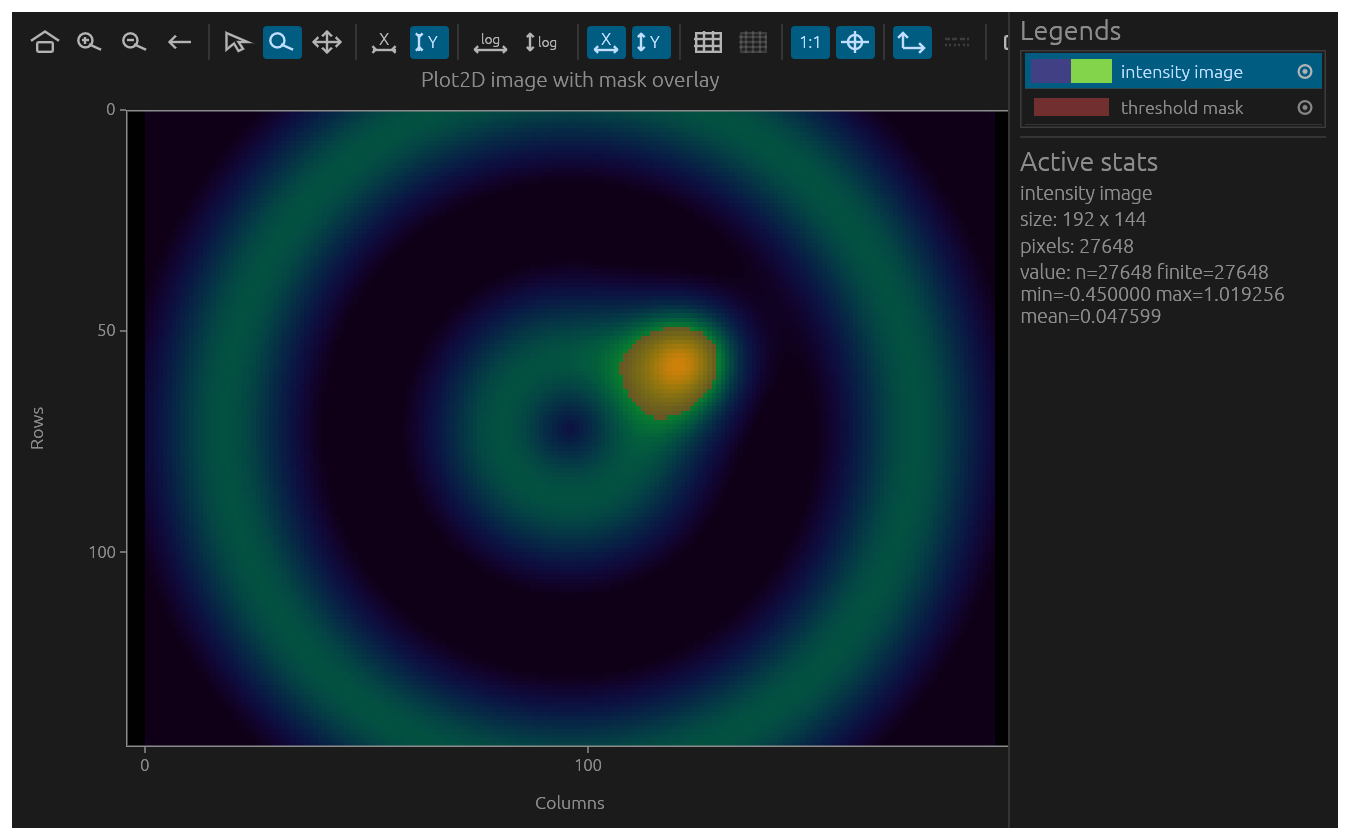 |
| **PlotWidget** — colormapped image with a curve overlay, legend, and active-item stats | **Plot2D** — an image with a threshold mask overlay |
| 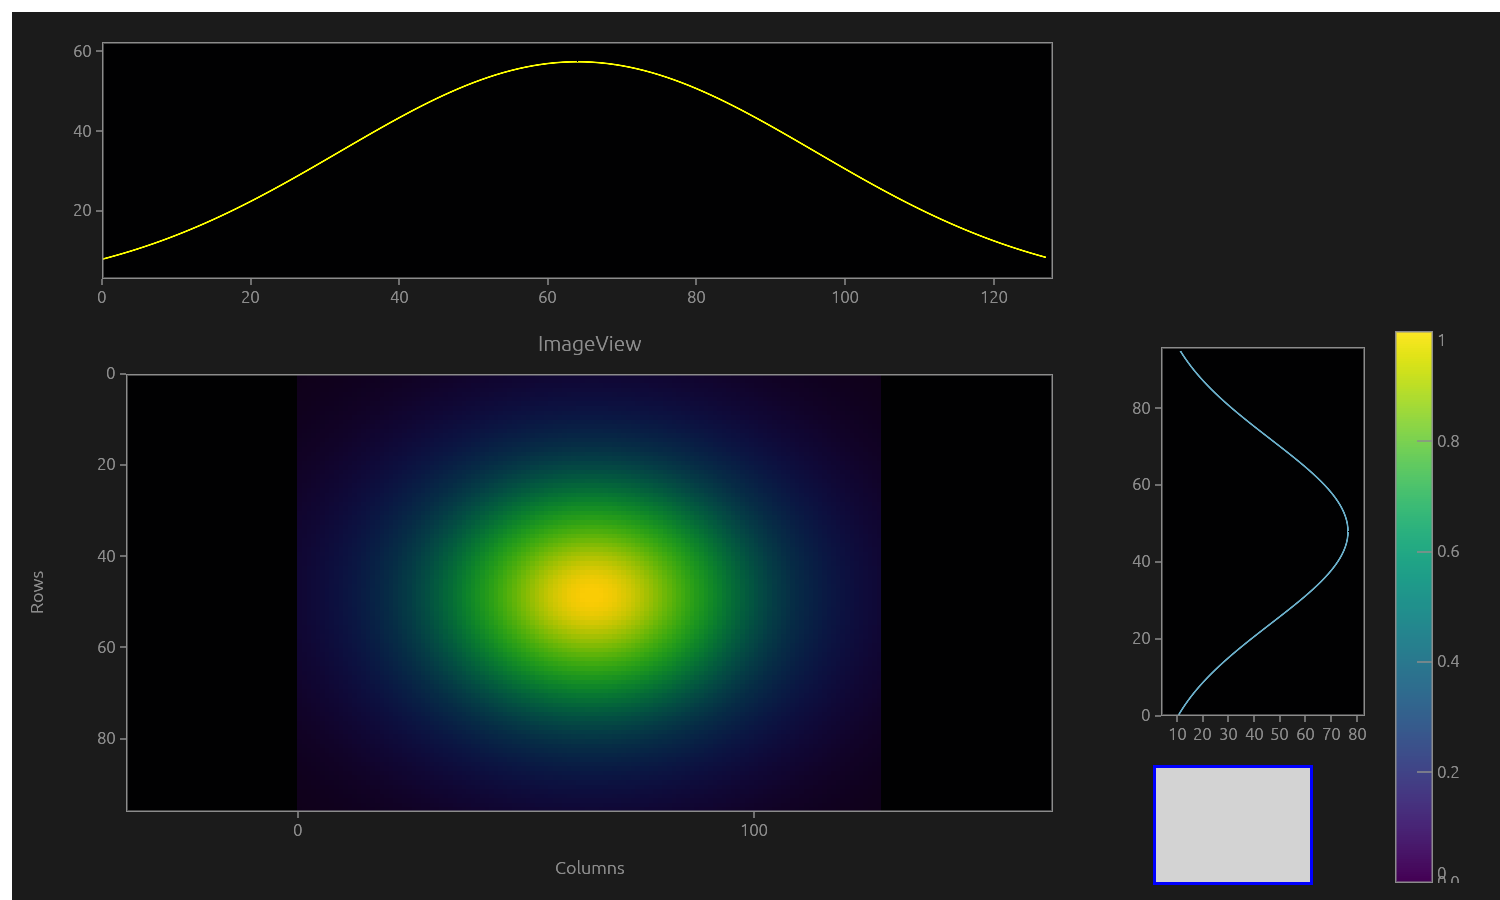 |  |
| **ImageView** — a central image with column/row side-profile histograms | **ScatterView** — value-coloured scatter with a colorbar |
| 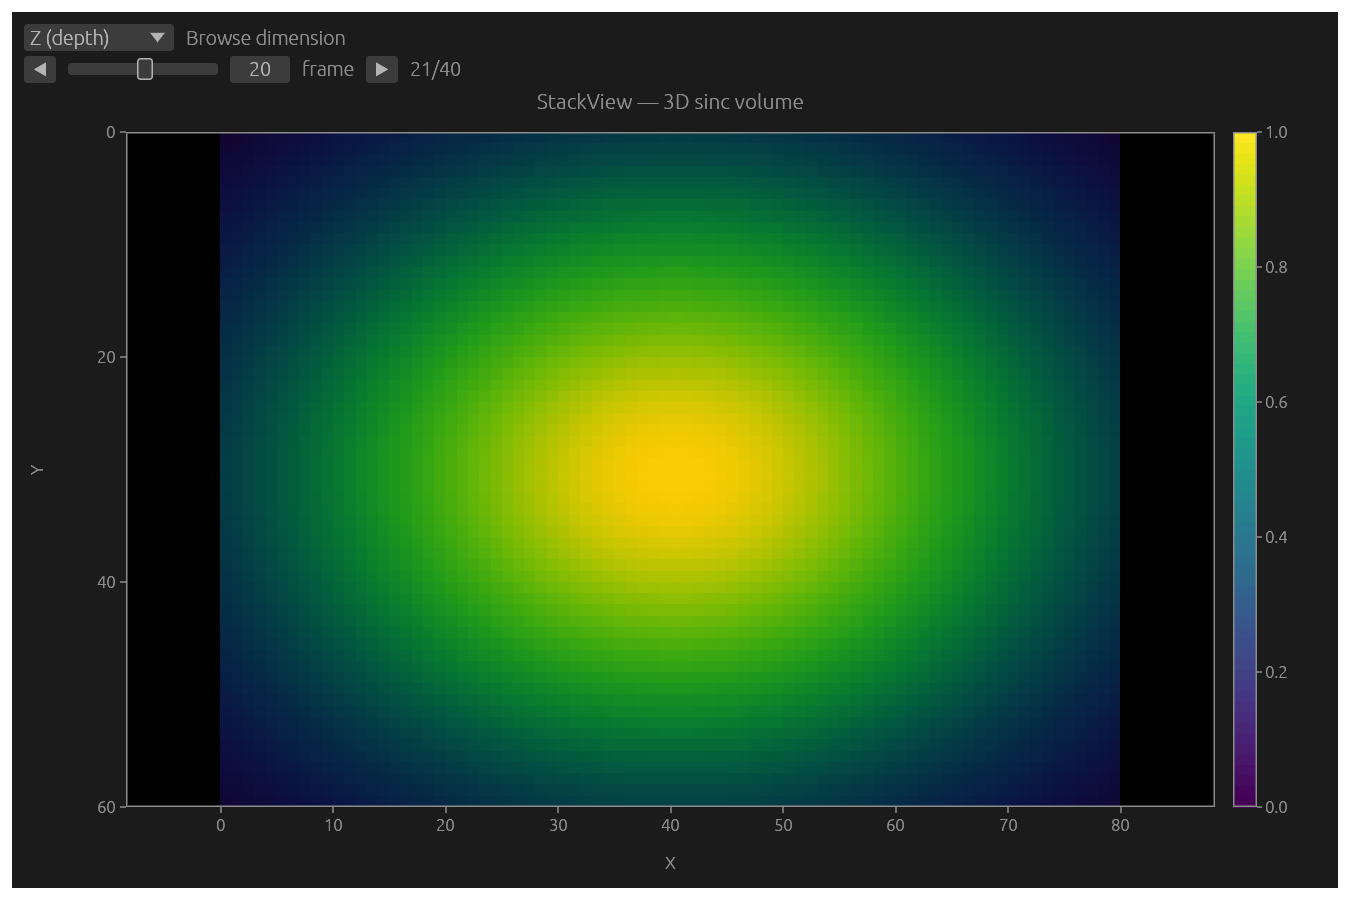 |  |
| **StackView** — a 3D volume browsed as 2D frames, with perspective selection | **CompareImages** — half-split A vs B comparison |
|  |  |
| **FitWidget** — an iterative Gaussian curve fit with parameter errors | **ROI manager** — styled, named ROIs rendered on the plot |
---
## Highlights
- **Curves** — line styles, point symbols, fill/baseline bands, error bars
(symmetric / asymmetric / per-point), a secondary (right) Y axis, log axes,
and min/max decimation for large series.
- **Images** — colormapped scalar images and direct RGBA, with origin/scale
placement, per-pixel alpha, GPU tiling for very large images, and 8 built-in
colormaps under linear / log / sqrt / gamma normalization, plus a colorbar.
- **Markers & shapes** — point/vline/hline markers (draggable, with text
anchors and constraints) and polygon / rectangle / polyline / hline / vline
shapes with fill and dashed outlines.
- **Regions of interest** — create and edit ROIs directly on the plot, a ROI
manager with per-instance color / name / selection / line style / fill, and
ROI statistics (image pixel stats and per-curve raw/net counts & area).
- **Interaction** — pan, box-zoom, zoom history, select, crosshair cursor,
point picking, and an X/Y position-info readout bar.
- **Tools & dialogs** — colormap dialog, image and scatter mask tools, an
iterative curve-fit widget (Gaussian / Lorentzian / Pseudo-Voigt / linear),
statistics widget, limits editor, item-selection dialog, profile tools, and
pixel-intensity histograms.
- **Composite views** — `ImageView` (side histograms + radar overview),
`ScatterView` (value-coloured points, selection mask, X/Y/Data/Index
readout), `StackView` (3D volume browsing with perspective selection,
transposition, and per-dimension axis labels), `CompareImages`
(A / B / split / subtract), `ComplexImageView`, and `ImageStack`.
- **Export** — save the figure to PNG / PPM / SVG / TIFF (with a native save
dialog), copy to the clipboard, or send to the system printer.
- **Multi-plot** — link axes across panels with `SyncAxes`.
## Architecture
The crate mirrors silx's `BackendBase ↔ BackendPygfx` split across three layers:
| `core` | The `Plot` model, the `Backend` trait, and shared types (`Transform`, `Colormap`, `Roi`, `Marker`, …). |
| `render` | The wgpu renderer — an `egui_wgpu::CallbackTrait` implementation that owns the GPU resources. |
| `widget` | High-level retained widgets plus `PlotView` for chrome, interaction, and paint-callback registration. |
There are two API layers:
- **`PlotView`** — stateless chrome and interaction wrapped around a `Plot`
model; you drive GPU item uploads directly.
- **`PlotWidget` / `PlotWindow` / `Plot1D` / `Plot2D`** and the composite views
— retained widgets that own a `WgpuBackend`, item handles, labels, limits,
legend metadata, item statistics, events, and toolbar helpers.
## Requirements
- A recent Rust toolchain (edition 2024; `rust-version = 1.92`).
- An egui application running on the **wgpu** renderer — `siplot` renders
through an `egui_wgpu` paint callback and needs the wgpu `RenderState`.
- egui / egui-wgpu **0.34**. `siplot` re-exports `egui` and `egui_wgpu`
(`siplot::egui`, `siplot::egui_wgpu`) so downstreams can stay on the same
versions without skew.
## Quick start
With [`eframe`](https://github.com/emilk/egui/tree/master/crates/eframe) on the
wgpu renderer:
```rust
use eframe::egui;
use siplot::{Plot1D, PlotWidget};
struct DemoApp {
plot: Plot1D,
}
impl DemoApp {
fn new(cc: &eframe::CreationContext<'_>) -> Self {
// The wgpu render state is only present on the wgpu renderer.
let rs = cc
.wgpu_render_state
.as_ref()
.expect("eframe must use the wgpu renderer (NativeOptions.renderer = Wgpu)");
let mut plot = Plot1D::new(rs, 0);
plot.set_graph_title("siplot demo");
let x: Vec<f64> = (0..400).map(|i| i as f64 * 0.025).collect();
let y: Vec<f64> = x.iter().map(|v| v.sin()).collect();
plot.add_curve_with_legend(&x, &y, egui::Color32::LIGHT_BLUE, "sin");
Self { plot }
}
}
impl eframe::App for DemoApp {
fn ui(&mut self, ui: &mut egui::Ui, _frame: &mut eframe::Frame) {
egui::CentralPanel::default().show_inside(ui, |ui| {
self.plot.show_toolbar(ui);
self.plot.show(ui);
});
}
}
fn main() -> eframe::Result {
eframe::run_native(
"siplot demo",
eframe::NativeOptions {
renderer: eframe::Renderer::Wgpu,
..Default::default()
},
Box::new(|cc| Ok(Box::new(DemoApp::new(cc)) as Box<dyn eframe::App>)),
)
}
```
## Choosing a widget
| `PlotWidget` / `PlotWindow` | The general silx-style item API (curves, images, markers, shapes, ROIs). |
| `Plot1D` | Curve-first views (X/Y labels + major grid by default). |
| `Plot2D` | Image-first views (kept data aspect ratio, colorbar). |
| `ImageView` | A central image with column-sum / row-sum side histograms and a radar overview. |
| `ScatterView` | Value-coloured scatter with a colorbar, selection mask, and position-info panel. |
| `StackView` | A 3D volume browsed as 2D frames, with perspective selection and per-dimension labels. |
| `CompareImages` | Compare two images (A / B / half-half split / A−B subtract). |
| `ComplexImageView` | Complex-valued images (amplitude / phase / real / imaginary …). |
| `ImageStack` | A lazy frame browser over a stack of images. |
`PlotView` remains available when you want direct control over GPU item uploads
around a bare `Plot` model.
## Examples
The repository ships 60 runnable examples. Run any of them with:
```sh
cargo run --example <name>
```
The `high_level_*` examples deliberately mirror common silx examples from
`silx/examples/`. A few starting points:
| `cargo run --example bootstrap` | A minimal empty `PlotView` in an eframe window. |
| `cargo run --example high_level_plot_widget` | Toolbar, image, scatter, histogram, legend, active-item stats. |
| `cargo run --example high_level_plot2d` | Image display, mask overlay, row/column profile extraction. |
| `cargo run --example high_level_image_view` | `ImageView` with side histograms. |
| `cargo run --example high_level_scatter_view` | `ScatterView` value-coloured scatter + X/Y/Data/Index readout. |
| `cargo run --example high_level_stack_view` | `StackView` 3D volume browsing with a perspective selector. |
| `cargo run --example high_level_compare_images` | `CompareImages` A / B / split / subtract modes. |
| `cargo run --example high_level_fit_widget` | Iterative curve fitting (Gaussian / Lorentzian / Pseudo-Voigt). |
| `cargo run --example high_level_roi_manager` | Styled, named, selectable ROIs on the plot. |
| `cargo run --example high_level_colormap_dialog` | Runtime colormap / vmin / vmax / normalization picker. |
See [`doc/high-level-api.md`](doc/high-level-api.md) for the full silx-example
mapping.
## Documentation
- [`doc/design.md`](doc/design.md) — architecture and design notes.
- [`doc/high-level-api.md`](doc/high-level-api.md) — the high-level widget API
and its mapping to silx examples.
- [`doc/parity-roadmap.md`](doc/parity-roadmap.md) — feature-by-feature parity
tracking against `silx.gui.plot`.
## Relationship to silx
`siplot` ports `silx.gui.plot` (and adjacent `silx.gui` features) to Rust,
following the upstream behaviour to fine UX detail. silx itself is the
reference; throughout the code and docs, bare `silx` refers to the upstream
Python project, not to this crate.
## License
Licensed under either of
- Apache License, Version 2.0
- MIT license
at your option.