# Simple Chart
This repository contains stuff to represent iterator of (T, T), that is
convertable to (f64,f64), as line chart in bmp format.
[](https://travis-ci.org/serejkaaa512/simple-chart)
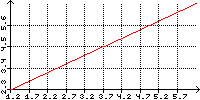
## Example 1. One serie and auto calculated axis returned as `Vec<u8>`:
```rust
let mut chart = Chart::new(200, 100, "#ffffff", "#000000")
.unwrap();
let v: Vec<_> = vec![(1.2,2.3), (3.4, 4.5), (5.6, 6.7)];
let serie = Serie::new(v.into_iter(), "#ff0000").unwrap();
let series = vec![serie];
let bmp = chart.draw(series.into_iter());
```

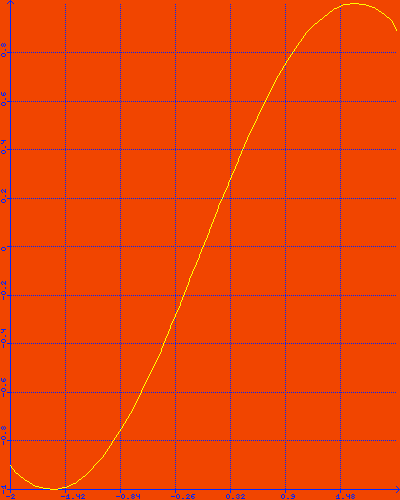
## Example 2. One serie, calculated from included macros formula!,
and manual setted axis x:
```rust
let mut chart = Chart::new(400, 500, "#f14500", "#0027ff")
.unwrap()
.add_axis_x(Axis::new(-2.0, 2.0, 7, 2));
let v = formula!(y(x) = x.sin(), x = [-3.14, 3.14; 0.1]);
let serie = Serie::new(v.into_iter(), "#ffff00").unwrap();
let series = vec![serie];
let bmp = chart.draw(series.into_iter());
```

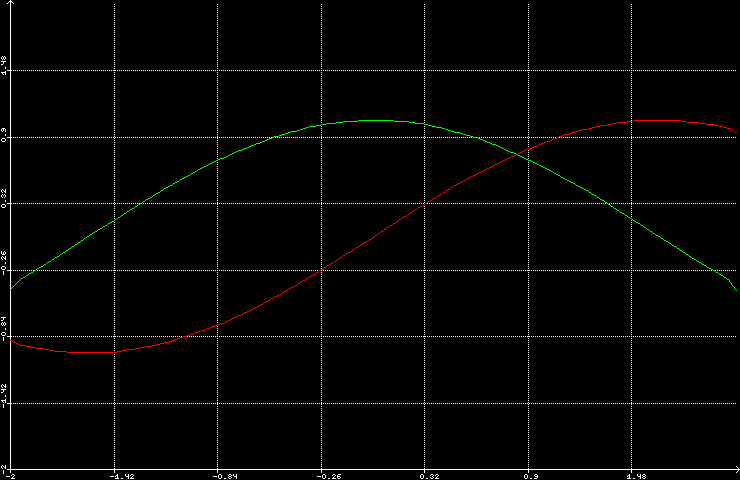
## Example 3. Two series and manual setted axis x and y:
```rust
let mut chart = Chart::new(740, 480, "#000000", "#ffffff")
.unwrap()
.add_axis_x(Axis::new(-2.0, 2.0, 7, 2))
.add_axis_y(Axis::new(-2.0, 2.0, 7, 2));
let v1 = formula!(y(x) = x.sin(), x = [-3.14, 3.14; 0.1]);
let v2 = formula!(y(x) = x.cos(), x = [-3.14, 3.14; 0.1]);
let serie1 = Serie::new(v1.into_iter(), "#ff0000").unwrap();
let serie2 = Serie::new(v2.into_iter(), "#00ff00").unwrap();
let series = vec![serie1, serie2];
let bmp = chart.draw(series.into_iter());
```

## Usage
Put this in your `Cargo.toml`:
```toml
[dependencies]
simple-chart = "*"
```
And this in your crate root:
```rust
extern crate simple_chart;
use simple_chart::{Chart, Serie, Axis, Point};
```
## Resources
- [Full `simple-chart` documentation](http://serejkaaa512.github.io/simple-chart)
## License
MIT