1
2
3
4
5
6
7
8
9
10
11
12
13
14
15
16
17
18
19
20
21
22
23
24
25
26
27
28
29
30
31
32
33
34
35
36
37
38
39
40
41
42
43
44
45
46
47
48
49
50
51
52
53
54
55
56
57
58
59
60
61
62
63
64
65
66
67
68
69
70
71
72
73
74
75
76
77
78
79
80
81
82
83
84
85
86
87
88
89
90
91
92
93
94
95
96
97
98
99
100
101
102
103
104
105
106
107
108
109
110
111
112
113
114
115
116
117
118
119
120
121
122
123
124
125
126
127
128
129
130
131
132
133
134
135
136
137
138
139
140
141
142
143
144
145
146
147
148
149
150
151
152
153
154
155
156
157
158
159
160
161
162
163
164
165
166
167
168
169
170
171
172
173
174
175
176
177
178
179
180
181
182
183
184
185
186
187
188
189
190
191
192
193
194
195
196
197
198
199
200
201
202
203
204
205
206
207
208
209
210
211
212
213
214
215
216
217
218
219
220
221
222
223
224
225
226
227
228
229
230
231
232
233
234
235
236
237
238
239
240
241
242
243
244
245
246
247
248
249
250
251
252
253
254
255
256
257
258
259
260
261
262
263
264
265
266
267
268
269
270
271
272
273
274
275
276
277
278
279
280
281
282
283
284
285
286
287
288
289
290
291
292
293
294
295
296
297
298
299
300
301
302
303
304
305
306
307
308
309
310
311
312
313
314
315
316
317
318
319
320
321
322
323
324
325
326
327
328
329
330
331
332
333
334
335
336
337
338
339
340
341
342
343
344
345
346
347
348
349
350
351
352
353
354
355
356
357
358
359
360
361
362
363
364
365
366
367
368
369
370
371
372
373
374
375
376
377
378
379
380
381
382
383
384
385
386
387
388
389
390
391
392
393
394
395
396
397
398
399
400
401
402
403
404
405
406
407
408
409
410
411
412
413
414
415
416
417
418
419
420
421
422
423
424
425
426
427
428
429
430
431
432
433
434
435
436
437
438
439
440
441
442
443
444
445
446
447
448
449
450
451
452
453
454
455
456
457
458
459
460
461
462
463
464
465
466
467
468
469
470
471
472
473
474
475
476
477
478
479
480
481
482
483
484
485
486
487
488
489
490
491
492
493
494
495
496
497
498
499
500
501
502
503
504
505
506
507
508
509
510
511
512
513
514
515
516
517
518
519
520
521
522
523
524
525
526
527
528
529
530
531
532
533
534
535
536
537
538
539
540
541
542
543
544
545
546
547
548
549
550
551
552
553
554
555
556
557
558
559
560
561
562
563
564
565
566
567
568
569
570
571
572
573
574
575
576
577
578
579
580
581
582
583
584
585
586
587
588
589
590
591
592
593
594
595
596
597
598
599
600
601
602
603
604
605
606
607
608
609
610
611
612
613
614
615
616
617
618
619
620
621
622
623
624
625
626
627
628
629
630
631
632
633
634
635
636
637
638
639
640
641
642
643
644
645
646
647
648
649
650
651
652
653
654
655
656
657
658
659
660
661
662
663
664
665
666
667
668
669
670
671
672
673
674
675
676
677
678
679
680
681
682
683
684
685
686
687
688
689
690
691
692
693
694
695
696
697
698
699
700
701
702
703
704
705
706
707
708
709
710
711
712
713
714
715
716
717
718
719
720
721
722
723
724
725
726
727
728
729
730
731
732
733
734
735
736
737
738
739
740
741
742
743
744
745
746
747
748
749
750
751
752
753
754
755
756
757
758
759
760
761
762
763
764
765
766
767
768
769
770
771
772
773
774
775
776
777
778
779
780
781
782
783
784
785
786
787
788
789
790
791
792
793
794
795
796
797
798
799
800
801
802
803
804
805
806
807
808
809
810
811
812
813
814
815
816
817
818
819
820
821
822
823
824
825
826
827
828
829
830
831
832
833
834
835
836
837
838
839
840
841
842
843
844
845
846
847
848
849
850
851
852
853
854
855
856
857
858
859
860
861
862
863
864
865
866
867
868
869
870
871
872
873
874
875
876
877
878
879
880
881
882
883
884
885
886
887
888
889
890
891
892
893
894
895
896
897
898
899
900
901
902
903
904
905
906
907
908
909
910
911
912
913
914
915
916
917
918
919
920
921
922
923
924
925
926
927
928
929
930
931
932
933
934
935
936
937
938
939
940
941
942
943
944
945
946
947
948
949
950
951
952
953
954
955
956
957
958
959
960
961
962
963
964
965
966
967
968
969
970
971
972
973
974
975
976
977
978
979
980
981
982
983
984
985
986
987
988
989
990
991
992
993
994
995
996
997
998
999
1000
1001
1002
1003
1004
1005
1006
1007
1008
1009
1010
1011
1012
1013
1014
1015
1016
1017
1018
1019
1020
1021
1022
1023
1024
1025
1026
1027
1028
1029
1030
1031
1032
1033
1034
1035
1036
1037
1038
1039
1040
1041
1042
1043
1044
1045
1046
1047
1048
1049
1050
1051
1052
1053
1054
1055
1056
1057
1058
1059
1060
1061
1062
1063
1064
1065
1066
1067
1068
1069
1070
1071
1072
1073
1074
1075
1076
1077
1078
1079
1080
1081
1082
1083
1084
1085
1086
1087
1088
1089
1090
1091
1092
1093
1094
1095
1096
1097
1098
1099
1100
1101
1102
1103
1104
1105
1106
1107
1108
1109
1110
1111
1112
1113
1114
1115
1116
1117
1118
1119
1120
1121
1122
1123
1124
1125
1126
1127
1128
1129
1130
1131
1132
1133
1134
1135
1136
1137
1138
1139
1140
1141
1142
1143
1144
1145
1146
1147
1148
1149
1150
1151
1152
1153
1154
1155
1156
1157
1158
1159
1160
1161
1162
1163
1164
1165
1166
1167
1168
1169
1170
1171
1172
1173
1174
1175
1176
1177
1178
1179
1180
1181
1182
1183
1184
1185
1186
1187
1188
1189
1190
1191
1192
1193
1194
1195
1196
1197
1198
1199
1200
1201
1202
1203
1204
1205
1206
1207
1208
1209
1210
1211
1212
1213
1214
1215
1216
1217
1218
1219
1220
1221
1222
1223
1224
1225
1226
1227
1228
1229
1230
1231
1232
1233
1234
1235
1236
1237
1238
1239
1240
1241
1242
1243
1244
1245
1246
1247
1248
1249
1250
1251
1252
1253
1254
1255
1256
1257
1258
1259
1260
1261
1262
1263
1264
1265
1266
1267
1268
1269
1270
1271
1272
1273
1274
1275
1276
1277
1278
1279
1280
1281
1282
1283
1284
1285
1286
1287
1288
1289
1290
1291
1292
1293
1294
1295
1296
1297
1298
1299
1300
1301
1302
1303
1304
1305
1306
1307
1308
1309
1310
1311
1312
1313
1314
1315
1316
1317
1318
1319
1320
1321
1322
1323
1324
1325
1326
1327
1328
1329
1330
1331
1332
1333
1334
1335
1336
1337
1338
1339
1340
1341
1342
1343
1344
1345
1346
1347
1348
1349
1350
1351
1352
1353
1354
1355
1356
1357
1358
1359
1360
1361
1362
1363
1364
1365
1366
1367
1368
1369
1370
1371
1372
1373
1374
1375
1376
1377
1378
1379
1380
1381
1382
1383
1384
1385
1386
1387
1388
1389
1390
1391
1392
1393
1394
1395
1396
1397
1398
1399
1400
1401
1402
1403
1404
1405
1406
1407
1408
1409
1410
1411
1412
1413
1414
1415
1416
1417
1418
1419
1420
1421
1422
1423
1424
1425
1426
1427
1428
1429
1430
1431
1432
1433
1434
1435
1436
1437
1438
1439
1440
1441
1442
1443
1444
1445
1446
1447
1448
1449
1450
1451
1452
1453
1454
1455
1456
1457
1458
1459
1460
1461
1462
1463
1464
1465
1466
1467
1468
1469
1470
1471
1472
1473
1474
1475
1476
1477
1478
1479
1480
1481
1482
1483
1484
1485
1486
1487
1488
1489
1490
1491
1492
1493
1494
1495
1496
1497
1498
1499
1500
1501
1502
1503
1504
1505
1506
1507
1508
1509
1510
1511
1512
1513
1514
1515
1516
1517
1518
1519
1520
1521
1522
1523
1524
1525
1526
1527
1528
1529
1530
1531
1532
1533
1534
1535
1536
1537
1538
1539
1540
1541
1542
1543
1544
1545
1546
1547
1548
1549
1550
1551
1552
1553
1554
1555
1556
1557
1558
1559
1560
1561
1562
1563
1564
1565
1566
1567
1568
1569
1570
1571
1572
1573
1574
1575
1576
1577
1578
1579
1580
1581
1582
1583
1584
1585
1586
1587
1588
1589
1590
1591
1592
1593
1594
1595
1596
1597
1598
1599
1600
1601
1602
1603
1604
1605
1606
1607
1608
1609
1610
1611
1612
1613
1614
1615
1616
1617
1618
1619
1620
1621
1622
1623
1624
1625
1626
1627
1628
1629
1630
1631
1632
1633
1634
1635
1636
1637
1638
1639
1640
1641
1642
1643
1644
1645
1646
1647
1648
1649
1650
1651
1652
1653
1654
1655
1656
1657
1658
1659
1660
1661
1662
1663
1664
1665
1666
1667
1668
1669
1670
1671
1672
1673
1674
1675
1676
1677
1678
1679
1680
1681
1682
1683
1684
1685
1686
1687
1688
1689
1690
1691
1692
1693
1694
1695
1696
1697
1698
1699
1700
1701
1702
1703
1704
1705
1706
1707
1708
1709
1710
1711
1712
1713
1714
1715
1716
1717
1718
1719
1720
1721
1722
1723
1724
1725
1726
1727
1728
1729
1730
1731
1732
1733
1734
1735
1736
1737
1738
1739
1740
1741
1742
1743
1744
1745
1746
1747
1748
1749
1750
1751
1752
1753
1754
1755
1756
1757
1758
1759
1760
1761
1762
1763
1764
1765
1766
1767
1768
1769
1770
1771
1772
1773
1774
1775
1776
1777
1778
1779
1780
1781
1782
1783
1784
1785
1786
1787
1788
1789
1790
1791
1792
1793
1794
1795
1796
1797
1798
1799
1800
1801
1802
1803
1804
1805
1806
1807
1808
1809
1810
1811
1812
1813
1814
1815
1816
1817
1818
1819
1820
1821
1822
1823
1824
1825
1826
1827
1828
1829
1830
1831
1832
1833
1834
1835
1836
1837
1838
1839
1840
1841
1842
1843
1844
1845
1846
1847
1848
1849
1850
1851
1852
1853
1854
1855
1856
1857
1858
1859
1860
1861
1862
1863
1864
1865
1866
1867
1868
1869
1870
1871
1872
1873
1874
1875
1876
1877
1878
1879
1880
1881
1882
1883
1884
1885
1886
1887
1888
1889
1890
1891
1892
1893
1894
1895
1896
1897
1898
1899
1900
1901
1902
1903
1904
1905
1906
1907
1908
1909
1910
1911
1912
1913
1914
1915
1916
1917
1918
1919
1920
1921
1922
1923
1924
1925
1926
1927
1928
1929
1930
1931
1932
1933
1934
1935
1936
1937
1938
1939
1940
1941
1942
1943
1944
1945
1946
1947
1948
1949
1950
1951
1952
1953
1954
1955
1956
1957
1958
1959
1960
1961
1962
1963
1964
1965
1966
1967
1968
1969
1970
1971
1972
1973
1974
1975
1976
1977
1978
1979
1980
1981
1982
1983
1984
1985
1986
1987
1988
1989
1990
1991
1992
1993
1994
1995
1996
1997
1998
1999
2000
2001
2002
2003
2004
2005
2006
2007
2008
2009
2010
2011
2012
2013
2014
2015
2016
2017
2018
2019
2020
2021
2022
2023
2024
2025
2026
2027
2028
2029
2030
2031
2032
2033
2034
2035
2036
2037
2038
2039
2040
2041
2042
2043
2044
2045
2046
2047
2048
2049
2050
2051
2052
2053
2054
2055
2056
2057
2058
2059
2060
2061
2062
2063
2064
2065
2066
2067
2068
2069
2070
2071
2072
2073
2074
2075
2076
2077
2078
2079
2080
2081
2082
2083
2084
2085
2086
2087
2088
2089
2090
2091
2092
2093
2094
2095
2096
2097
2098
2099
2100
2101
2102
2103
2104
2105
2106
2107
2108
2109
2110
2111
2112
2113
2114
2115
2116
2117
2118
2119
2120
2121
2122
2123
2124
2125
2126
2127
2128
2129
2130
2131
2132
2133
2134
2135
2136
2137
2138
2139
2140
2141
2142
2143
2144
2145
2146
2147
2148
2149
2150
2151
2152
2153
2154
2155
2156
2157
2158
2159
2160
2161
2162
2163
2164
2165
2166
2167
2168
2169
2170
2171
2172
2173
2174
2175
2176
2177
2178
2179
2180
2181
2182
2183
2184
2185
2186
2187
2188
2189
2190
2191
2192
2193
2194
2195
2196
2197
2198
2199
2200
2201
2202
2203
2204
2205
2206
2207
2208
2209
2210
2211
2212
2213
2214
2215
2216
2217
2218
2219
2220
2221
2222
2223
2224
2225
2226
2227
2228
2229
2230
2231
2232
2233
2234
2235
2236
2237
2238
2239
2240
2241
2242
2243
2244
2245
2246
2247
2248
2249
2250
2251
2252
2253
2254
2255
2256
2257
2258
2259
2260
2261
2262
2263
2264
2265
2266
2267
2268
2269
2270
2271
2272
2273
2274
2275
2276
2277
2278
2279
2280
2281
2282
2283
2284
2285
2286
2287
2288
2289
2290
2291
2292
2293
2294
2295
2296
2297
2298
2299
2300
2301
2302
2303
2304
2305
2306
2307
2308
2309
2310
2311
2312
2313
2314
2315
2316
2317
2318
2319
2320
2321
2322
2323
2324
2325
2326
2327
2328
2329
2330
2331
2332
2333
2334
2335
2336
2337
2338
2339
2340
2341
2342
2343
2344
2345
2346
2347
2348
2349
2350
2351
2352
2353
2354
2355
2356
2357
2358
2359
2360
2361
2362
2363
2364
2365
2366
2367
2368
2369
2370
2371
2372
2373
2374
2375
2376
2377
2378
2379
2380
2381
2382
2383
2384
2385
2386
2387
2388
2389
2390
2391
2392
2393
2394
2395
2396
2397
2398
2399
2400
2401
2402
2403
2404
2405
2406
2407
2408
2409
2410
2411
2412
2413
2414
2415
2416
2417
2418
2419
2420
2421
2422
2423
2424
2425
2426
2427
2428
2429
2430
2431
2432
2433
2434
2435
2436
2437
2438
2439
2440
2441
2442
2443
2444
2445
2446
2447
2448
2449
2450
2451
2452
2453
2454
2455
2456
2457
2458
2459
2460
2461
2462
2463
2464
2465
2466
2467
2468
2469
2470
2471
2472
2473
2474
2475
2476
2477
2478
2479
2480
2481
2482
2483
2484
2485
2486
2487
2488
2489
2490
2491
2492
2493
2494
2495
2496
2497
2498
2499
2500
2501
2502
2503
2504
2505
2506
2507
2508
2509
2510
2511
2512
2513
2514
2515
2516
2517
2518
2519
2520
2521
2522
2523
2524
2525
2526
2527
2528
2529
2530
2531
2532
2533
2534
2535
2536
2537
2538
2539
2540
2541
2542
2543
2544
2545
2546
2547
2548
2549
2550
2551
2552
2553
2554
2555
2556
2557
2558
2559
2560
2561
2562
2563
2564
2565
2566
2567
2568
2569
2570
2571
2572
2573
2574
2575
2576
2577
2578
2579
2580
2581
2582
2583
2584
2585
2586
2587
2588
2589
2590
2591
2592
2593
2594
2595
2596
2597
2598
2599
2600
2601
2602
2603
2604
2605
2606
2607
2608
2609
2610
2611
2612
2613
2614
2615
2616
2617
2618
2619
2620
2621
2622
2623
2624
2625
2626
2627
2628
2629
2630
2631
2632
2633
2634
2635
2636
2637
2638
2639
2640
2641
2642
2643
2644
2645
2646
2647
2648
2649
2650
2651
2652
2653
2654
2655
2656
2657
2658
2659
2660
2661
2662
2663
2664
2665
2666
2667
2668
2669
2670
2671
2672
2673
2674
2675
2676
2677
2678
2679
2680
2681
2682
2683
2684
2685
2686
2687
2688
2689
2690
2691
2692
2693
2694
2695
2696
2697
2698
2699
2700
2701
2702
2703
2704
2705
2706
2707
2708
2709
2710
2711
2712
2713
2714
2715
2716
2717
2718
2719
2720
2721
2722
2723
2724
2725
2726
2727
2728
2729
2730
2731
2732
2733
2734
2735
2736
2737
2738
2739
2740
2741
2742
2743
2744
2745
2746
2747
2748
2749
2750
2751
2752
2753
2754
2755
2756
2757
2758
2759
2760
2761
2762
2763
2764
2765
2766
2767
2768
2769
2770
2771
2772
2773
2774
2775
2776
2777
2778
2779
2780
2781
2782
2783
2784
2785
2786
2787
2788
2789
2790
2791
2792
2793
2794
2795
2796
2797
2798
2799
2800
2801
2802
2803
2804
2805
2806
2807
2808
2809
2810
2811
2812
2813
2814
2815
2816
2817
2818
2819
2820
2821
2822
2823
2824
2825
2826
2827
2828
2829
2830
2831
2832
2833
2834
2835
2836
2837
2838
2839
2840
2841
2842
2843
2844
2845
2846
2847
2848
2849
2850
2851
2852
2853
2854
2855
2856
2857
2858
2859
2860
2861
2862
2863
2864
2865
2866
2867
2868
2869
2870
2871
2872
2873
2874
2875
2876
2877
2878
2879
2880
2881
2882
2883
2884
2885
2886
2887
2888
2889
2890
2891
2892
2893
2894
2895
2896
2897
2898
2899
2900
2901
2902
2903
2904
2905
2906
2907
2908
2909
2910
2911
2912
2913
2914
2915
2916
2917
2918
2919
2920
2921
2922
2923
2924
2925
2926
2927
2928
2929
2930
2931
2932
2933
2934
2935
2936
2937
2938
2939
2940
2941
2942
2943
2944
2945
2946
2947
2948
2949
2950
2951
2952
2953
2954
2955
2956
2957
2958
2959
2960
2961
2962
2963
2964
2965
2966
2967
2968
2969
2970
2971
2972
2973
2974
2975
2976
2977
2978
2979
2980
2981
2982
2983
2984
2985
2986
2987
2988
2989
2990
2991
2992
2993
2994
2995
2996
2997
2998
2999
3000
3001
3002
3003
3004
3005
3006
3007
3008
3009
3010
3011
3012
3013
3014
3015
3016
3017
3018
3019
3020
3021
3022
3023
3024
3025
3026
3027
3028
3029
3030
3031
3032
3033
3034
3035
3036
3037
3038
3039
3040
3041
3042
3043
3044
3045
3046
3047
3048
3049
3050
3051
3052
3053
3054
3055
3056
3057
3058
3059
3060
3061
3062
3063
3064
3065
3066
3067
3068
3069
3070
3071
3072
3073
3074
3075
3076
3077
3078
3079
3080
3081
3082
3083
3084
3085
3086
3087
3088
3089
3090
3091
3092
3093
3094
3095
3096
3097
3098
3099
3100
3101
3102
3103
3104
3105
3106
3107
3108
3109
3110
3111
3112
3113
3114
3115
3116
3117
3118
3119
3120
3121
3122
3123
3124
3125
3126
3127
3128
3129
3130
3131
3132
3133
3134
3135
3136
3137
3138
3139
3140
3141
3142
3143
3144
3145
3146
3147
3148
3149
3150
3151
3152
3153
3154
3155
3156
3157
3158
3159
3160
3161
3162
3163
3164
3165
3166
3167
3168
3169
3170
3171
3172
3173
3174
3175
3176
3177
3178
3179
3180
3181
3182
3183
3184
3185
3186
3187
3188
3189
3190
3191
3192
3193
3194
3195
3196
3197
3198
3199
3200
3201
3202
3203
3204
3205
3206
3207
3208
3209
3210
3211
3212
3213
3214
3215
3216
3217
3218
3219
3220
3221
3222
3223
3224
3225
3226
3227
3228
3229
3230
3231
3232
3233
3234
3235
3236
3237
3238
3239
3240
3241
3242
3243
3244
3245
3246
3247
3248
3249
3250
3251
3252
3253
3254
3255
3256
3257
3258
3259
3260
3261
3262
3263
3264
3265
3266
3267
3268
3269
3270
3271
3272
3273
3274
3275
3276
3277
3278
3279
3280
3281
3282
3283
3284
3285
3286
3287
3288
3289
3290
3291
3292
3293
3294
3295
3296
3297
3298
3299
3300
3301
3302
3303
3304
3305
3306
3307
3308
3309
3310
3311
3312
3313
3314
3315
3316
3317
3318
3319
3320
3321
3322
3323
3324
3325
3326
3327
3328
3329
3330
3331
3332
3333
3334
3335
3336
3337
3338
3339
3340
3341
3342
3343
3344
3345
3346
3347
3348
3349
3350
3351
3352
3353
3354
3355
3356
3357
3358
3359
3360
3361
3362
3363
3364
3365
3366
3367
3368
3369
3370
3371
3372
3373
3374
3375
3376
3377
3378
3379
3380
3381
3382
3383
3384
3385
3386
3387
3388
3389
3390
3391
3392
3393
3394
3395
3396
3397
3398
3399
3400
3401
3402
3403
3404
3405
3406
use super::*;
// The multi-series input shape (grouped bar, stacked bar, stacked area). It is
// not part of the `super::*` re-export set because nothing outside this file
// and `PlotInput` names it.
use super::types::{MultiSeriesAxis, MultiSeriesInput};
/// Opacity of the band [`Plot::area`] paints under its curve.
///
/// Matches matplotlib's usual `fill_between` alpha for a curve-plus-band: light
/// enough to read grid lines through, opaque enough to identify the series.
pub(crate) const AREA_FILL_ALPHA: f32 = 0.25;
impl Plot {
fn collect_xy_for_derived_series<X, Y>(
mut self,
x_data: &X,
y_data: &Y,
) -> (Self, Vec<f64>, Vec<f64>)
where
X: NumericData1D,
Y: NumericData1D,
{
let x_values = match collect_numeric_data_1d(x_data, self.null_policy) {
Ok(values) => values,
Err(err) => {
self.set_pending_ingestion_error(err);
return (self, Vec::new(), Vec::new());
}
};
let y_values = match collect_numeric_data_1d(y_data, self.null_policy) {
Ok(values) => values,
Err(err) => {
self.set_pending_ingestion_error(err);
return (self, x_values, Vec::new());
}
};
if x_values.len() != y_values.len() {
self.set_pending_ingestion_error(PlottingError::DataLengthMismatch {
x_len: x_values.len(),
y_len: y_values.len(),
series_index: None,
});
}
(self, x_values, y_values)
}
fn collect_data1d_into_f64<T, D>(data: &D) -> Vec<f64>
where
T: Into<f64> + Copy,
D: Data1D<T>,
{
data.iter().copied().map(Into::into).collect()
}
fn collect_numeric_input<D>(&mut self, data: &D) -> Vec<f64>
where
D: NumericData1D,
{
match collect_numeric_data_1d(data, self.null_policy) {
Ok(values) => values,
Err(err) => {
self.set_pending_ingestion_error(err);
Vec::new()
}
}
}
/// Palette colour the next automatically coloured series will receive.
///
/// Derived series such as [`Plot::area`] and [`Plot::stem`] push their fill
/// or stems as annotations *before* the series itself exists, so they
/// cannot read the colour back off the series. The palette slot a new
/// series is given is [`SeriesManager::auto_color_index`] — the same
/// counter the internal `add_*_series` helpers stamp onto the series they
/// push — so that is the index resolved here.
fn next_series_color(&self) -> Color {
self.display
.theme
.get_color(self.series_mgr.auto_color_index())
}
fn try_collect_numeric_input<D>(&mut self, data: &D) -> Option<Vec<f64>>
where
D: NumericData1D,
{
match collect_numeric_data_1d(data, self.null_policy) {
Ok(values) => Some(values),
Err(err) => {
self.set_pending_ingestion_error(err);
None
}
}
}
/// Add a scoped group of series that share style defaults.
///
/// Styles configured on the group builder apply to every member series
/// added inside the closure and do not leak outside the group.
///
/// # Example
///
/// ```rust,no_run
/// use ruviz::prelude::*;
///
/// let x = vec![0.0, 1.0, 2.0, 3.0];
/// let y1 = vec![0.0, 1.0, 2.0, 3.0];
/// let y2 = vec![0.0, 1.5, 3.0, 4.5];
///
/// Plot::new()
/// .group(|g| {
/// g.group_label("Sensors")
/// .line_width(2.0)
/// .line_style(LineStyle::Dashed)
/// .line(&x, &y1)
/// .line(&x, &y2)
/// })
/// .legend_best()
/// .save("grouped.png")?;
/// # Ok::<(), Box<dyn std::error::Error>>(())
/// ```
pub fn group<F>(self, f: F) -> Self
where
F: FnOnce(SeriesGroupBuilder) -> SeriesGroupBuilder,
{
f(SeriesGroupBuilder::new(self)).finalize()
}
/// Add a line plot series
///
/// Creates a line chart connecting data points in order.
/// Returns a `PlotBuilder<LineConfig>` for method chaining with line-specific options.
///
/// # Example
///
/// ```rust,no_run
/// use ruviz::prelude::*;
///
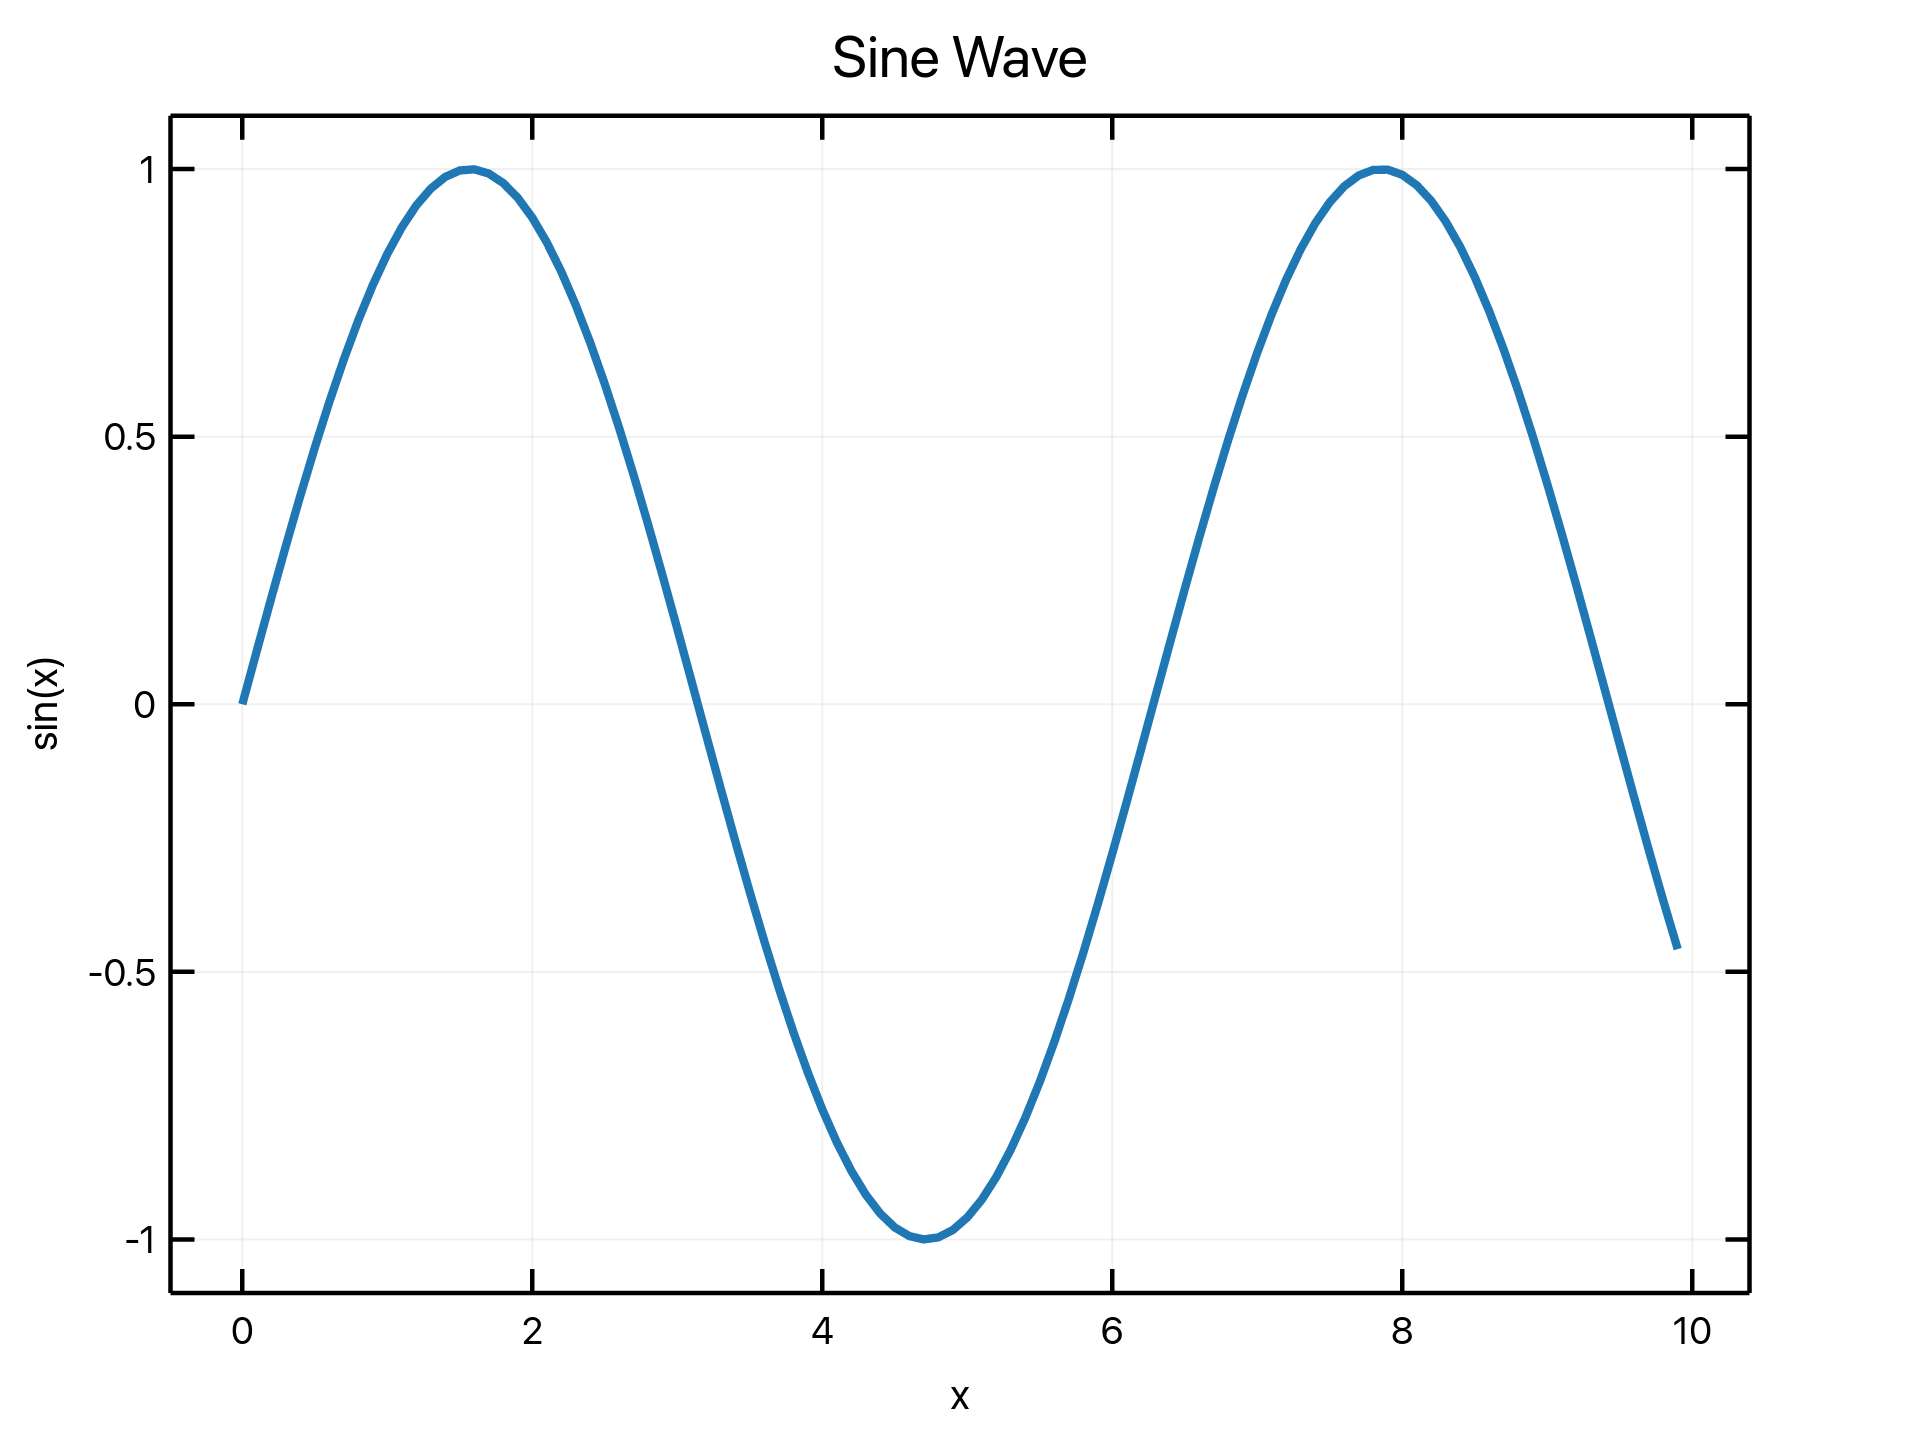
/// let x: Vec<f64> = (0..100).map(|i| i as f64 * 0.1).collect();
/// let y: Vec<f64> = x.iter().map(|&v| v.sin()).collect();
///
/// // Simple usage - just call save() directly
/// Plot::new()
/// .line(&x, &y)
/// .save("line.png")?;
///
/// // With configuration
/// Plot::new()
/// .line(&x, &y)
/// .line_width(2.0)
/// .color(Color::BLUE)
/// .marker(MarkerStyle::Circle)
/// .title("Sine Wave")
/// .save("line_styled.png")?;
/// # Ok::<(), Box<dyn std::error::Error>>(())
/// ```
///
/// 
pub fn line<X, Y>(self, x_data: &X, y_data: &Y) -> PlotBuilder<crate::plots::basic::LineConfig>
where
X: NumericData1D + ?Sized,
Y: NumericData1D + ?Sized,
{
let mut plot = self;
let x_vec = match collect_numeric_data_1d(x_data, plot.null_policy) {
Ok(values) => values,
Err(err) => {
plot.set_pending_ingestion_error(err);
vec![]
}
};
let y_vec = match collect_numeric_data_1d(y_data, plot.null_policy) {
Ok(values) => values,
Err(err) => {
plot.set_pending_ingestion_error(err);
vec![]
}
};
PlotBuilder::new(
plot,
PlotInput::XY(x_vec, y_vec),
crate::plots::basic::LineConfig::default(),
)
}
/// Add a line series from source-backed data.
///
/// With `Observable<Vec<f64>>` inputs, [`Observable::set`](crate::data::Observable::set)
/// replaces a complete coordinate vector without rebuilding the plot or its
/// interactive session. A [`BatchUpdate`](crate::data::BatchUpdate) defers
/// each observable's notifications until guard drop and coalesces repeated
/// changes within that observable. Separate observables still flush
/// independently; the guard is not a shared data lock.
pub fn line_source<X, Y>(
self,
x_data: X,
y_data: Y,
) -> PlotBuilder<crate::plots::basic::LineConfig>
where
X: IntoPlotData,
Y: IntoPlotData,
{
PlotBuilder::new(
self,
PlotInput::XYSource(x_data.into_plot_data(), y_data.into_plot_data()),
crate::plots::basic::LineConfig::default(),
)
}
/// Add a line plot series from streaming data
///
/// This method reads the current data from the StreamingXY buffer at render time.
/// The buffer can continue to receive updates, and subsequent renders will
/// include the new data.
///
/// # Example
///
/// ```rust,no_run
/// use ruviz::prelude::*;
/// use ruviz::data::StreamingXY;
///
/// let stream = StreamingXY::new(1000);
///
/// // Push data (can be from another thread)
/// stream.push(0.0, 0.0);
/// stream.push(1.0, 1.0);
/// stream.push(2.0, 4.0);
///
/// // Render current state
/// Plot::new()
/// .line_streaming(&stream)
/// .title("Streaming Data")
/// .save("stream.png")?;
///
/// // More data arrives
/// stream.push(3.0, 9.0);
///
/// // Re-render with new data
/// Plot::new()
/// .line_streaming(&stream)
/// .save("stream_updated.png")?;
/// # Ok::<(), Box<dyn std::error::Error>>(())
/// ```
pub fn line_streaming(
self,
stream: &StreamingXY,
) -> PlotBuilder<crate::plots::basic::LineConfig> {
PlotBuilder::new(
self,
PlotInput::Streaming(stream.clone()),
crate::plots::basic::LineConfig::default(),
)
}
/// Add a scatter plot series
///
/// Creates a scatter plot showing individual data points as markers.
/// Returns a `PlotBuilder<ScatterConfig>` for method chaining with scatter-specific options.
///
/// # Example
///
/// ```rust,no_run
/// use ruviz::prelude::*;
///
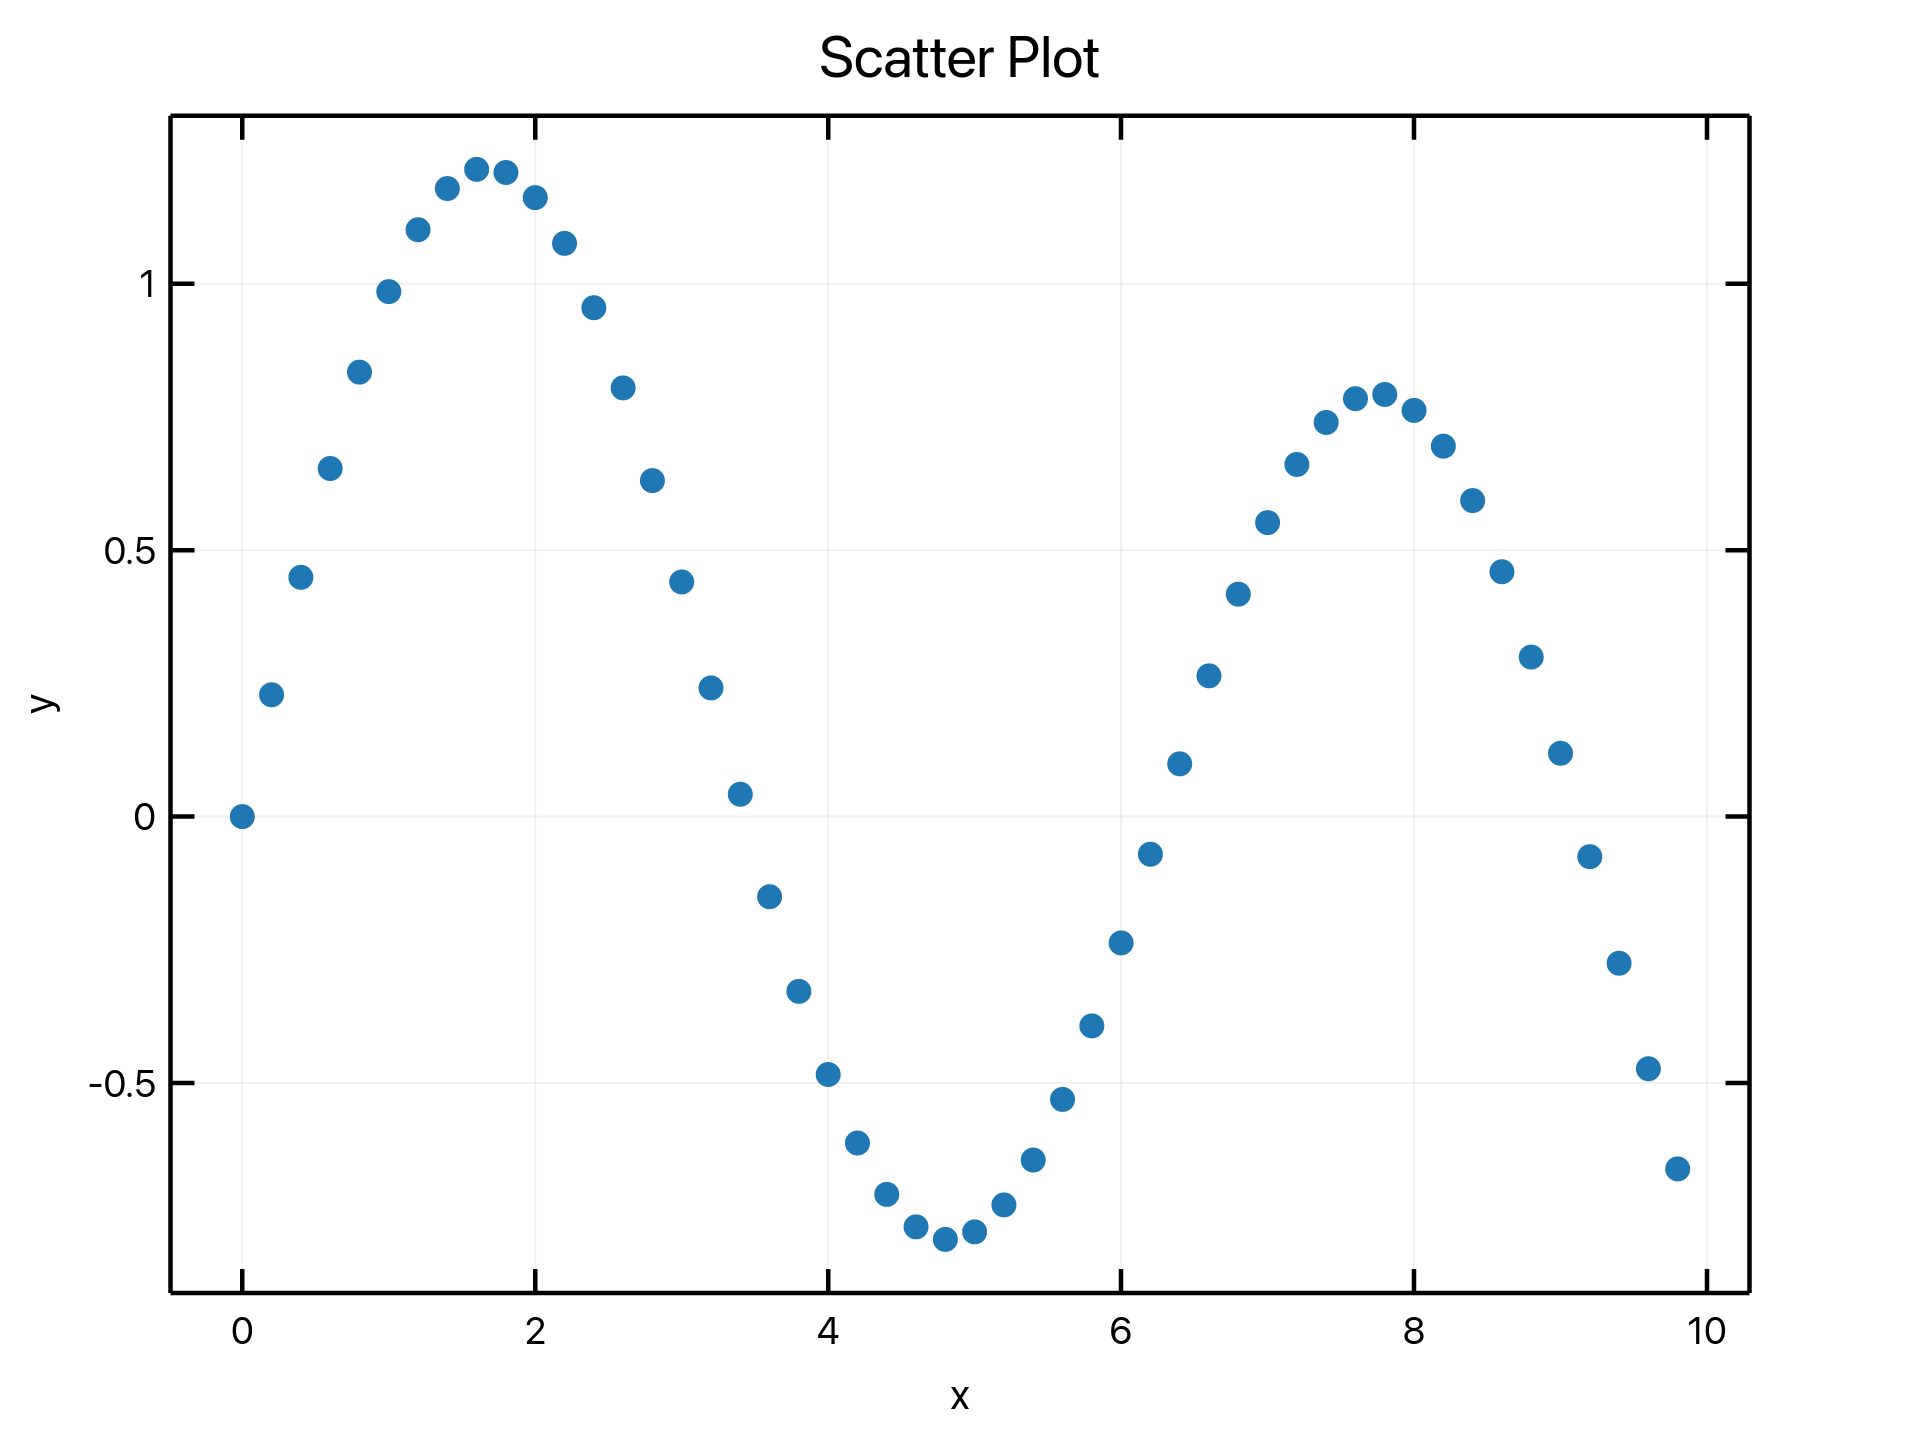
/// let x: Vec<f64> = (0..50).map(|i| i as f64 * 0.2).collect();
/// let y: Vec<f64> = x.iter().map(|&v| v.sin()).collect();
///
/// // Simple usage - just call save() directly
/// Plot::new()
/// .scatter(&x, &y)
/// .save("scatter.png")?;
///
/// // With configuration
/// Plot::new()
/// .scatter(&x, &y)
/// .marker(MarkerStyle::Triangle)
/// .marker_size(10.0)
/// .color(Color::RED)
/// .title("Data Points")
/// .save("scatter_styled.png")?;
/// # Ok::<(), Box<dyn std::error::Error>>(())
/// ```
///
/// 
pub fn scatter<X, Y>(
self,
x_data: &X,
y_data: &Y,
) -> PlotBuilder<crate::plots::basic::ScatterConfig>
where
X: NumericData1D,
Y: NumericData1D,
{
let mut plot = self;
let x_vec = match collect_numeric_data_1d(x_data, plot.null_policy) {
Ok(values) => values,
Err(err) => {
plot.set_pending_ingestion_error(err);
vec![]
}
};
let y_vec = match collect_numeric_data_1d(y_data, plot.null_policy) {
Ok(values) => values,
Err(err) => {
plot.set_pending_ingestion_error(err);
vec![]
}
};
PlotBuilder::new(
plot,
PlotInput::XY(x_vec, y_vec),
crate::plots::basic::ScatterConfig::default(),
)
}
/// Add a scatter series from source-backed data.
///
/// With `Observable<Vec<f64>>` inputs, [`Observable::set`](crate::data::Observable::set)
/// replaces a complete coordinate vector without rebuilding the plot or its
/// interactive session. A [`BatchUpdate`](crate::data::BatchUpdate) defers
/// each observable's notifications until guard drop and coalesces repeated
/// changes within that observable. Separate observables still flush
/// independently; the guard is not a shared data lock.
pub fn scatter_source<X, Y>(
self,
x_data: X,
y_data: Y,
) -> PlotBuilder<crate::plots::basic::ScatterConfig>
where
X: IntoPlotData,
Y: IntoPlotData,
{
PlotBuilder::new(
self,
PlotInput::XYSource(x_data.into_plot_data(), y_data.into_plot_data()),
crate::plots::basic::ScatterConfig::default(),
)
}
/// Add a scatter plot series from streaming data
///
/// Similar to `line_streaming`, reads current data from the buffer at render time.
///
/// # Example
///
/// ```rust,no_run
/// use ruviz::prelude::*;
/// use ruviz::data::StreamingXY;
///
/// let stream = StreamingXY::new(1000);
/// stream.push_many(vec![(0.0, 0.0), (1.0, 1.0), (2.0, 4.0)]);
///
/// Plot::new()
/// .scatter_streaming(&stream)
/// .title("Streaming Scatter")
/// .save("stream_scatter.png")?;
/// # Ok::<(), Box<dyn std::error::Error>>(())
/// ```
pub fn scatter_streaming(
self,
stream: &StreamingXY,
) -> PlotBuilder<crate::plots::basic::ScatterConfig> {
PlotBuilder::new(
self,
PlotInput::Streaming(stream.clone()),
crate::plots::basic::ScatterConfig::default(),
)
}
/// Add a step plot series.
///
/// This is a nonbreaking high-level wrapper around the existing discrete
/// step computation. It stores the computed step vertices as a normal line
/// series, so all standard line styling methods remain available.
///
/// # Example
///
/// ```rust,no_run
/// use ruviz::plots::discrete::StepWhere;
/// use ruviz::prelude::*;
///
/// let x = vec![0.0, 1.0, 2.0, 3.0];
/// let y = vec![1.0, 3.0, 2.0, 4.0];
///
/// Plot::new()
/// .step(&x, &y, StepWhere::Post)
/// .line_width(2.0)
/// .save("step.png")?;
/// # Ok::<(), Box<dyn std::error::Error>>(())
/// ```
pub fn step<X, Y>(
self,
x_data: &X,
y_data: &Y,
where_step: crate::plots::discrete::StepWhere,
) -> PlotBuilder<crate::plots::basic::LineConfig>
where
X: NumericData1D,
Y: NumericData1D,
{
let (plot, x_values, y_values) = self.collect_xy_for_derived_series(x_data, y_data);
let (step_x, step_y): (Vec<_>, Vec<_>) =
crate::plots::discrete::step_line(&x_values, &y_values, where_step)
.into_iter()
.unzip();
PlotBuilder::new(
plot,
PlotInput::XY(step_x, step_y),
crate::plots::basic::LineConfig::default(),
)
}
/// Add an area plot filled from the curve to `baseline`.
///
/// The fill is stored as a data-coordinate annotation and the visible curve
/// is stored as a normal line series, preserving existing line styling APIs.
/// The fill inherits the palette colour the curve will be drawn in, at 25%
/// opacity. An explicit `.color()` on the returned builder restyles the
/// curve only — the fill keeps the palette colour.
///
/// # Example
///
/// ```rust,no_run
/// use ruviz::prelude::*;
///
/// let x = vec![0.0, 1.0, 2.0, 3.0];
/// let y = vec![1.0, 2.5, 1.5, 3.0];
///
/// Plot::new()
/// .area(&x, &y, 0.0)
/// .color(Color::BLUE)
/// .save("area.png")?;
/// # Ok::<(), Box<dyn std::error::Error>>(())
/// ```
pub fn area<X, Y>(
self,
x_data: &X,
y_data: &Y,
baseline: f64,
) -> PlotBuilder<crate::plots::basic::LineConfig>
where
X: NumericData1D,
Y: NumericData1D,
{
let (plot, x_values, y_values) = self.collect_xy_for_derived_series(x_data, y_data);
let fill_style = FillStyle::default()
.color(plot.next_series_color())
.alpha(AREA_FILL_ALPHA);
let baselines = vec![baseline; x_values.len()];
let plot = plot.fill_between_styled(&x_values, &y_values, &baselines, fill_style, false);
PlotBuilder::new(
plot,
PlotInput::XY(x_values, y_values),
crate::plots::basic::LineConfig::default(),
)
}
/// Add a stem plot with vertical stems from `baseline` to each point.
///
/// Stems are rendered as annotation line segments and point heads are stored
/// as a normal scatter series, so scatter marker styling remains available.
/// Stems inherit the palette colour the markers will be drawn in. An
/// explicit `.color()` on the returned builder restyles the markers only —
/// the stems keep the palette colour.
///
/// # Example
///
/// ```rust,no_run
/// use ruviz::prelude::*;
///
/// let x = vec![0.0, 1.0, 2.0, 3.0];
/// let y = vec![1.0, 3.0, 2.0, 4.0];
///
/// Plot::new()
/// .stem(&x, &y, 0.0)
/// .marker_size(5.0)
/// .save("stem.png")?;
/// # Ok::<(), Box<dyn std::error::Error>>(())
/// ```
pub fn stem<X, Y>(
self,
x_data: &X,
y_data: &Y,
baseline: f64,
) -> PlotBuilder<crate::plots::basic::ScatterConfig>
where
X: NumericData1D,
Y: NumericData1D,
{
let (mut plot, x_values, y_values) = self.collect_xy_for_derived_series(x_data, y_data);
// `series_structure()` is what puts the stems in the underlay so the
// markers drawn afterwards stay on top of them; the missing heads are
// only cosmetic and must not be used to infer that.
let stem_style = ArrowStyle::new()
.color(plot.next_series_color())
.head_style(crate::core::ArrowHead::None)
.tail_style(crate::core::ArrowHead::None)
.series_structure();
for (&x, &y) in x_values.iter().zip(y_values.iter()) {
plot = plot.arrow_styled(x, baseline, x, y, stem_style.clone());
}
PlotBuilder::new(
plot,
PlotInput::XY(x_values, y_values),
crate::plots::basic::ScatterConfig::default(),
)
}
/// Add a bar plot series
///
/// Creates a bar chart with categorical x-axis labels.
///
/// # Example
///
/// Returns a `PlotBuilder<BarConfig>` for method chaining with bar-specific options.
///
/// ```rust,no_run
/// use ruviz::prelude::*;
///
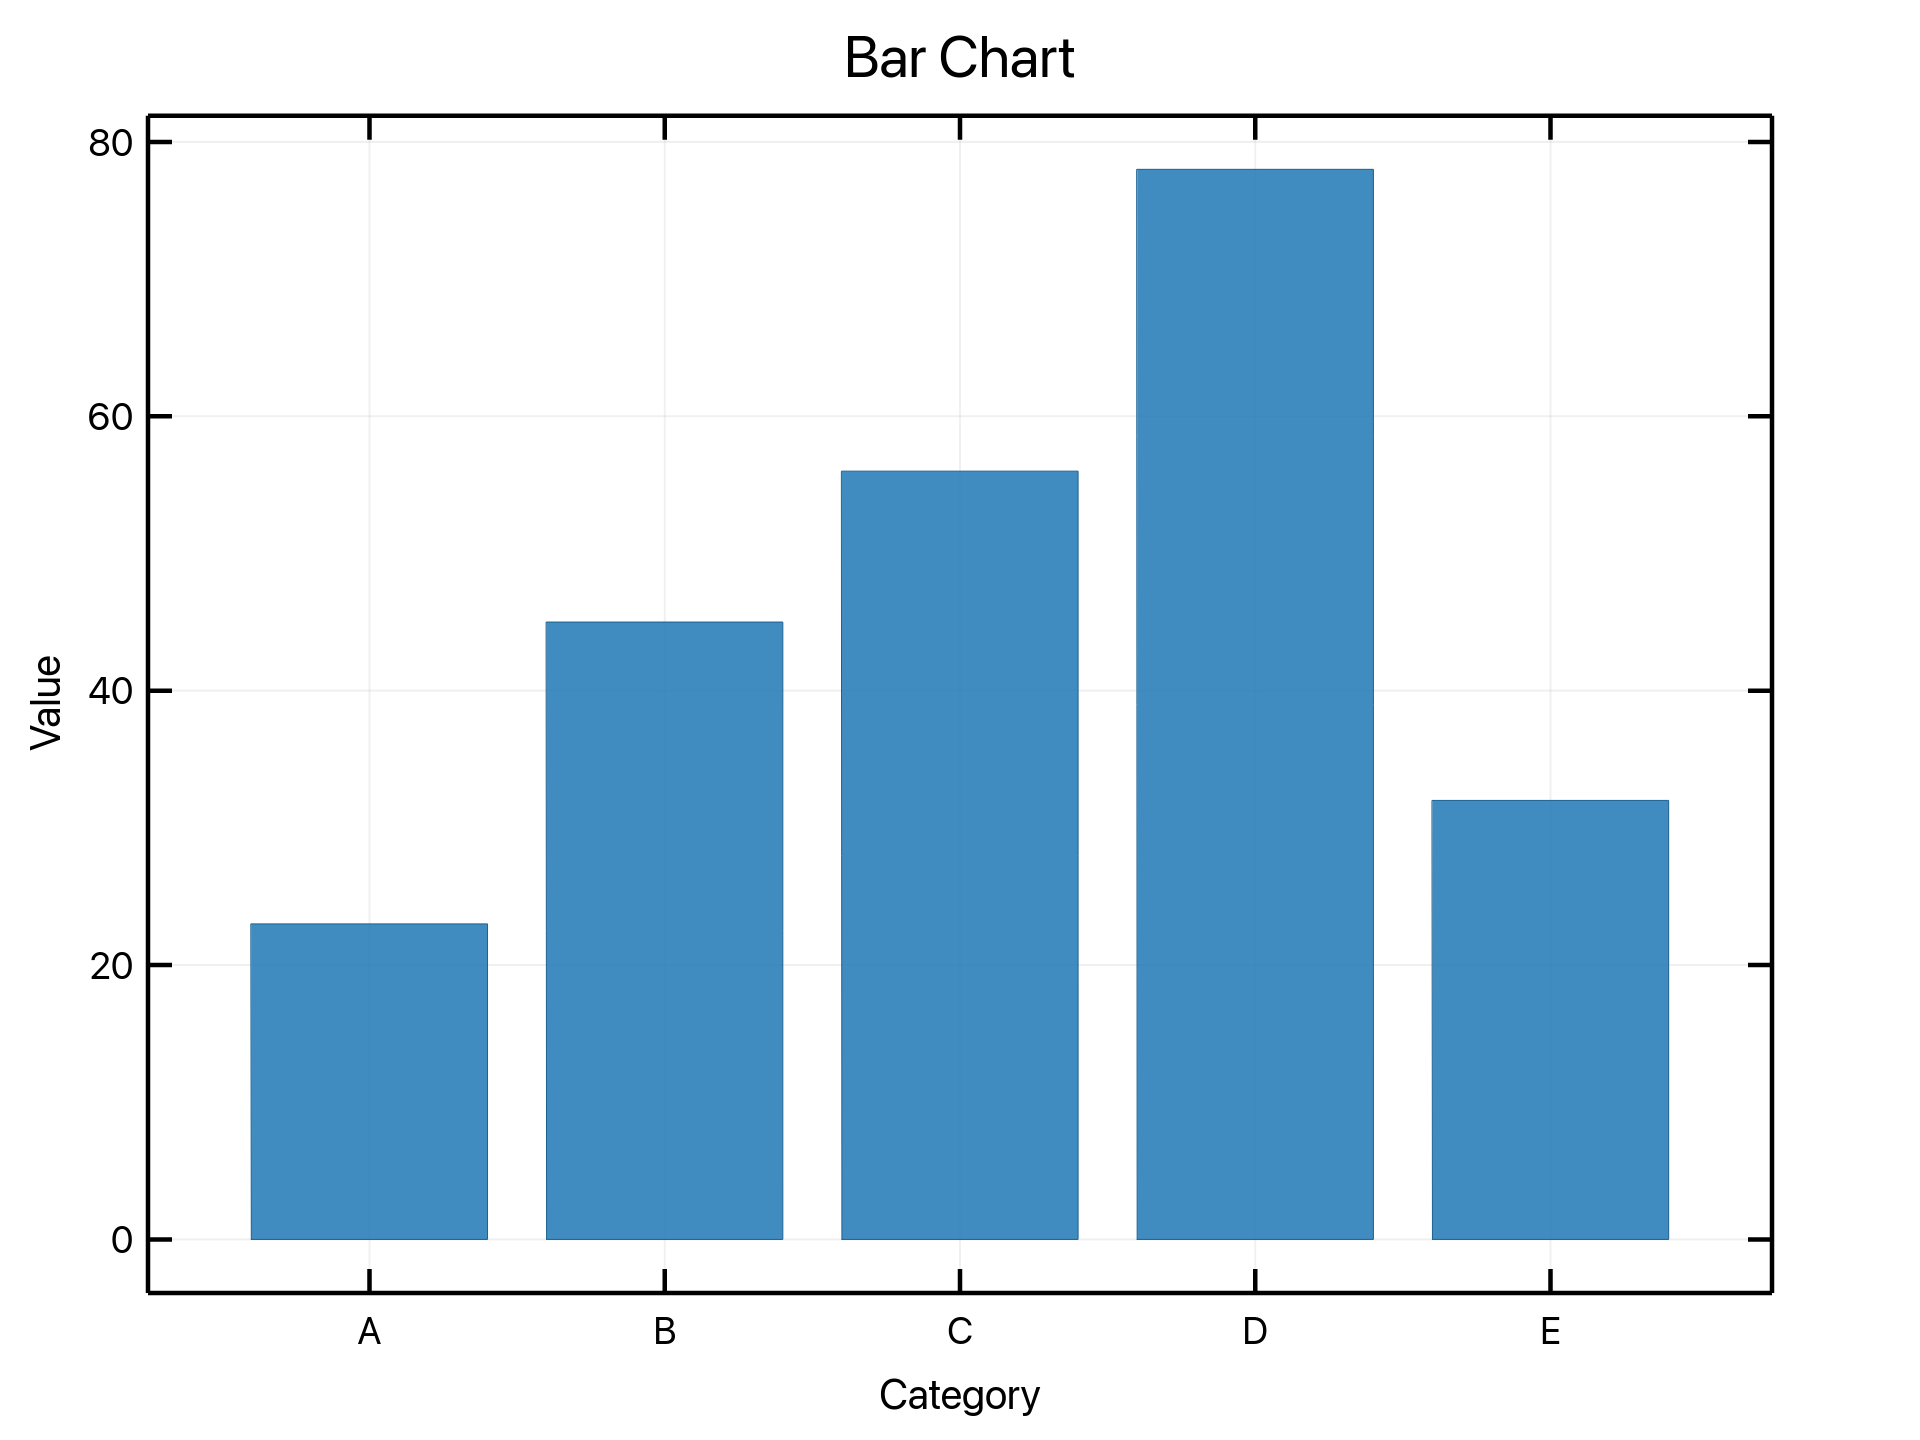
/// let categories = vec!["A", "B", "C", "D", "E"];
/// let values = vec![23.0, 45.0, 56.0, 78.0, 32.0];
///
/// // Simple usage - just call save() directly
/// Plot::new()
/// .bar(&categories, &values)
/// .save("bar.png")?;
///
/// // With configuration
/// Plot::new()
/// .bar(&categories, &values)
/// .bar_width(0.6)
/// .color(Color::GREEN)
/// .edge_width(1.5)
/// .title("Category Values")
/// .save("bar_styled.png")?;
/// # Ok::<(), Box<dyn std::error::Error>>(())
/// ```
///
/// 
pub fn bar<S, V>(
self,
categories: &[S],
values: &V,
) -> PlotBuilder<crate::plots::basic::BarConfig>
where
S: ToString,
V: NumericData1D,
{
let mut plot = self;
let cat_vec: Vec<String> = categories.iter().map(|s| s.to_string()).collect();
let val_vec = match collect_numeric_data_1d(values, plot.null_policy) {
Ok(values) => values,
Err(err) => {
plot.set_pending_ingestion_error(err);
vec![]
}
};
PlotBuilder::new(
plot,
PlotInput::Categorical {
categories: cat_vec,
values: val_vec,
},
crate::plots::basic::BarConfig::default(),
)
}
/// Add a bar series from source-backed values.
pub fn bar_source<S, V>(
self,
categories: &[S],
values: V,
) -> PlotBuilder<crate::plots::basic::BarConfig>
where
S: ToString,
V: IntoPlotData,
{
PlotBuilder::new(
self,
PlotInput::CategoricalSource {
categories: categories.iter().map(ToString::to_string).collect(),
values: values.into_plot_data(),
},
crate::plots::basic::BarConfig::default(),
)
}
/// Add a histogram series.
///
/// Returns a [`PlotBuilder`]`<HistogramConfig>`, the same builder shape every
/// other series method returns: binning knobs, series styling, plot-level
/// settings, further series and the terminal `save`/`render` calls all chain
/// straight off it.
///
/// # Example
///
/// ```rust,no_run
/// use ruviz::prelude::*;
///
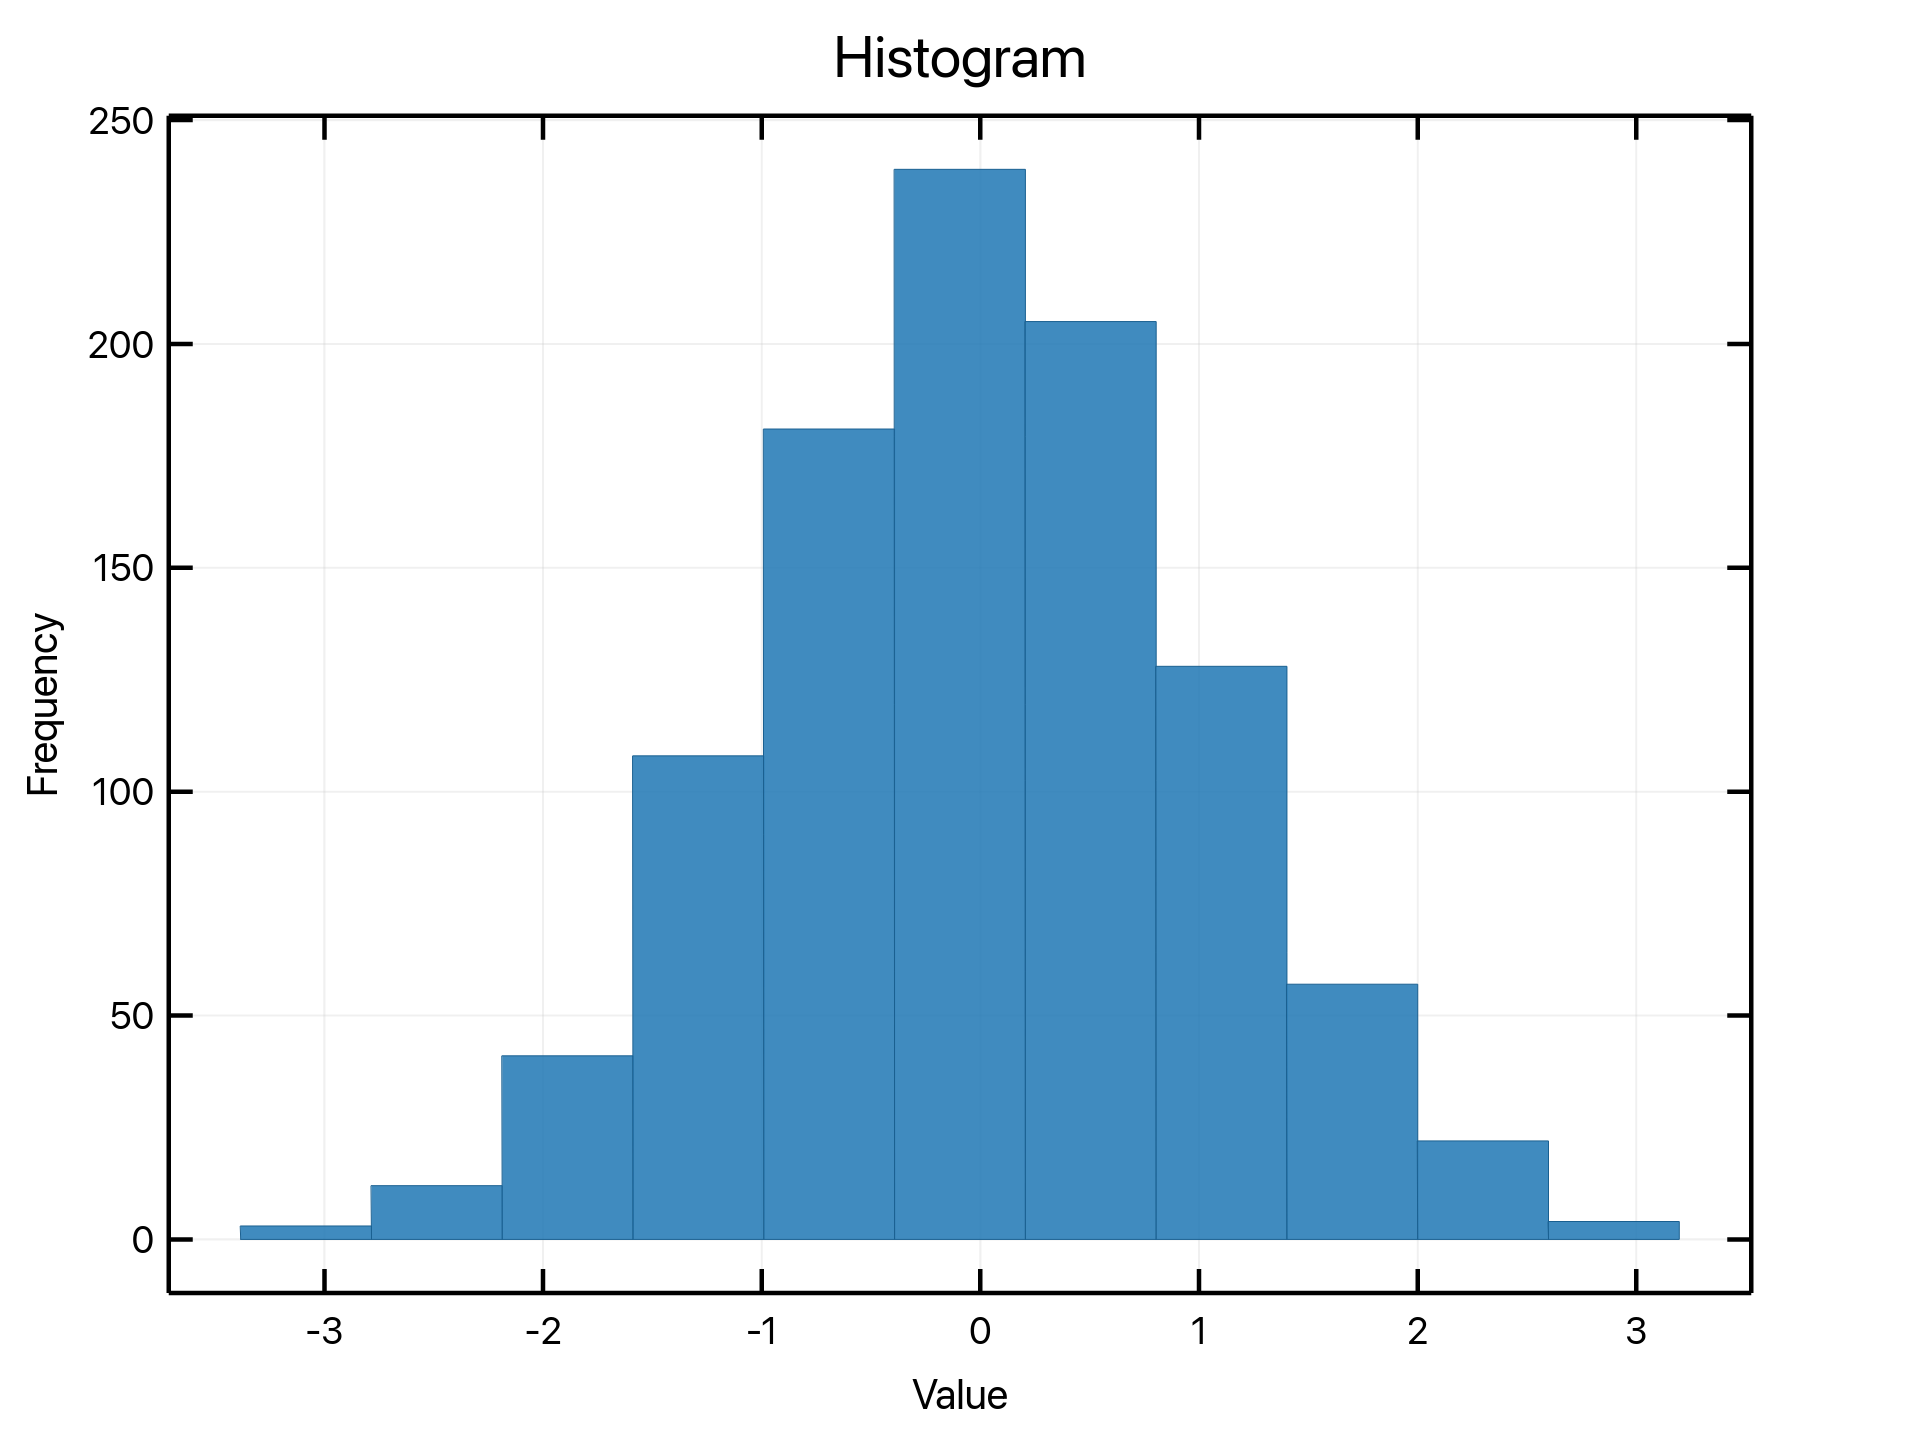
/// let data: Vec<f64> = (0..1000).map(|i| (i as f64 / 100.0).sin()).collect();
///
/// Plot::new()
/// .histogram(&data)
/// .bins(30)
/// .density(true)
/// .label("Samples")
/// .legend_best()
/// .save("histogram.png")?;
/// # Ok::<(), Box<dyn std::error::Error>>(())
/// ```
///
/// 
pub fn histogram<D: NumericData1D>(self, data: &D) -> PlotBuilder<HistogramConfig> {
self.histogram_with(data, HistogramConfig::default())
}
/// Add a histogram series starting from an existing [`HistogramConfig`].
///
/// [`Plot::histogram`] plus the builder's setters is the primary form; this
/// is for callers that already hold a fully built config value. The builder
/// setters still apply on top of `config`.
///
/// # Example
///
/// ```rust,no_run
/// use ruviz::prelude::*;
/// use ruviz::plots::histogram::HistogramConfig;
///
/// let data: Vec<f64> = (0..1000).map(|i| (i as f64 / 100.0).sin()).collect();
///
/// Plot::new()
/// .histogram_with(&data, HistogramConfig::new().bins(20))
/// .save("histogram.png")?;
/// # Ok::<(), Box<dyn std::error::Error>>(())
/// ```
pub fn histogram_with<D: NumericData1D>(
mut self,
data: &D,
config: HistogramConfig,
) -> PlotBuilder<HistogramConfig> {
let values = self.collect_numeric_input(data);
PlotBuilder::new(self, PlotInput::Single(values), config)
}
/// Add a histogram series from source-backed values.
pub fn histogram_source<D: IntoPlotData>(self, data: D) -> PlotBuilder<HistogramConfig> {
self.histogram_source_with(data, HistogramConfig::default())
}
/// Add a source-backed histogram series starting from an existing config.
pub fn histogram_source_with<D: IntoPlotData>(
self,
data: D,
config: HistogramConfig,
) -> PlotBuilder<HistogramConfig> {
PlotBuilder::new(self, PlotInput::SingleSource(data.into_plot_data()), config)
}
/// Add a box plot series.
///
/// Returns a [`PlotBuilder`]`<BoxPlotConfig>`, the same builder shape every
/// other series method returns.
///
/// # Example
///
/// ```rust,no_run
/// use ruviz::prelude::*;
///
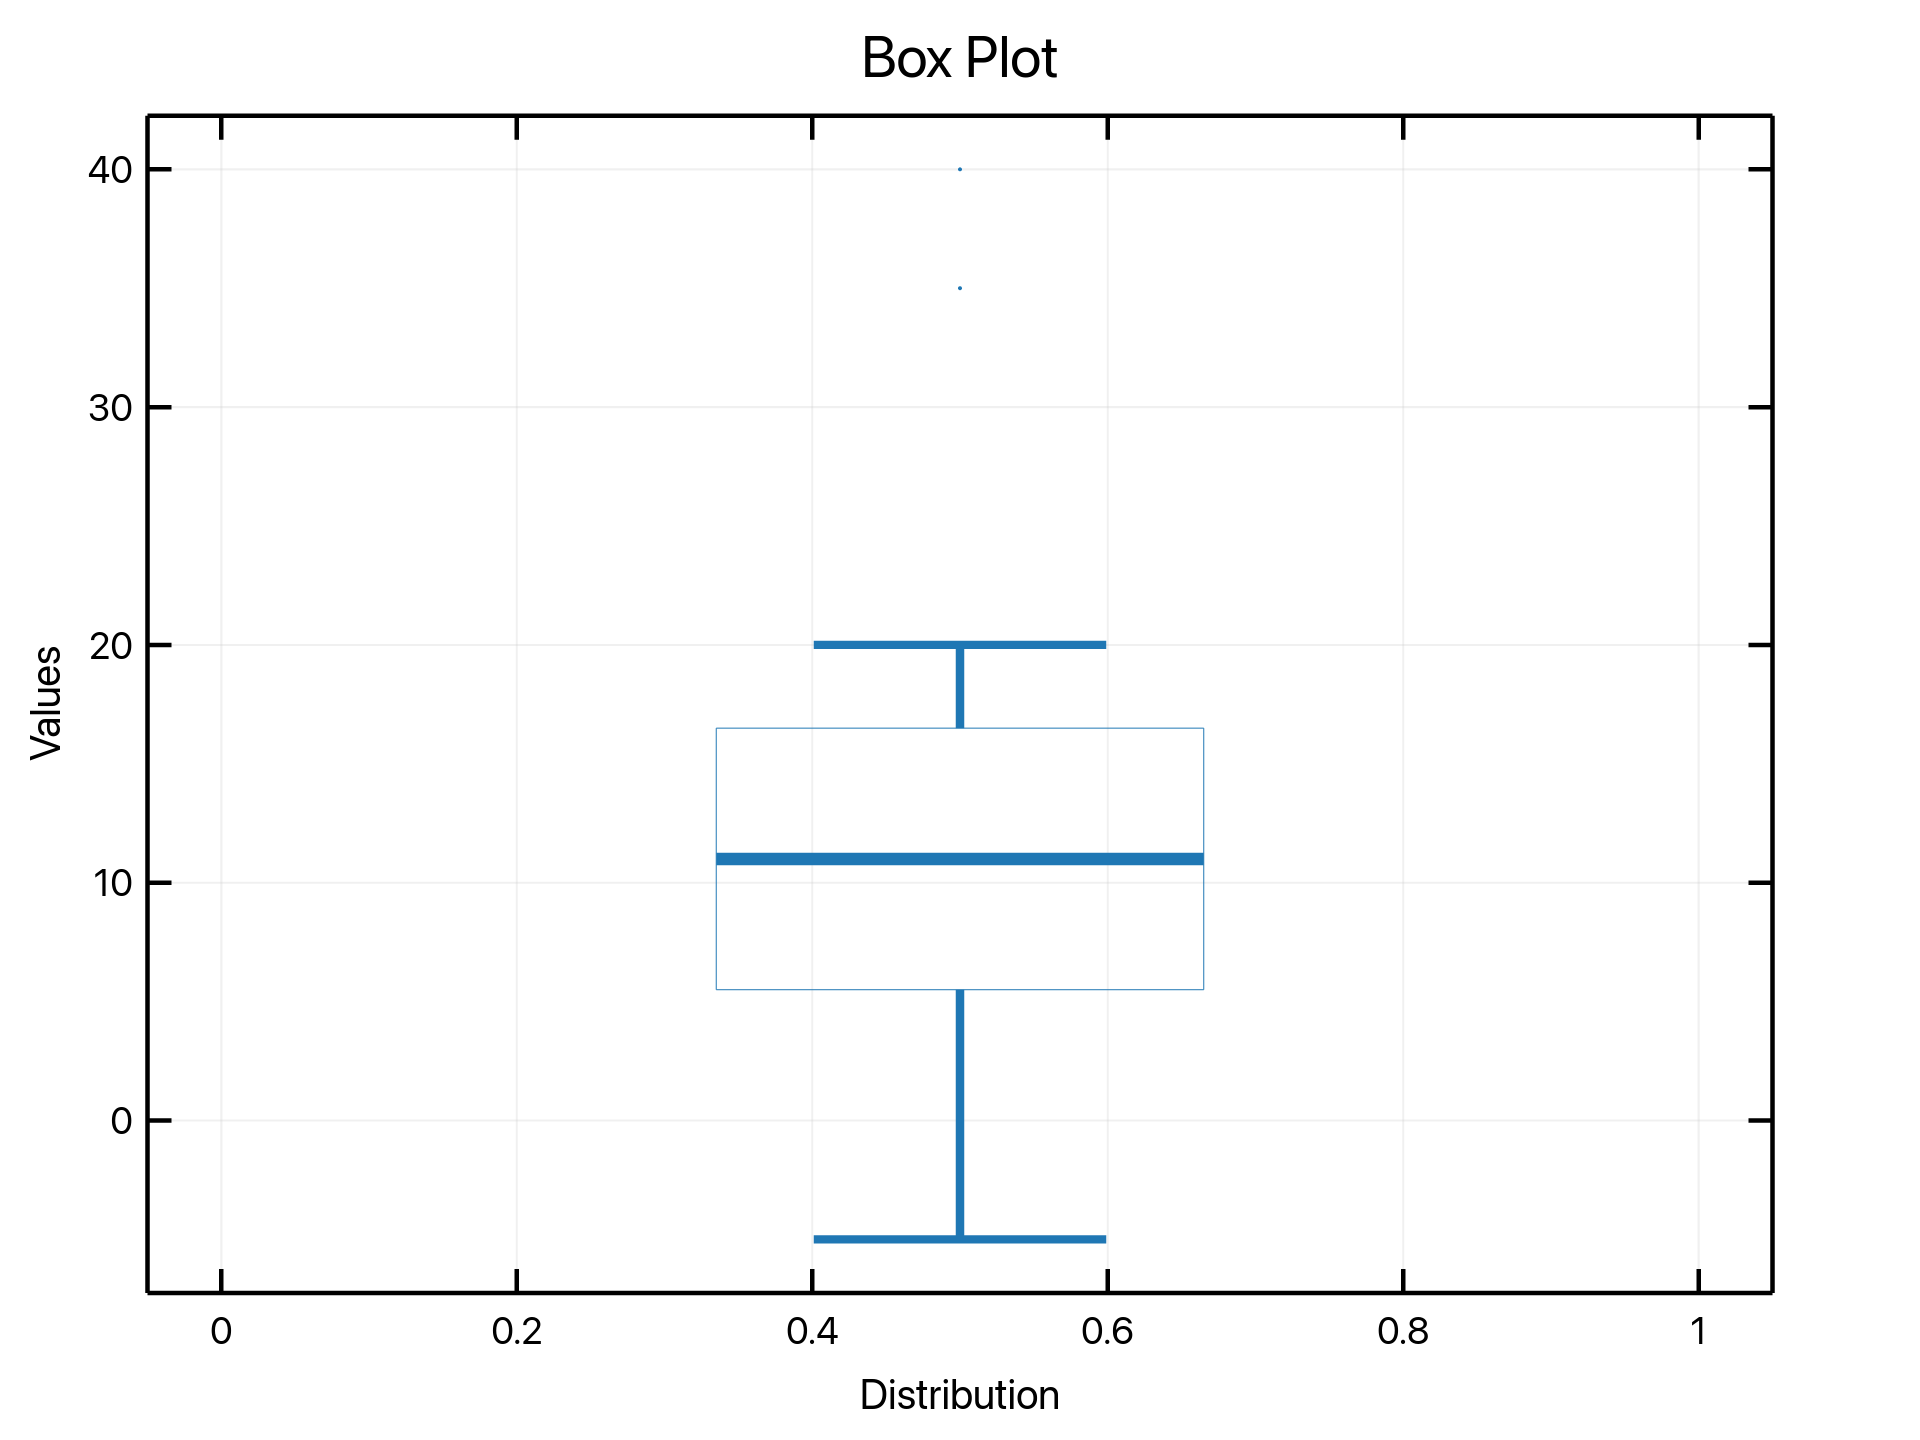
/// let data = vec![1.0, 2.0, 3.0, 4.0, 5.0, 6.0, 7.0, 8.0, 9.0, 10.0,
/// 11.0, 12.0, 35.0, 40.0, -5.0]; // includes outliers
///
/// Plot::new()
/// .boxplot(&data)
/// .show_mean(true)
/// .save("boxplot.png")?;
/// # Ok::<(), Box<dyn std::error::Error>>(())
/// ```
///
/// 
pub fn boxplot<D: NumericData1D>(self, data: &D) -> PlotBuilder<BoxPlotConfig> {
self.boxplot_with(data, BoxPlotConfig::default())
}
/// Add a box plot series starting from an existing [`BoxPlotConfig`].
///
/// [`Plot::boxplot`] plus the builder's setters is the primary form; this is
/// for callers that already hold a fully built config value.
///
/// # Example
///
/// ```rust,no_run
/// use ruviz::prelude::*;
/// use ruviz::plots::boxplot::BoxPlotConfig;
///
/// let data = vec![1.0, 2.0, 3.0, 4.0, 5.0, 6.0];
///
/// Plot::new()
/// .boxplot_with(&data, BoxPlotConfig::new())
/// .save("boxplot.png")?;
/// # Ok::<(), Box<dyn std::error::Error>>(())
/// ```
pub fn boxplot_with<D: NumericData1D>(
mut self,
data: &D,
config: BoxPlotConfig,
) -> PlotBuilder<BoxPlotConfig> {
let values = self.collect_numeric_input(data);
PlotBuilder::new(self, PlotInput::Single(values), config)
}
/// Add a box plot series from source-backed values.
pub fn boxplot_source<D: IntoPlotData>(self, data: D) -> PlotBuilder<BoxPlotConfig> {
self.boxplot_source_with(data, BoxPlotConfig::default())
}
/// Add a source-backed box plot series starting from an existing config.
pub fn boxplot_source_with<D: IntoPlotData>(
self,
data: D,
config: BoxPlotConfig,
) -> PlotBuilder<BoxPlotConfig> {
PlotBuilder::new(self, PlotInput::SingleSource(data.into_plot_data()), config)
}
/// Add a heatmap visualization for 2D array data.
///
/// Returns a [`PlotBuilder`]`<HeatmapConfig>`, the same builder
/// shape every other series method returns, so colormap, colorbar and
/// scaling knobs chain directly off the call.
///
/// The grid is switched off for the plot, because grid lines behind heatmap
/// cells are never visible.
///
/// # Example
///
/// ```rust,no_run
/// use ruviz::prelude::*;
///
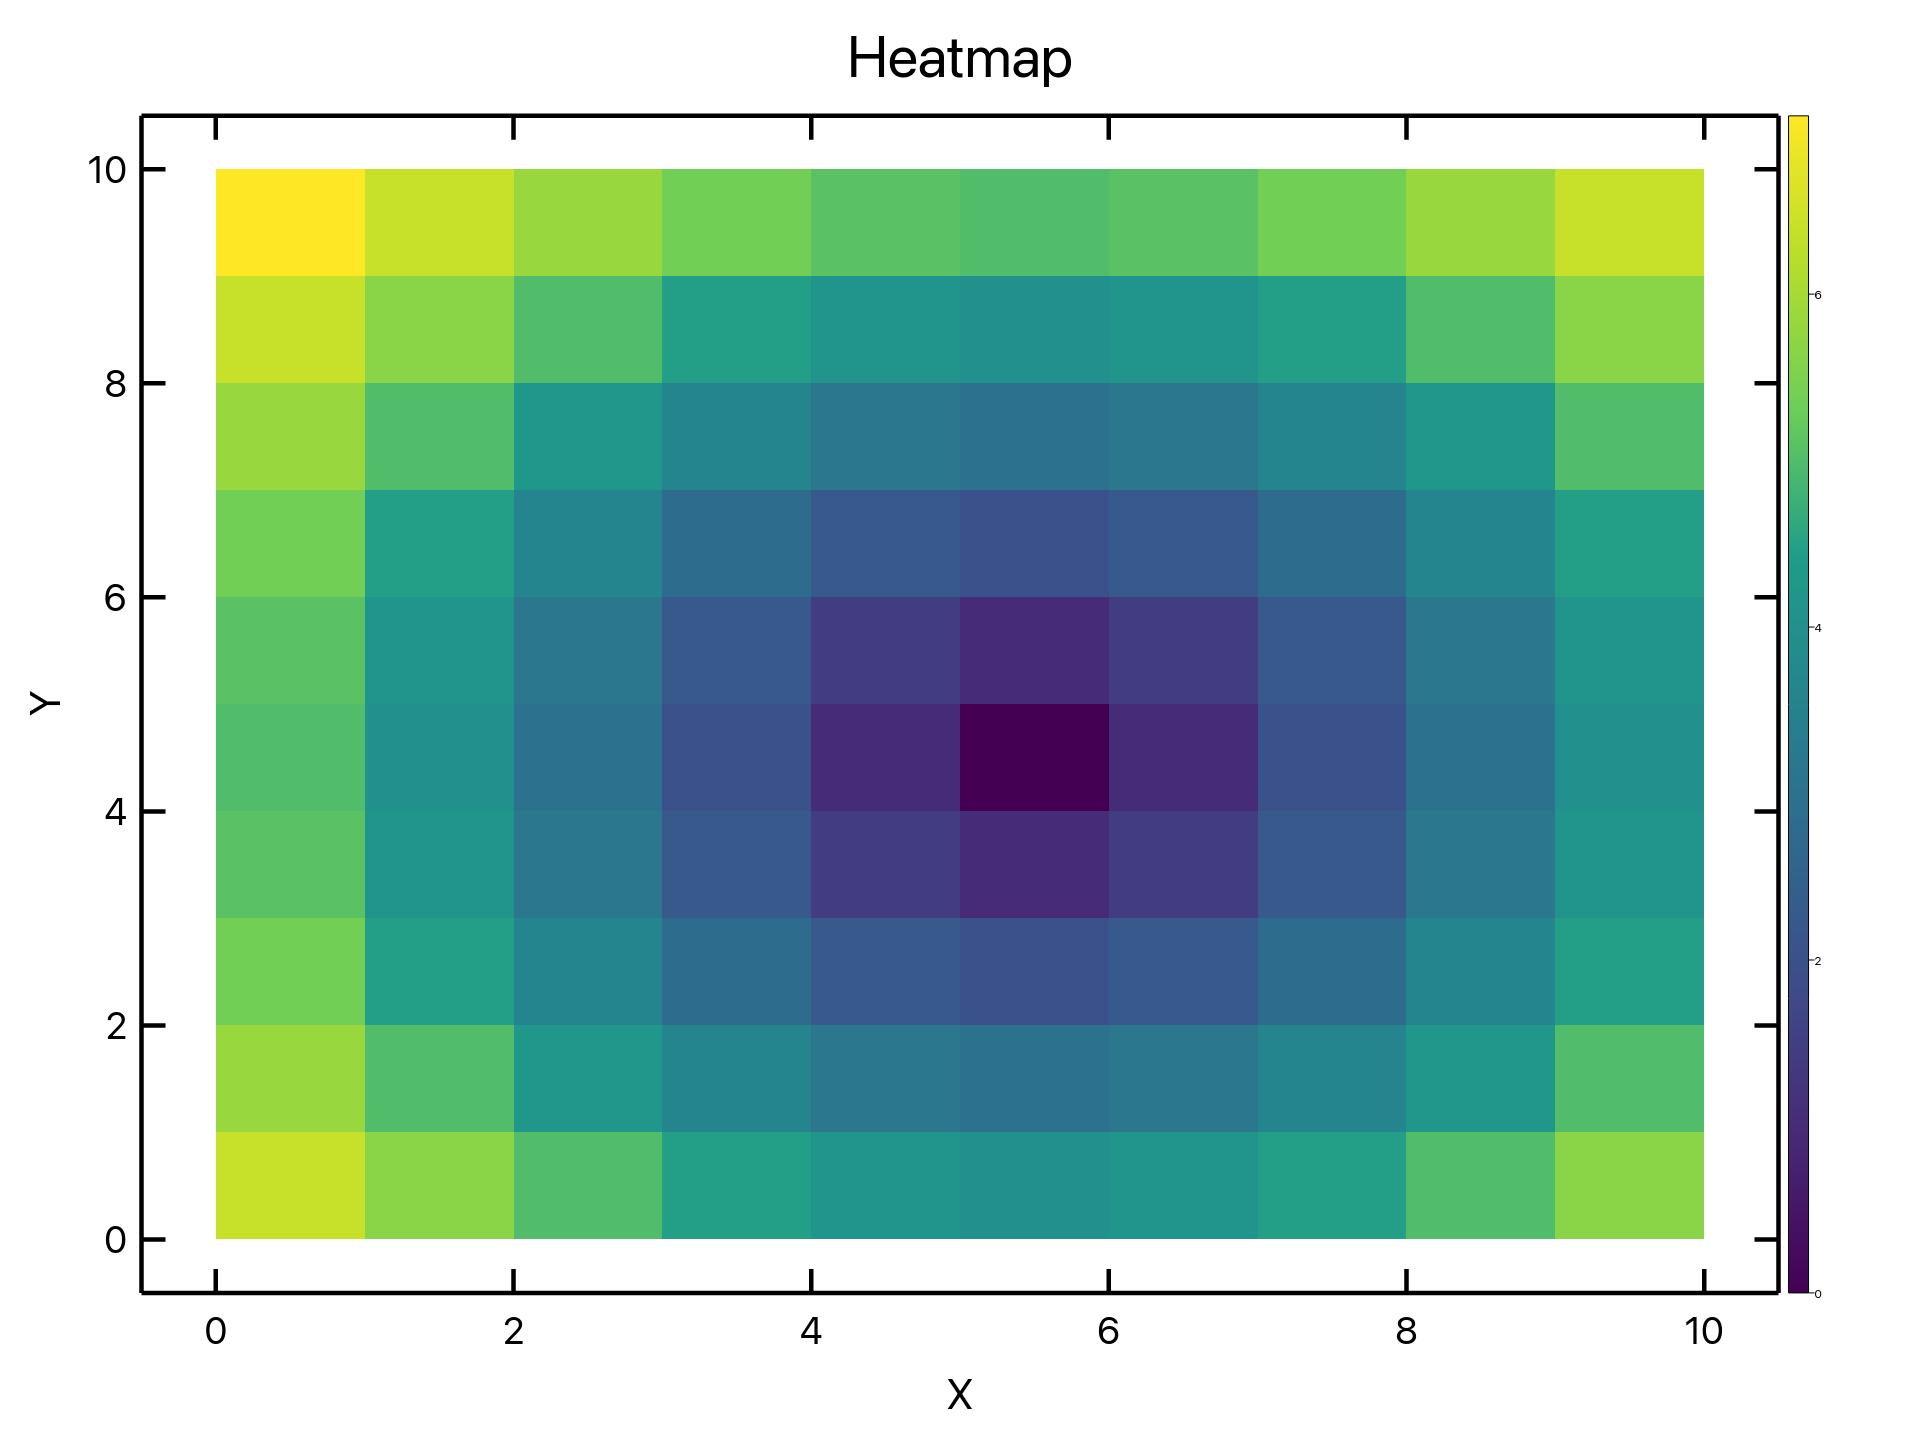
/// let data: Vec<Vec<f64>> = (0..10)
/// .map(|i| (0..10).map(|j| (i + j + 1) as f64).collect())
/// .collect();
///
/// Plot::new()
/// .heatmap(&data)
/// .value_scale(AxisScale::Log)
/// .colorbar_label("Intensity")
/// .save("heatmap.png")?;
/// # Ok::<(), Box<dyn std::error::Error>>(())
/// ```
///
/// 
pub fn heatmap<D>(self, data: &D) -> PlotBuilder<crate::plots::heatmap::HeatmapConfig>
where
D: NumericData2D + ?Sized,
{
self.heatmap_with(data, crate::plots::heatmap::HeatmapConfig::default())
}
/// Add a heatmap starting from an existing [`HeatmapConfig`](crate::plots::heatmap::HeatmapConfig).
///
/// [`Plot::heatmap`] plus the builder's setters is the primary form; this is
/// for callers that already hold a fully built config value.
///
/// # Example
///
/// ```rust,no_run
/// use ruviz::prelude::*;
///
/// let data: Vec<Vec<f64>> = (0..4)
/// .map(|i| (0..4).map(|j| (i + j + 1) as f64).collect())
/// .collect();
///
/// let config = HeatmapConfig::new()
/// .value_scale(AxisScale::Log)
/// .colorbar_label("Intensity");
///
/// Plot::new()
/// .heatmap_with(&data, config)
/// .save("heatmap.png")?;
/// # Ok::<(), Box<dyn std::error::Error>>(())
/// ```
pub fn heatmap_with<D>(
mut self,
data: &D,
config: crate::plots::heatmap::HeatmapConfig,
) -> PlotBuilder<crate::plots::heatmap::HeatmapConfig>
where
D: NumericData2D + ?Sized,
{
// Grid lines behind heatmap cells are never visible, so a heatmap always
// turns the grid off for the plot it joins.
self.layout.grid_style.visible = false;
let (flat, rows, cols) = match collect_numeric_data_2d(data) {
Ok(values) => values,
Err(err) => {
self.set_pending_ingestion_error(err);
(vec![], 0, 0)
}
};
// The rows are kept unprocessed until `finalize()` so that every builder
// setter called after `heatmap()` still affects the colour mapping.
let values: Vec<Vec<f64>> = if cols == 0 {
Vec::new()
} else {
flat.chunks(cols).map(<[f64]>::to_vec).collect()
};
// `point_count()` (used by `auto_optimize`) reads the axis vectors, so
// they carry the grid dimensions even though `finalize()` only needs `z`.
let x = (0..cols).map(|i| i as f64).collect();
let y = (0..rows).map(|i| i as f64).collect();
PlotBuilder::new(self, PlotInput::Grid2D { x, y, z: values }, config)
}
/// Add a series of Y-direction error bars.
///
/// Returns a [`PlotBuilder`]`<ErrorBarConfig>`, the same builder
/// shape every other series method returns. Add X errors to the same series
/// with [`PlotBuilder::with_xerr`], or use [`Plot::error_bars_xy`].
///
/// # Example
///
/// ```rust,no_run
/// use ruviz::prelude::*;
///
/// let x = vec![1.0, 2.0, 3.0];
/// let y = vec![2.0, 4.0, 3.0];
/// let yerr = vec![0.2, 0.3, 0.25];
///
/// Plot::new()
/// .error_bars(&x, &y, &yerr)
/// .cap_size(6.0)
/// .label("Measurement")
/// .legend_best()
/// .save("error_bars.png")?;
/// # Ok::<(), Box<dyn std::error::Error>>(())
/// ```
pub fn error_bars<X, Y, E>(
mut self,
x_data: &X,
y_data: &Y,
y_errors: &E,
) -> PlotBuilder<ErrorBarConfig>
where
X: NumericData1D,
Y: NumericData1D,
E: NumericData1D,
{
let x = self.collect_numeric_input(x_data);
let y = self.collect_numeric_input(y_data);
let y_errors = self.collect_numeric_input(y_errors);
PlotBuilder::new(
self,
PlotInput::ErrorBars {
x: PlotData::Static(x),
y: PlotData::Static(y),
x_errors: None,
y_errors: Some(PlotData::Static(y_errors)),
},
ErrorBarConfig::default(),
)
}
/// Add Y-direction error bars from source-backed X, Y, and error data.
pub fn error_bars_source<X, Y, E>(
self,
x_data: X,
y_data: Y,
y_errors: E,
) -> PlotBuilder<ErrorBarConfig>
where
X: IntoPlotData,
Y: IntoPlotData,
E: IntoPlotData,
{
PlotBuilder::new(
self,
PlotInput::ErrorBars {
x: x_data.into_plot_data(),
y: y_data.into_plot_data(),
x_errors: None,
y_errors: Some(y_errors.into_plot_data()),
},
ErrorBarConfig::default(),
)
}
/// Add a series of error bars in both the X and Y directions.
///
/// # Example
///
/// ```rust,no_run
/// use ruviz::prelude::*;
///
/// let x = vec![1.0, 2.0, 3.0];
/// let y = vec![2.0, 4.0, 3.0];
/// let xerr = vec![0.1, 0.1, 0.1];
/// let yerr = vec![0.2, 0.3, 0.25];
///
/// Plot::new()
/// .error_bars_xy(&x, &y, &xerr, &yerr)
/// .save("error_bars_xy.png")?;
/// # Ok::<(), Box<dyn std::error::Error>>(())
/// ```
pub fn error_bars_xy<X, Y, EX, EY>(
mut self,
x_data: &X,
y_data: &Y,
x_errors: &EX,
y_errors: &EY,
) -> PlotBuilder<ErrorBarConfig>
where
X: NumericData1D,
Y: NumericData1D,
EX: NumericData1D,
EY: NumericData1D,
{
let x = self.collect_numeric_input(x_data);
let y = self.collect_numeric_input(y_data);
let x_errors = self.collect_numeric_input(x_errors);
let y_errors = self.collect_numeric_input(y_errors);
PlotBuilder::new(
self,
PlotInput::ErrorBars {
x: PlotData::Static(x),
y: PlotData::Static(y),
x_errors: Some(PlotData::Static(x_errors)),
y_errors: Some(PlotData::Static(y_errors)),
},
ErrorBarConfig::default(),
)
}
/// Add X/Y error bars from source-backed data.
pub fn error_bars_xy_source<X, Y, EX, EY>(
self,
x_data: X,
y_data: Y,
x_errors: EX,
y_errors: EY,
) -> PlotBuilder<ErrorBarConfig>
where
X: IntoPlotData,
Y: IntoPlotData,
EX: IntoPlotData,
EY: IntoPlotData,
{
PlotBuilder::new(
self,
PlotInput::ErrorBars {
x: x_data.into_plot_data(),
y: y_data.into_plot_data(),
x_errors: Some(x_errors.into_plot_data()),
y_errors: Some(y_errors.into_plot_data()),
},
ErrorBarConfig::default(),
)
}
/// Add a KDE (Kernel Density Estimation) plot
///
/// Creates a smooth density estimate visualization of the data distribution.
/// Returns a `PlotBuilder<KdeConfig>` for method chaining with KDE-specific options.
///
/// # Example
///
/// ```rust,no_run
/// use ruviz::prelude::*;
///
/// let data: Vec<f64> = (0..1000).map(|i| (i as f64 / 100.0).sin()).collect();
///
/// // Simple usage - just save directly
/// Plot::new()
/// .kde(&data)
/// .save("kde.png")?;
///
/// // With configuration
/// Plot::new()
/// .kde(&data)
/// .bandwidth(0.5)
/// .fill(true)
/// .fill_alpha(0.3)
/// .title("KDE Distribution")
/// .save("kde_configured.png")?;
/// # Ok::<(), Box<dyn std::error::Error>>(())
/// ```
pub fn kde<T, D: Data1D<T>>(self, data: &D) -> PlotBuilder<crate::plots::KdeConfig>
where
T: Into<f64> + Copy,
{
let mut data_vec = Vec::with_capacity(data.len());
for i in 0..data.len() {
if let Some(val) = data.get(i) {
data_vec.push((*val).into());
}
}
PlotBuilder::new(
self,
PlotInput::Single(data_vec),
crate::plots::KdeConfig::default(),
)
}
/// Start building an ECDF (Empirical Cumulative Distribution Function) plot
///
/// Returns a `PlotBuilder<EcdfConfig>` for configuring the ECDF plot.
///
/// # Example
///
/// ```ignore
/// Plot::new()
/// .ecdf(&data)
/// .stat(EcdfStat::Proportion)
/// .show_ci(true)
/// .save("ecdf.png")?;
/// ```
pub fn ecdf<T, D: Data1D<T>>(self, data: &D) -> PlotBuilder<crate::plots::EcdfConfig>
where
T: Into<f64> + Copy,
{
let mut data_vec = Vec::with_capacity(data.len());
for i in 0..data.len() {
if let Some(val) = data.get(i) {
data_vec.push((*val).into());
}
}
PlotBuilder::new(
self,
PlotInput::Single(data_vec),
crate::plots::EcdfConfig::default(),
)
}
/// Add a contour plot for 2D scalar field visualization
///
/// Creates contour lines or filled contours from grid data.
/// Returns a `PlotBuilder<ContourConfig>` for method chaining.
///
/// # Arguments
///
/// * `x` - X coordinates of the grid (1D array)
/// * `y` - Y coordinates of the grid (1D array)
/// * `z` - Z values as a flattened 2D array (row-major, len = x.len() * y.len())
///
/// # Example
///
/// ```rust,no_run
/// use ruviz::prelude::*;
///
/// let x: Vec<f64> = (-50..=50).map(|i| i as f64 / 10.0).collect();
/// let y: Vec<f64> = (-50..=50).map(|i| i as f64 / 10.0).collect();
/// let z: Vec<f64> = y.iter().flat_map(|yv| {
/// x.iter().map(move |xv| (-xv*xv - yv*yv).exp())
/// }).collect();
///
/// Plot::new()
/// .title("Gaussian Surface")
/// .contour(&x, &y, &z)
/// .levels(10)
/// .filled(true)
/// .save("contour.png")?;
/// # Ok::<(), Box<dyn std::error::Error>>(())
/// ```
pub fn contour<X, Y, Z>(self, x: &X, y: &Y, z: &Z) -> PlotBuilder<crate::plots::ContourConfig>
where
X: Data1D<f64>,
Y: Data1D<f64>,
Z: Data1D<f64>,
{
let x_vec: Vec<f64> = (0..x.len()).filter_map(|i| x.get(i).copied()).collect();
let y_vec: Vec<f64> = (0..y.len()).filter_map(|i| y.get(i).copied()).collect();
let z_vec: Vec<f64> = (0..z.len()).filter_map(|i| z.get(i).copied()).collect();
// Convert flat z to 2D grid (row-major)
let ny = y_vec.len();
let nx = x_vec.len();
let z_2d: Vec<Vec<f64>> = (0..ny)
.map(|j| {
(0..nx)
.map(|i| z_vec.get(j * nx + i).copied().unwrap_or(0.0))
.collect()
})
.collect();
PlotBuilder::new(
self,
PlotInput::Grid2D {
x: x_vec,
y: y_vec,
z: z_2d,
},
crate::plots::ContourConfig::default(),
)
}
/// Add a pie chart for proportional data visualization
///
/// Creates a pie chart with optional labels, exploded segments, and donut style.
/// Returns a `PlotBuilder<PieConfig>` for method chaining.
/// When mixed with Cartesian series, the pie chart renders as an inset and
/// can be positioned with the builder's `inset_*` methods.
///
/// # Example
///
/// ```rust,no_run
/// use ruviz::prelude::*;
///
/// let values = vec![35.0, 25.0, 20.0, 15.0, 5.0];
///
/// Plot::new()
/// .title("Market Share")
/// .pie(&values)
/// .labels(&["A", "B", "C", "D", "Other"])
/// .donut(0.4)
/// .save("pie.png")?;
/// # Ok::<(), Box<dyn std::error::Error>>(())
/// ```
pub fn pie<V>(self, values: &V) -> PlotBuilder<crate::plots::PieConfig>
where
V: Data1D<f64>,
{
let values_vec: Vec<f64> = (0..values.len())
.filter_map(|i| values.get(i).copied())
.collect();
PlotBuilder::new(
self,
PlotInput::Single(values_vec),
crate::plots::PieConfig::default(),
)
}
/// Start building a donut chart: a pie with a hole in the middle.
///
/// An entry point of its own, because a donut is a plot type a caller goes
/// looking for by name. It is a pie underneath — this is exactly
/// `.pie(values).donut(DEFAULT_DONUT_INNER_RADIUS)` — so it takes the same
/// chain and the same setters, and `.donut(ratio)` still resizes the hole.
///
/// # Example
///
/// ```rust,ignore
/// Plot::new()
/// .donut(&[30.0, 20.0, 50.0])
/// .label("share")
/// .legend_best()
/// .save("donut.png")?;
/// ```
pub fn donut<V>(self, values: &V) -> PlotBuilder<crate::plots::PieConfig>
where
V: Data1D<f64>,
{
self.pie(values)
.donut(crate::plots::DEFAULT_DONUT_INNER_RADIUS)
}
/// Add a radar/spider chart for multivariate data comparison
///
/// Creates a radar chart with multiple axes arranged in a circle.
/// Returns a `PlotBuilder<RadarConfig>` for method chaining.
/// When mixed with Cartesian series, the radar chart renders as an inset and
/// can be positioned with the builder's `inset_*` methods.
///
/// # Arguments
///
/// * `labels` - Labels for each axis spoke
///
/// # Example
///
/// ```rust,no_run
/// use ruviz::prelude::*;
///
/// Plot::new()
/// .title("Player Stats")
/// .radar(&["Speed", "Power", "Defense", "Magic", "Luck"])
/// .series(&[85.0, 92.0, 78.0, 65.0, 88.0])
/// .label("Player 1")
/// .fill_alpha(0.3)
/// .series(&[72.0, 68.0, 95.0, 82.0, 75.0])
/// .label("Player 2")
/// .fill_alpha(0.3)
/// .save("radar.png")?;
/// # Ok::<(), Box<dyn std::error::Error>>(())
/// ```
pub fn radar<S: AsRef<str>>(self, labels: &[S]) -> PlotBuilder<crate::plots::RadarConfig> {
let label_strings: Vec<String> = labels.iter().map(|s| s.as_ref().to_string()).collect();
let config = crate::plots::RadarConfig::default().labels(label_strings);
PlotBuilder::new(self, PlotInput::Single(vec![]), config)
}
/// Add a Violin plot for visualizing distribution shapes
///
/// Creates a violin plot combining KDE density estimation with optional
/// box/strip components for statistical visualization.
/// Returns a `PlotBuilder<ViolinConfig>` for method chaining with violin-specific options.
///
/// # Example
///
/// ```rust,no_run
/// use ruviz::prelude::*;
///
/// let data: Vec<f64> = (0..200).map(|i| {
/// let x = (i as f64 * 0.1).sin() * 3.0 + 5.0;
/// x
/// }).collect();
///
/// // Simple usage
/// Plot::new()
/// .violin(&data)
/// .save("violin.png")?;
///
/// // With configuration
/// Plot::new()
/// .violin(&data)
/// .show_box(true)
/// .show_median(true)
/// .fill_alpha(0.6)
/// .title("Distribution")
/// .save("violin_configured.png")?;
/// # Ok::<(), Box<dyn std::error::Error>>(())
/// ```
pub fn violin<T, D: Data1D<T>>(self, data: &D) -> PlotBuilder<crate::plots::ViolinConfig>
where
T: Into<f64> + Copy,
{
let data_vec = Self::collect_data1d_into_f64::<T, D>(data);
PlotBuilder::new(
self,
PlotInput::Single(data_vec),
crate::plots::ViolinConfig::default(),
)
}
/// Add a boxen (letter-value) plot for visualizing distribution tails.
///
/// Boxen plots extend box plots by showing multiple quantile boxes, which
/// makes them useful for larger samples where tail structure matters.
///
/// # Example
///
/// ```rust,no_run
/// use ruviz::prelude::*;
///
/// let data: Vec<f64> = (0..500)
/// .map(|i| (i as f64 * 0.05).sin() * 2.0 + i as f64 / 250.0)
/// .collect();
///
/// Plot::new()
/// .boxen(&data)
/// .k_depth(6)
/// .show_outliers(true)
/// .save("boxen.png")?;
/// # Ok::<(), Box<dyn std::error::Error>>(())
/// ```
pub fn boxen<T, D: Data1D<T>>(self, data: &D) -> PlotBuilder<crate::plots::BoxenConfig>
where
T: Into<f64> + Copy,
{
let data_vec = Self::collect_data1d_into_f64::<T, D>(data);
PlotBuilder::new(
self,
PlotInput::Single(data_vec),
crate::plots::BoxenConfig::default(),
)
}
/// Add a quiver plot for visualizing a 2D vector field.
///
/// Quiver plots draw an arrow at each `(x, y)` position. By default `u`
/// and `v` are the vector components. Use [`PlotBuilder::angles_mode`] to
/// treat `u` as an angle in radians and `v` as a magnitude instead.
///
/// # Example
///
/// ```rust,no_run
/// use ruviz::prelude::*;
///
/// let x = vec![0.0, 1.0, 0.0, 1.0];
/// let y = vec![0.0, 0.0, 1.0, 1.0];
/// let u = vec![1.0, 0.4, -0.2, -0.8];
/// let v = vec![0.2, 0.9, 0.7, -0.1];
///
/// Plot::new()
/// .quiver(&x, &y, &u, &v)
/// .arrow_scale(0.25)
/// .pivot(QuiverPivot::Middle)
/// .color_by_magnitude(true)
/// .save("quiver.png")?;
/// # Ok::<(), Box<dyn std::error::Error>>(())
/// ```
pub fn quiver<X, Y, U, V>(
self,
x_data: &X,
y_data: &Y,
u_data: &U,
v_data: &V,
) -> PlotBuilder<crate::plots::QuiverConfig>
where
X: NumericData1D,
Y: NumericData1D,
U: NumericData1D,
V: NumericData1D,
{
let mut plot = self;
let Some(x) = plot.try_collect_numeric_input(x_data) else {
return PlotBuilder::new(
plot,
PlotInput::Quiver {
x: Vec::new(),
y: Vec::new(),
u: Vec::new(),
v: Vec::new(),
},
crate::plots::QuiverConfig::default(),
);
};
let Some(y) = plot.try_collect_numeric_input(y_data) else {
return PlotBuilder::new(
plot,
PlotInput::Quiver {
x,
y: Vec::new(),
u: Vec::new(),
v: Vec::new(),
},
crate::plots::QuiverConfig::default(),
);
};
let Some(u) = plot.try_collect_numeric_input(u_data) else {
return PlotBuilder::new(
plot,
PlotInput::Quiver {
x,
y,
u: Vec::new(),
v: Vec::new(),
},
crate::plots::QuiverConfig::default(),
);
};
let Some(v) = plot.try_collect_numeric_input(v_data) else {
return PlotBuilder::new(
plot,
PlotInput::Quiver {
x,
y,
u,
v: Vec::new(),
},
crate::plots::QuiverConfig::default(),
);
};
PlotBuilder::new(
plot,
PlotInput::Quiver { x, y, u, v },
crate::plots::QuiverConfig::default(),
)
}
/// Add a Polar line plot for visualizing data in polar coordinates
///
/// Creates a polar plot with r (radius) and theta (angle in radians) data.
/// Returns a `PlotBuilder<PolarPlotConfig>` for method chaining with polar-specific options.
/// When mixed with Cartesian series, the polar chart renders as an inset and
/// can be positioned with the builder's `inset_*` methods.
///
/// # Arguments
///
/// * `r` - Radius values (distance from center)
/// * `theta` - Angle values in radians
///
/// # Example
///
/// ```rust,no_run
/// use ruviz::prelude::*;
/// use std::f64::consts::PI;
///
/// // Rose curve
/// let n_points = 200;
/// let theta: Vec<f64> = (0..n_points)
/// .map(|i| i as f64 * 2.0 * PI / n_points as f64)
/// .collect();
/// let r: Vec<f64> = theta.iter().map(|&t| (3.0 * t).cos().abs()).collect();
///
/// Plot::new()
/// .title("Rose Curve")
/// .polar_line(&r, &theta)
/// .fill(true)
/// .fill_alpha(0.3)
/// .save("polar.png")?;
/// # Ok::<(), Box<dyn std::error::Error>>(())
/// ```
pub fn polar_line<R, T>(self, r: &R, theta: &T) -> PlotBuilder<crate::plots::PolarPlotConfig>
where
R: Data1D<f64>,
T: Data1D<f64>,
{
let r_vec: Vec<f64> = (0..r.len()).filter_map(|i| r.get(i).copied()).collect();
let theta_vec: Vec<f64> = (0..theta.len())
.filter_map(|i| theta.get(i).copied())
.collect();
PlotBuilder::new(
self,
PlotInput::XY(r_vec, theta_vec),
crate::plots::PolarPlotConfig::default(),
)
}
// =======================================================================
// Compute-only plot types
//
// Rug, strip, swarm, hexbin and dendrogram ship finished geometry, so they
// all enter through `SeriesType::Computed` and the one
// `ComputedSeries` trait rather than through a variant each. Adding another
// such plot type costs a method here, a `finalize()` below and an
// `impl ComputedSeries` — no render arm, no bounds arm, no axis-scale
// entry, and no way to wire it into one backend and not the other.
// =======================================================================
/// Start building a rug plot: one short mark per sample, along an axis.
///
/// Returns a [`PlotBuilder`]`<RugConfig>`, the same builder shape every
/// other series returns, so it joins the usual chain.
///
/// # Example
///
/// ```rust,ignore
/// Plot::new()
/// .rug(&samples)
/// .label("observations")
/// .color(Color::from_rgb(0, 0, 200))
/// .legend_best()
/// .save("rug.png")?;
/// ```
pub fn rug<T, D: Data1D<T>>(
self,
data: &D,
) -> PlotBuilder<crate::plots::distribution::RugConfig>
where
T: Into<f64> + Copy,
{
let values = Self::collect_data1d_into_f64::<T, D>(data);
PlotBuilder::new(
self,
PlotInput::Single(values),
crate::plots::distribution::RugConfig::default(),
)
}
/// Start building a strip plot: a jittered scatter of every observation,
/// grouped by category.
///
/// `categories` names the category of each observation, so the two slices
/// have the same length — the seaborn `stripplot(x=..., y=...)` shape.
/// Categories take slots `0, 1, 2 …` in order of first appearance.
///
/// # Example
///
/// ```rust,ignore
/// Plot::new()
/// .strip(&["a", "a", "b"], &[1.0, 2.0, 3.0])
/// .label("samples")
/// .legend_best()
/// .save("strip.png")?;
/// ```
pub fn strip<S: AsRef<str>, D: NumericData1D>(
mut self,
categories: &[S],
values: &D,
) -> PlotBuilder<crate::plots::categorical::StripConfig> {
let (categories, values) = self.collect_categorical_observations(categories, values);
PlotBuilder::new(
self,
PlotInput::Categorical { categories, values },
crate::plots::categorical::StripConfig::default(),
)
}
/// Start building a swarm plot: like [`Plot::strip`], but the points are
/// nudged sideways so none of them overlap.
///
/// Takes the same pair of slices as [`Plot::strip`].
pub fn swarm<S: AsRef<str>, D: NumericData1D>(
mut self,
categories: &[S],
values: &D,
) -> PlotBuilder<crate::plots::categorical::SwarmConfig> {
let (categories, values) = self.collect_categorical_observations(categories, values);
PlotBuilder::new(
self,
PlotInput::Categorical { categories, values },
crate::plots::categorical::SwarmConfig::default(),
)
}
/// Start building a hexbin plot: a 2D density map on a hexagonal grid.
///
/// # Example
///
/// ```rust,ignore
/// Plot::new()
/// .hexbin(&x, &y)
/// .gridsize(40)
/// .label("density")
/// .save("hexbin.png")?;
/// ```
pub fn hexbin<X: NumericData1D, Y: NumericData1D>(
self,
x: &X,
y: &Y,
) -> PlotBuilder<crate::plots::continuous::hexbin::HexbinConfig> {
let (plot, x_values, y_values) = self.collect_xy_for_derived_series(x, y);
PlotBuilder::new(
plot,
PlotInput::XY(x_values, y_values),
crate::plots::continuous::hexbin::HexbinConfig::default(),
)
}
/// Start building a dendrogram from a hierarchical clustering result.
///
/// # Example
///
/// ```rust,ignore
/// let tree = ruviz::stats::clustering::linkage(&distances, LinkageMethod::Ward);
/// Plot::new()
/// .dendrogram(&tree)
/// .label("clusters")
/// .save("dendrogram.png")?;
/// ```
pub fn dendrogram(
self,
linkage: &crate::stats::clustering::Linkage,
) -> PlotBuilder<crate::plots::hierarchical::DendrogramConfig> {
PlotBuilder::new(
self,
PlotInput::Linkage(linkage.clone()),
crate::plots::hierarchical::DendrogramConfig::default(),
)
}
// =======================================================================
// Multi-series plot types
//
// Grouped bar, stacked bar and stacked area are the only plot types that
// take *several* value columns. They take them as `(name, values)` pairs
// because there are N of them and `PlotBuilder::label` holds one — and
// each pair becomes an ordinary series when the builder finalizes: its own
// `PlotSeries`, its own palette slot from `push_builder_series`, its own
// legend entry. So the series count is the only thing that changes about
// these three; the chain does not:
//
// .grouped_bar(&categories, &[("2023", &a), ("2024", &b)])
// .label(..).color(..).legend_best().save(..)
//
// The alternative — one series holding the whole chart — would have needed
// its own palette rule, its own legend expansion and its own bounds arm,
// which is exactly the per-plot-type divergence the rest of this file
// exists to prevent.
// =======================================================================
/// Start building a grouped bar chart: several named value columns drawn
/// side by side within each category.
///
/// `categories` names the columns of the x axis; each entry of `series` is
/// one named value column with one value per category. Every column takes
/// the next palette colour and gets its own legend entry, which is the
/// point of a grouped chart.
///
/// A group occupies exactly one category slot — the same one-unit-wide slot
/// a single [`Plot::bar`] bar, a box plot or a violin takes — subdivided
/// between the columns.
///
/// # Naming and styling
///
/// The name in each pair is that column's legend label. `.label(..)` names
/// any column passed an empty name, and `.color(..)` colours every column
/// the same (leave it off to get one palette colour per column) — the usual
/// "an explicit setting wins over the palette" rule, applied N times.
///
/// # Example
///
/// ```rust,ignore
/// Plot::new()
/// .grouped_bar(&["Q1", "Q2", "Q3"], &[("2023", &last), ("2024", &this)])
/// .bar_gap(0.05)
/// .legend_best()
/// .save("grouped_bar.png")?;
/// ```
pub fn grouped_bar<C, S, V>(
mut self,
categories: &[C],
series: &[(S, V)],
) -> PlotBuilder<crate::plots::categorical::GroupedBarConfig>
where
C: ToString,
S: ToString,
V: NumericData1D,
{
let input = self.collect_named_series(
MultiSeriesAxis::Categories(categories.iter().map(ToString::to_string).collect()),
series,
);
PlotBuilder::new(
self,
PlotInput::MultiSeries(input),
crate::plots::categorical::GroupedBarConfig::default(),
)
}
/// Start building a stacked bar chart: several named value columns stacked
/// on top of one another within each category.
///
/// Takes exactly the same pair of arguments as [`Plot::grouped_bar`], and
/// follows the same naming and styling rules; the only difference is where
/// the bars end up.
///
/// Positive contributions stack upwards from the baseline and negative ones
/// downwards, so a column that dips below zero does not eat into the stack
/// above it.
///
/// # Example
///
/// ```rust,ignore
/// Plot::new()
/// .stacked_bar(&["Q1", "Q2"], &[("hardware", &hw), ("services", &sv)])
/// .legend_best()
/// .save("stacked_bar.png")?;
/// ```
pub fn stacked_bar<C, S, V>(
mut self,
categories: &[C],
series: &[(S, V)],
) -> PlotBuilder<crate::plots::categorical::StackedBarConfig>
where
C: ToString,
S: ToString,
V: NumericData1D,
{
let input = self.collect_named_series(
MultiSeriesAxis::Categories(categories.iter().map(ToString::to_string).collect()),
series,
);
PlotBuilder::new(
self,
PlotInput::MultiSeries(input),
crate::plots::categorical::StackedBarConfig::default(),
)
}
/// Start building a stacked area chart: several named value columns filled
/// on top of one another over a shared numeric x axis.
///
/// The categorical twin is [`Plot::stacked_bar`]; this one shares
/// [`Plot::grouped_bar`]'s naming and styling rules, with numeric `x`
/// positions in place of category names.
///
/// # Example
///
/// ```rust,ignore
/// Plot::new()
/// .stacked_area(&years, &[("solar", &solar), ("wind", &wind)])
/// .legend_best()
/// .save("stacked_area.png")?;
/// ```
pub fn stacked_area<X, S, V>(
mut self,
x: &X,
series: &[(S, V)],
) -> PlotBuilder<crate::plots::continuous::StackPlotConfig>
where
X: NumericData1D,
S: ToString,
V: NumericData1D,
{
let positions = self.collect_numeric_input(x);
let input = self.collect_named_series(MultiSeriesAxis::Positions(positions), series);
PlotBuilder::new(
self,
PlotInput::MultiSeries(input),
crate::plots::continuous::StackPlotConfig::default(),
)
}
/// Collect `(name, values)` pairs into the one multi-series input shape.
///
/// Shared by [`Plot::grouped_bar`], [`Plot::stacked_bar`] and
/// [`Plot::stacked_area`] so the three cannot come to disagree about what a
/// short or long value column means: a column has to be as long as the
/// shared axis, and one that is not is reported as a length mismatch rather
/// than silently truncated to fit.
fn collect_named_series<S, V>(
&mut self,
axis: MultiSeriesAxis,
series: &[(S, V)],
) -> MultiSeriesInput
where
S: ToString,
V: NumericData1D,
{
let expected = axis.len();
let mut collected = Vec::with_capacity(series.len());
for (name, values) in series {
let values = self.collect_numeric_input(values);
if values.len() != expected {
self.set_pending_ingestion_error(PlottingError::DataLengthMismatch {
x_len: expected,
y_len: values.len(),
series_index: Some(collected.len()),
});
}
collected.push((name.to_string(), values));
}
MultiSeriesInput {
axis,
series: collected,
}
}
/// Commit one multi-series plot type's columns as N ordinary series.
///
/// The name each column was passed is its own label; the builder's
/// `.label(..)` supplies one for a column that was passed an empty name.
/// Everything else — the palette slot, the styling, the legend entry —
/// comes from the same `push_computed_series` funnel every single-series
/// plot type uses, so a grouped chart's columns are styled
/// and coloured exactly like N separate `.line(..)` calls.
fn push_named_sub_series<D>(mut self, columns: Vec<(String, D)>, style: SeriesStyle) -> Self
where
D: crate::plots::traits::ComputedSeries + 'static,
{
for (name, data) in columns {
let mut column_style = style.clone();
if !name.is_empty() {
column_style.label = Some(name);
}
self = self.push_computed_series(data, column_style);
}
self
}
/// Collect one `(category name, value)` observation per element.
///
/// Shared by [`Plot::strip`] and [`Plot::swarm`] so the two cannot disagree
/// about what a mismatched pair of slices means.
fn collect_categorical_observations<S: AsRef<str>, D: NumericData1D>(
&mut self,
categories: &[S],
values: &D,
) -> (Vec<String>, Vec<f64>) {
let values = self.collect_numeric_input(values);
if !values.is_empty() && categories.len() != values.len() {
self.set_pending_ingestion_error(PlottingError::DataLengthMismatch {
x_len: categories.len(),
y_len: values.len(),
series_index: None,
});
}
let categories = categories
.iter()
.map(|category| category.as_ref().to_string())
.collect();
(categories, values)
}
/// Record an ingestion failure and hand the plot back, so a builder's
/// `finalize()` stays a single expression.
///
/// The error surfaces at `render()`/`save()` like every other ingestion
/// failure, rather than the series vanishing without explanation.
fn with_ingestion_error(mut self, error: PlottingError) -> Self {
self.set_pending_ingestion_error(error);
self
}
/// Commit a plot type that ships finished geometry.
///
/// Goes through the same [`series_from_style`] and the same palette rule as
/// every other series, so a compute-only plot type is styled and coloured
/// identically to a line — there is no per-type series constructor.
fn push_computed_series<C>(self, data: C, style: SeriesStyle) -> Self
where
C: crate::plots::traits::ComputedSeries + 'static,
{
self.push_builder_series(series_from_style(
SeriesType::Computed {
data: Arc::new(data),
},
style,
))
}
/// Commit a finalized builder series, assigning the next palette slot.
///
/// Every plot type spells series styling the same way, so the palette rule
/// lives here once: a series that chose no colour takes the next auto-colour
/// slot and advances the counter, an explicitly coloured one leaves the
/// counter alone so the next automatic series keeps the palette order the
/// caller sees.
pub(super) fn push_builder_series(mut self, series: PlotSeries) -> Self {
let auto_color_slot = if series.props.color.is_set() {
None
} else {
let slot = self.series_mgr.auto_color_index;
self.series_mgr.auto_color_index += 1;
Some(slot)
};
self.series_mgr
.push_with_auto_color_slot(series, auto_color_slot);
self
}
}
/// Build a [`PlotSeries`] from a series type and the builder's accumulated style.
///
/// The [`SeriesStyle`] to [`PlotSeries`] mapping is identical for every plot
/// type, so it is written once here instead of being restated per plot type —
/// which is what let the old per-type constructors drift apart.
pub(super) fn series_from_style(series_type: SeriesType, style: SeriesStyle) -> PlotSeries {
// A non-Cartesian series is always drawn into an inset, so it always carries
// a placement — an untouched one being `None` here and the default there is
// exactly the drift that had pie, radar and polar each defaulting it in
// their own constructor while every other plot type did not.
let inset_layout = if Plot::is_non_cartesian_series_type(&series_type) {
Some(style.inset_layout.unwrap_or_default().normalized())
} else {
style.inset_layout
};
PlotSeries {
series_type,
streaming_source: style.streaming_source,
label: style.label,
props: style.props,
marker_edge: None,
y_errors: style.y_errors,
x_errors: style.x_errors,
error_config: style.error_config,
inset_layout,
group_id: None,
resolved_radar_colors: None,
}
}
impl PlotBuilder<HistogramConfig> {
/// Bin the data with the configuration as it stands and add the series.
///
/// Binning happens here rather than in [`Plot::histogram`] so that every
/// builder setter called in between still affects the bins.
pub(super) fn finalize(self) -> Plot {
let PlotBuilder {
mut plot,
input,
config,
style,
} = self;
let (data, prepared) = match input {
PlotInput::Single(values) => {
let prepared = match crate::plots::histogram::calculate_histogram(&values, &config)
{
Ok(prepared) => Some(prepared),
Err(err) => {
plot.set_pending_ingestion_error(PlottingError::RenderError(
err.to_string(),
));
None
}
};
(PlotData::Static(values), prepared)
}
// Source-backed values are only known at render time, so they are
// binned then rather than here.
PlotInput::SingleSource(source) => (source, None),
_ => (PlotData::Static(Vec::new()), None),
};
plot.push_builder_series(series_from_style(
SeriesType::Histogram {
data,
config,
prepared,
},
style,
))
}
}
impl PlotBuilder<BoxPlotConfig> {
/// Add the configured box plot series to the plot.
pub(super) fn finalize(self) -> Plot {
let PlotBuilder {
plot,
input,
config,
style,
} = self;
let data = match input {
PlotInput::Single(values) => PlotData::Static(values),
PlotInput::SingleSource(source) => source,
_ => PlotData::Static(Vec::new()),
};
// Through `add_box_plot_series`, the same door violin and boxen use, so
// the box claims its category slot at add time like they do.
plot.add_box_plot_series(data, config, style)
}
}
impl PlotBuilder<crate::plots::heatmap::HeatmapConfig> {
/// Map the grid to colours with the configuration as it stands, then add it.
///
/// The colour mapping happens here rather than in [`Plot::heatmap`] so that
/// every builder setter called in between still affects it.
pub(super) fn finalize(self) -> Plot {
let PlotBuilder {
mut plot,
input,
config,
style,
} = self;
let rows = match input {
PlotInput::Grid2D { z, .. } => z,
_ => Vec::new(),
};
let n_rows = rows.len();
let n_cols = rows.first().map_or(0, Vec::len);
let flat: Vec<f64> = rows.into_iter().flatten().collect();
let data = match crate::plots::heatmap::process_heatmap_flat(&flat, n_rows, n_cols, config)
{
Ok(data) => Arc::new(data),
Err(message) => {
// Chaining continues on invalid data; the error surfaces from
// the terminal render/save call.
plot.set_pending_ingestion_error(PlottingError::DataExtractionFailed {
origin: "heatmap".to_string(),
message,
});
Arc::new(crate::plots::heatmap::HeatmapData {
values: vec![vec![0.0]],
n_rows: 1,
n_cols: 1,
data_min: 0.0,
data_max: 0.0,
vmin: 0.0,
vmax: 1.0,
x_extent: (0.0, 1.0),
y_extent: (0.0, 1.0),
config: crate::plots::heatmap::HeatmapConfig::default(),
})
}
};
plot.push_builder_series(series_from_style(SeriesType::Heatmap { data }, style))
}
}
impl PlotBuilder<ErrorBarConfig> {
/// Add the configured error bar series to the plot.
pub(super) fn finalize(self) -> Plot {
let PlotBuilder {
plot,
input,
config,
mut style,
} = self;
let (x_data, y_data, x_errors, y_errors) = match input {
PlotInput::ErrorBars {
x,
y,
x_errors,
y_errors,
} => (x, y, x_errors, y_errors),
_ => (
PlotData::Static(Vec::new()),
PlotData::Static(Vec::new()),
None,
None,
),
};
let y_errors = y_errors.unwrap_or_else(|| PlotData::Static(Vec::new()));
// Whether X error data was supplied is what distinguishes the two error
// bar series types; `with_xerr()` on the builder attaches X errors to a
// Y-only series without changing which type it is.
let series_type = match x_errors {
Some(x_errors) => SeriesType::ErrorBarsXY {
x_data,
y_data,
x_errors,
y_errors,
},
None => SeriesType::ErrorBars {
x_data,
y_data,
y_errors,
},
};
// An explicit `error_config()` replaces the whole configuration, so it
// wins over the individual setters recorded on `config`.
if style.error_config.is_none() {
style.error_config = Some(config);
}
plot.push_builder_series(series_from_style(series_type, style))
}
}
// ===========================================================================
// Compute-only plot types: builder setters and `finalize()`
//
// Every one of these computes in `finalize()` rather than in the `Plot::`
// method, so a setter called anywhere in the chain still affects the result.
// The setters below forward to the config's own; the shared
// `.label()/.color()/.alpha()/.line_width()` on `PlotBuilder<C>` cover the
// styling every series has in common, and each plot type's renderer already
// treats those as the override for its own defaults.
// ===========================================================================
impl PlotBuilder<crate::plots::distribution::RugConfig> {
/// Mark height as a fraction of the axis range (default `0.05`).
pub fn height(mut self, height: f32) -> Self {
self.config = std::mem::take(&mut self.config).height(height);
self
}
/// Which axis the marks sit against.
pub fn axis(mut self, axis: crate::plots::distribution::RugAxis) -> Self {
self.config = std::mem::take(&mut self.config).axis(axis);
self
}
/// Lift the marks off the axis by a fraction of the axis range.
pub fn offset(mut self, offset: f32) -> Self {
self.config = std::mem::take(&mut self.config).offset(offset);
self
}
pub(super) fn finalize(self) -> Plot {
let PlotBuilder {
plot,
input,
config,
style,
} = self;
let values = match input {
PlotInput::Single(values) => values,
_ => Vec::new(),
};
match <crate::plots::distribution::Rug as crate::plots::traits::PlotCompute>::compute(
values.as_slice(),
&config,
) {
Ok(data) => plot.push_computed_series(data, style),
Err(error) => plot.with_ingestion_error(error),
}
}
}
impl PlotBuilder<crate::plots::categorical::StripConfig> {
/// Jitter width as a fraction of the category slot (default `0.3`).
pub fn jitter(mut self, jitter: f64) -> Self {
self.config = std::mem::take(&mut self.config).jitter(jitter);
self
}
/// Marker size in points.
pub fn marker_size(mut self, size: f32) -> Self {
self.config = std::mem::take(&mut self.config).size(size);
self
}
/// Lay the categories along the y axis instead of the x axis.
pub fn horizontal(mut self) -> Self {
self.config = std::mem::take(&mut self.config).horizontal();
self
}
/// Seed for the jitter, so a figure redraws identically.
pub fn seed(mut self, seed: u64) -> Self {
self.config = std::mem::take(&mut self.config).seed(seed);
self
}
pub(super) fn finalize(self) -> Plot {
let PlotBuilder {
plot,
input,
config,
style,
} = self;
let (categories, values) = categorical_observations(input);
let (slots, names) = category_slot_indices(&categories);
let input = crate::plots::categorical::StripInput::new(&slots, &values).with_names(&names);
match <crate::plots::categorical::Strip as crate::plots::traits::PlotCompute>::compute(
input, &config,
) {
Ok(data) => plot.push_computed_series(data, style),
Err(error) => plot.with_ingestion_error(error),
}
}
}
impl PlotBuilder<crate::plots::categorical::SwarmConfig> {
/// Marker size in points.
pub fn marker_size(mut self, size: f32) -> Self {
self.config = std::mem::take(&mut self.config).size(size);
self
}
/// Widest the swarm may spread, as a fraction of the category slot.
pub fn width(mut self, width: f64) -> Self {
self.config = std::mem::take(&mut self.config).width(width);
self
}
/// Lay the categories along the y axis instead of the x axis.
pub fn horizontal(mut self) -> Self {
self.config = std::mem::take(&mut self.config).horizontal();
self
}
pub(super) fn finalize(self) -> Plot {
let PlotBuilder {
plot,
input,
config,
style,
} = self;
let (categories, values) = categorical_observations(input);
let (slots, names) = category_slot_indices(&categories);
let input = crate::plots::categorical::SwarmInput::new(&slots, &values).with_names(&names);
match <crate::plots::categorical::Swarm as crate::plots::traits::PlotCompute>::compute(
input, &config,
) {
Ok(data) => plot.push_computed_series(data, style),
Err(error) => plot.with_ingestion_error(error),
}
}
}
impl PlotBuilder<crate::plots::continuous::hexbin::HexbinConfig> {
/// Number of hexagons across the x axis.
pub fn gridsize(mut self, size: usize) -> Self {
self.config = std::mem::take(&mut self.config).gridsize(size);
self
}
/// Colormap, by name or as a [`ColorMap`](crate::render::ColorMap).
pub fn cmap(mut self, cmap: impl Into<crate::render::ColorMapSpec>) -> Self {
self.config = std::mem::take(&mut self.config).cmap(cmap);
self
}
/// How the points inside one hexagon are reduced to its value.
pub fn reduce_fn(mut self, reduce: crate::plots::continuous::hexbin::ReduceFunction) -> Self {
self.config = std::mem::take(&mut self.config).reduce_fn(reduce);
self
}
/// Hide hexagons holding fewer than this many points.
pub fn mincnt(mut self, count: usize) -> Self {
self.config = std::mem::take(&mut self.config).mincnt(count);
self
}
/// Colour the bins on a logarithmic value scale.
pub fn log_scale(mut self, log_scale: bool) -> Self {
self.config = std::mem::take(&mut self.config).log_scale(log_scale);
self
}
/// Outline every hexagon in this colour.
pub fn edge_color(mut self, color: Color) -> Self {
self.config = std::mem::take(&mut self.config).edge_color(color);
self
}
// `colorbar`, `colorbar_label`, `colorbar_tick_font_size` and
// `colorbar_label_font_size` come from `impl_colorbar_builder_methods!`,
// which every plot type that draws a colour key shares.
pub(super) fn finalize(self) -> Plot {
let PlotBuilder {
plot,
input,
config,
style,
} = self;
let (x, y) = match input {
PlotInput::XY(x, y) => (x, y),
_ => (Vec::new(), Vec::new()),
};
let input = crate::plots::continuous::hexbin::HexbinInput::new(&x, &y);
match <crate::plots::continuous::hexbin::Hexbin as crate::plots::traits::PlotCompute>::compute(
input, &config,
) {
Ok(data) => plot.push_computed_series(data, style),
Err(error) => plot.with_ingestion_error(error),
}
}
}
impl PlotBuilder<crate::plots::hierarchical::DendrogramConfig> {
/// Which way the tree hangs.
pub fn orientation(
mut self,
orientation: crate::plots::hierarchical::DendrogramOrientation,
) -> Self {
self.config = std::mem::take(&mut self.config).orientation(orientation);
self
}
// `.labels()` and `.show_labels()` are deliberately NOT forwarded: the
// renderer draws links, not text, so a builder setter for leaf labels would
// be a knob that changes nothing. `DendrogramConfig::labels` still fills
// `DendrogramPlotData::labels` for callers laying the text out themselves.
pub(super) fn finalize(self) -> Plot {
let PlotBuilder {
plot,
input,
config,
style,
} = self;
let PlotInput::Linkage(linkage) = input else {
return plot.with_ingestion_error(PlottingError::EmptyDataSet);
};
let data = crate::plots::hierarchical::compute_dendrogram(&linkage, &config);
plot.push_computed_series(data, style)
}
}
// ===========================================================================
// Multi-series plot types: builder setters and `finalize()`
//
// Each of the three computes in `finalize()` rather than in the `Plot::`
// method, so a setter called anywhere in the chain still affects the geometry,
// and each ends by handing its columns to `push_named_sub_series` — the one
// place N columns become N ordinary series.
// ===========================================================================
/// The `(axis, names, values)` a multi-series builder finalizes from.
///
/// `None` for an empty chart or an input shape the builder never constructs,
/// which the callers turn into an error rather than a silently blank figure.
fn take_multi_series(input: PlotInput) -> Option<(MultiSeriesAxis, Vec<String>, Vec<Vec<f64>>)> {
let PlotInput::MultiSeries(MultiSeriesInput { axis, series }) = input else {
return None;
};
if series.is_empty() || axis.is_empty() {
return None;
}
let (names, values) = series.into_iter().unzip();
Some((axis, names, values))
}
/// The category names a bar-shaped multi-series builder was given.
fn multi_series_categories(axis: MultiSeriesAxis) -> Vec<String> {
match axis {
MultiSeriesAxis::Categories(names) => names,
// `grouped_bar`/`stacked_bar` only ever build `Categories`; a numeric
// axis here would mean the builder was constructed by something else.
MultiSeriesAxis::Positions(positions) => {
positions.iter().map(|value| value.to_string()).collect()
}
}
}
impl PlotBuilder<crate::plots::categorical::GroupedBarConfig> {
/// Fraction of a category slot the whole group fills (default `0.8`).
///
/// The remainder is the gutter between neighbouring groups, exactly as
/// `.bar_width(..)` works for a single bar series.
pub fn group_width(mut self, width: f32) -> Self {
self.config = std::mem::take(&mut self.config).group_width(f64::from(width));
self
}
/// Gap between bars inside one group, as a fraction of a category slot
/// (default `0.05`).
pub fn bar_gap(mut self, gap: f32) -> Self {
self.config = std::mem::take(&mut self.config).bar_gap(f64::from(gap));
self
}
/// Outline colour for every bar. Bars have no outline unless one is set.
pub fn edge_color(mut self, color: Color) -> Self {
self.config = std::mem::take(&mut self.config).edge_color(color);
self
}
/// Outline width in points (default `0.0`, i.e. no outline).
pub fn edge_width(mut self, width: f32) -> Self {
self.config.edge_width = width.max(0.0);
self
}
/// Lay the categories along the y axis, so the bars run left to right.
///
/// The shared category axis is the x axis, so a horizontal chart's
/// categories are not labelled yet — the same gap a horizontal strip plot
/// has.
pub fn horizontal(mut self) -> Self {
self.config = std::mem::take(&mut self.config).horizontal();
self
}
pub(super) fn finalize(self) -> Plot {
let PlotBuilder {
plot,
input,
config,
style,
} = self;
let Some((axis, names, values)) = take_multi_series(input) else {
return plot.with_ingestion_error(PlottingError::EmptyDataSet);
};
let categories = multi_series_categories(axis);
let columns = crate::plots::categorical::bar::grouped_bar_series(
&categories,
&names,
&values,
&config,
);
plot.push_named_sub_series(columns, style)
}
}
impl PlotBuilder<crate::plots::categorical::StackedBarConfig> {
/// Bar width as a fraction of a category slot (default `0.8`).
///
/// Spelled and typed exactly like `.bar_width(..)` on a single bar series,
/// because it is the same knob.
pub fn bar_width(mut self, width: f32) -> Self {
self.config = std::mem::take(&mut self.config).width(f64::from(width));
self
}
/// Outline colour for every bar. Bars have no outline unless one is set.
pub fn edge_color(mut self, color: Color) -> Self {
self.config = std::mem::take(&mut self.config).edge_color(color);
self
}
/// Outline width in points (default `0.0`, i.e. no outline).
pub fn edge_width(mut self, width: f32) -> Self {
self.config.edge_width = width.max(0.0);
self
}
/// Lay the categories along the y axis, so the bars run left to right.
///
/// The shared category axis is the x axis, so a horizontal chart's
/// categories are not labelled yet — the same gap a horizontal strip plot
/// has.
pub fn horizontal(mut self) -> Self {
self.config = std::mem::take(&mut self.config).horizontal();
self
}
pub(super) fn finalize(self) -> Plot {
let PlotBuilder {
plot,
input,
config,
style,
} = self;
let Some((axis, names, values)) = take_multi_series(input) else {
return plot.with_ingestion_error(PlottingError::EmptyDataSet);
};
let categories = multi_series_categories(axis);
let columns = crate::plots::categorical::bar::stacked_bar_series(
&categories,
&names,
&values,
&config,
);
plot.push_named_sub_series(columns, style)
}
}
impl PlotBuilder<crate::plots::continuous::StackPlotConfig> {
/// Where the stack sits: on zero, or centred like a streamgraph.
pub fn baseline(mut self, baseline: crate::plots::continuous::StackBaseline) -> Self {
self.config = std::mem::take(&mut self.config).baseline(baseline);
self
}
/// Stroke a separator along the top of every band but the last.
///
/// The top band's upper edge is the silhouette of the chart rather than a
/// boundary between two bands, so it is never stroked. The stroke width
/// comes from the chain's `.line_width(..)` when one is set, and from the
/// config's own otherwise.
pub fn lines(mut self, show: bool) -> Self {
self.config = std::mem::take(&mut self.config).lines(show);
self
}
/// Colour of the separators drawn by [`lines`](Self::lines).
pub fn line_color(mut self, color: Color) -> Self {
self.config.line_color = color;
self
}
pub(super) fn finalize(self) -> Plot {
let PlotBuilder {
plot,
input,
config,
style,
} = self;
let Some((axis, names, values)) = take_multi_series(input) else {
return plot.with_ingestion_error(PlottingError::EmptyDataSet);
};
let MultiSeriesAxis::Positions(x) = axis else {
return plot.with_ingestion_error(PlottingError::EmptyDataSet);
};
let columns =
crate::plots::continuous::area::stacked_area_bands(&x, &names, &values, &config);
plot.push_named_sub_series(columns, style)
}
}
/// The `(category name, value)` pairs a strip or swarm builder collected.
fn categorical_observations(input: PlotInput) -> (Vec<String>, Vec<f64>) {
match input {
PlotInput::Categorical { categories, values } => (categories, values),
_ => (Vec::new(), Vec::new()),
}
}
/// Map category names onto the slot indices the layout uses.
///
/// A name takes the slot it was first seen in, so repeating a category groups
/// its observations and the slots run `0, 1, 2 …` in order of first appearance
/// — the same left-to-right rule a bar chart follows.
///
/// Returns the per-observation slot **and** the distinct names in slot order.
/// Both halves have to travel together: the names are what the category axis
/// prints, and dropping them here is what used to leave a strip plot labelled
/// `-0.5, 0, 0.5 …` when the caller had passed `["A", "B", "C"]`.
fn category_slot_indices(categories: &[String]) -> (Vec<usize>, Vec<String>) {
let mut order: Vec<String> = Vec::new();
let slots = categories
.iter()
.map(|category| {
let existing = order.iter().position(|seen| seen == category);
match existing {
Some(index) => index,
None => {
order.push(category.clone());
order.len() - 1
}
}
})
.collect();
(slots, order)
}
#[cfg(test)]
mod tests {
use super::*;
use crate::core::{Annotation, ArrowStyle, FillStyle};
use crate::render::{Color, Theme};
const X: [f64; 3] = [0.0, 1.0, 2.0];
const Y: [f64; 3] = [1.0, 2.0, 3.0];
fn fill_styles(plot: &Plot) -> Vec<&FillStyle> {
plot.annotations
.iter()
.filter_map(|annotation| match annotation {
Annotation::FillBetween { style, .. } => Some(style),
_ => None,
})
.collect()
}
fn arrow_colors(plot: &Plot) -> Vec<Color> {
plot.annotations
.iter()
.filter_map(|annotation| match annotation {
Annotation::Arrow { style, .. } => Some(style.color),
_ => None,
})
.collect()
}
#[test]
fn test_area_fill_inherits_series_palette_color() {
let x = X.to_vec();
let y = Y.to_vec();
let plot: Plot = Plot::new().area(&x, &y, 0.0).into();
let styles = fill_styles(&plot);
assert_eq!(styles.len(), 1);
assert_eq!(styles[0].color, plot.display.theme().get_color(0));
// The old default was Color::BLUE @ 0.3 regardless of the curve.
assert_ne!(styles[0].color, FillStyle::default().color);
assert!((styles[0].alpha - AREA_FILL_ALPHA).abs() < 1e-6);
}
#[test]
fn test_area_fill_still_spans_curve_to_baseline() {
let x = X.to_vec();
let y = Y.to_vec();
let plot: Plot = Plot::new().area(&x, &y, -1.0).into();
let Some(Annotation::FillBetween { x: fx, y1, y2, .. }) = plot
.annotations
.iter()
.find(|annotation| matches!(annotation, Annotation::FillBetween { .. }))
else {
panic!("area() must emit a FillBetween annotation");
};
assert_eq!(fx, &x);
assert_eq!(y1, &y);
assert_eq!(y2, &vec![-1.0; x.len()]);
}
#[test]
fn test_stem_lines_inherit_series_palette_color() {
let x = X.to_vec();
let y = Y.to_vec();
let plot: Plot = Plot::new().stem(&x, &y, 0.0).into();
let expected = plot.display.theme().get_color(0);
let colors = arrow_colors(&plot);
assert_eq!(colors.len(), x.len());
assert!(colors.iter().all(|color| *color == expected));
// The old default was the uncoloured ArrowStyle.
assert_ne!(colors[0], ArrowStyle::default().color);
}
fn arrows(plot: &Plot) -> Vec<&Annotation> {
plot.annotations
.iter()
.filter(|annotation| matches!(annotation, Annotation::Arrow { .. }))
.collect()
}
#[test]
fn test_stem_plot_draws_its_stems_under_its_markers() {
let x = X.to_vec();
let y = Y.to_vec();
let plot: Plot = Plot::new().stem(&x, &y, 0.0).into();
let stems = arrows(&plot);
assert_eq!(stems.len(), x.len());
// Rendering order is underlay annotations -> series -> overlay
// annotations, so classifying the stems as underlay is what keeps them
// beneath the marker series they belong to.
assert!(stems.iter().copied().all(Plot::is_underlay_annotation));
assert!(!stems.iter().copied().any(Plot::is_overlay_annotation));
assert_eq!(plot.series_mgr.len(), 1);
}
#[test]
fn test_user_headless_arrow_stays_in_the_overlay() {
use crate::core::ArrowHead;
let x = X.to_vec();
let y = Y.to_vec();
// A plain pointer line drawn with the public API: no heads, but still a
// caller annotation, so it must paint over the data as it always did.
let plot: Plot = Plot::new()
.line(&x, &y)
.arrow_styled(
0.0,
0.0,
1.0,
1.0,
ArrowStyle::new()
.head_style(ArrowHead::None)
.tail_style(ArrowHead::None),
)
.into();
let user_arrows = arrows(&plot);
assert_eq!(user_arrows.len(), 1);
assert!(Plot::is_overlay_annotation(user_arrows[0]));
assert!(!Plot::is_underlay_annotation(user_arrows[0]));
}
#[test]
fn test_stem_provenance_is_not_inferred_from_the_arrow_head_style() {
use crate::core::ArrowHead;
let x = X.to_vec();
let y = Y.to_vec();
// Both arrows are headless; only the stems are structural.
let plot: Plot = Plot::new()
.stem(&x, &y, 0.0)
.arrow_styled(
0.0,
0.0,
1.0,
1.0,
ArrowStyle::new()
.head_style(ArrowHead::None)
.tail_style(ArrowHead::None),
)
.into();
let all = arrows(&plot);
assert_eq!(all.len(), x.len() + 1);
let underlay = all
.iter()
.copied()
.filter(|arrow| Plot::is_underlay_annotation(arrow))
.count();
assert_eq!(underlay, x.len());
// The caller's arrow was pushed last and is the only overlay one.
let last = *all.last().expect("arrow annotations were pushed");
assert!(Plot::is_overlay_annotation(last));
}
#[test]
fn test_area_uses_the_slot_of_its_own_series_not_the_next_one() {
let x = X.to_vec();
let y = Y.to_vec();
let plot: Plot = Plot::new().line(&x, &y).line(&x, &y).into();
assert_eq!(plot.series_mgr.len(), 2);
let theme = plot.display.theme().clone();
let plot: Plot = plot.area(&x, &y, 0.0).into();
// The area's own line series is the third one, so slot 2.
let styles = fill_styles(&plot);
assert_eq!(styles.len(), 1);
assert_eq!(styles[0].color, theme.get_color(2));
assert_ne!(styles[0].color, theme.get_color(1));
assert_ne!(styles[0].color, theme.get_color(3));
}
#[test]
fn test_stem_uses_the_slot_of_its_own_series_not_the_next_one() {
let x = X.to_vec();
let y = Y.to_vec();
let plot: Plot = Plot::new().line(&x, &y).line(&x, &y).into();
let theme = plot.display.theme().clone();
let plot: Plot = plot.stem(&x, &y, 0.0).into();
let colors = arrow_colors(&plot);
assert_eq!(colors.len(), x.len());
assert!(colors.iter().all(|color| *color == theme.get_color(2)));
assert_ne!(colors[0], theme.get_color(1));
assert_ne!(colors[0], theme.get_color(3));
}
// ===== Uniform-builder coverage for histogram/boxplot/heatmap/error bars ==
const SAMPLES: [f64; 8] = [1.0, 2.0, 2.0, 3.0, 3.0, 3.0, 4.0, 5.0];
fn grid() -> Vec<Vec<f64>> {
vec![vec![1.0, 2.0, 3.0], vec![4.0, 5.0, 6.0]]
}
fn only_series(plot: &Plot) -> &PlotSeries {
assert_eq!(plot.series_mgr.len(), 1);
&plot.series_mgr.series()[0]
}
#[test]
fn test_histogram_builder_setters_apply_before_binning() {
let data = SAMPLES.to_vec();
// The bin count is chosen after `histogram()` returns, so binning has to
// be deferred to finalize for this to take effect.
let plot: Plot = Plot::new().histogram(&data).bins(4).into();
let SeriesType::Histogram {
config, prepared, ..
} = &only_series(&plot).series_type
else {
panic!("histogram() must push a Histogram series");
};
assert_eq!(config.bins, Some(4));
let prepared = prepared.as_ref().expect("histogram bins were computed");
assert_eq!(prepared.counts.len(), 4);
}
#[test]
fn test_histogram_with_starts_from_a_prebuilt_config() {
let data = SAMPLES.to_vec();
let plot: Plot = Plot::new()
.histogram_with(&data, HistogramConfig::new().bins(2).density(true))
.into();
let SeriesType::Histogram { config, .. } = &only_series(&plot).series_type else {
panic!("histogram_with() must push a Histogram series");
};
assert_eq!(config.bins, Some(2));
assert!(config.density);
}
#[test]
fn test_histogram_keeps_plot_level_and_series_level_chaining() {
let data = SAMPLES.to_vec();
// `.theme()` after a histogram used to fail to compile; `.label()` and
// `.legend_best()` are the pair that makes a legend entry appear.
let plot: Plot = Plot::new()
.histogram(&data)
.theme(Theme::dark())
.color(Color::RED)
.alpha(0.5)
.label("samples")
.legend_best()
.title("Distribution")
.into();
let series = only_series(&plot);
assert_eq!(series.label.as_deref(), Some("samples"));
assert_eq!(series.props.color.cloned(), Some(Color::RED));
assert_eq!(series.props.alpha.cloned(), Some(0.5));
assert!(plot.layout.legend.enabled);
}
#[test]
fn test_boxplot_builder_setters_reach_the_series_config() {
let data = SAMPLES.to_vec();
let plot: Plot = Plot::new().boxplot(&data).show_mean(true).into();
let SeriesType::BoxPlot { config, .. } = &only_series(&plot).series_type else {
panic!("boxplot() must push a BoxPlot series");
};
assert!(config.show_mean);
}
#[test]
fn test_heatmap_builder_setters_apply_before_color_mapping() {
let values = grid();
let plot: Plot = Plot::new().heatmap(&values).vmin(0.0).vmax(10.0).into();
let SeriesType::Heatmap { data } = &only_series(&plot).series_type else {
panic!("heatmap() must push a Heatmap series");
};
assert_eq!(data.n_rows, 2);
assert_eq!(data.n_cols, 3);
// Mapped with the bounds set after `heatmap()` returned, not the data's.
assert_eq!(data.vmin, 0.0);
assert_eq!(data.vmax, 10.0);
}
#[test]
fn test_heatmap_still_turns_the_grid_off() {
let values = grid();
let plot: Plot = Plot::new().grid(true).heatmap(&values).into();
assert!(!plot.layout.grid_style.visible);
}
#[test]
fn test_error_bars_config_setters_reach_the_rendered_config() {
let x = X.to_vec();
let y = Y.to_vec();
let errors = vec![0.1, 0.2, 0.3];
let plot: Plot = Plot::new()
.error_bars(&x, &y, &errors)
.cap_size(6.0)
.error_line_width(3.0)
.into();
let series = only_series(&plot);
assert!(matches!(series.series_type, SeriesType::ErrorBars { .. }));
let config = series.error_config.as_ref().expect("config was recorded");
assert_eq!(config.cap_size, 6.0);
assert_eq!(config.line_width, 3.0);
}
#[test]
fn test_error_bars_xy_keeps_its_own_series_type() {
let x = X.to_vec();
let y = Y.to_vec();
let errors = vec![0.1, 0.2, 0.3];
let plot: Plot = Plot::new().error_bars_xy(&x, &y, &errors, &errors).into();
assert!(matches!(
only_series(&plot).series_type,
SeriesType::ErrorBarsXY { .. }
));
}
#[test]
fn test_error_bars_with_xerr_attaches_x_errors_without_changing_the_type() {
let x = X.to_vec();
let y = Y.to_vec();
let errors = vec![0.1, 0.2, 0.3];
let plot: Plot = Plot::new()
.error_bars(&x, &y, &errors)
.with_xerr(&errors)
.into();
let series = only_series(&plot);
assert!(matches!(series.series_type, SeriesType::ErrorBars { .. }));
assert!(series.x_errors.is_some());
}
#[test]
fn test_error_bars_markers_are_still_configurable() {
let x = X.to_vec();
let y = Y.to_vec();
let errors = vec![0.1, 0.2, 0.3];
let plot: Plot = Plot::new()
.error_bars(&x, &y, &errors)
.marker(crate::render::MarkerStyle::Square)
.marker_size(11.0)
.into();
let series = only_series(&plot);
assert_eq!(
series.props.marker_style.cloned(),
Some(crate::render::MarkerStyle::Square)
);
assert_eq!(series.props.marker_size.cloned(), Some(11.0));
}
#[test]
fn test_converted_series_keep_their_palette_slot_accounting() {
let data = SAMPLES.to_vec();
// An automatically coloured series consumes a slot; an explicitly
// coloured one does not, which is what the old builder did.
let plot: Plot = Plot::new().histogram(&data).into();
assert_eq!(plot.series_mgr.auto_color_index(), 1);
let plot: Plot = plot.boxplot(&data).color(Color::RED).into();
assert_eq!(plot.series_mgr.auto_color_index(), 1);
let plot: Plot = plot.boxplot(&data).into();
assert_eq!(plot.series_mgr.auto_color_index(), 2);
}
#[test]
fn test_converted_series_chain_into_other_series() {
let data = SAMPLES.to_vec();
let x = X.to_vec();
let y = Y.to_vec();
let plot: Plot = Plot::new()
.histogram(&data)
.boxplot(&data)
.line(&x, &y)
.into();
assert_eq!(plot.series_mgr.len(), 3);
}
// ===== Streaming series are ordinary line/scatter series =====
fn stream_of(points: &[(f64, f64)]) -> StreamingXY {
let stream = StreamingXY::new(16);
stream.push_many(points.to_vec());
stream
}
#[test]
fn test_line_streaming_is_a_line_builder_with_a_live_buffer() {
let stream = stream_of(&[(0.0, 0.0), (1.0, 1.0)]);
// `line_streaming` used to return a different builder type than `line`,
// which is why it spelled stroke width `.width()`. It is now the same
// `PlotBuilder<LineConfig>`, so it takes the same setters.
let plot: Plot = Plot::new()
.line_streaming(&stream)
.line_width(3.0)
.line_style(LineStyle::Dashed)
.label("live")
.into();
let series = only_series(&plot);
assert!(matches!(series.series_type, SeriesType::Line { .. }));
assert!(
series.streaming_source.is_some(),
"the live buffer must survive finalize"
);
assert_eq!(series.props.line_width.cloned(), Some(3.0));
assert_eq!(series.props.line_style.cloned(), Some(LineStyle::Dashed));
assert_eq!(series.label.as_deref(), Some("live"));
}
#[test]
fn test_scatter_streaming_is_a_scatter_builder_with_a_live_buffer() {
let stream = stream_of(&[(0.0, 0.0), (1.0, 1.0)]);
let plot: Plot = Plot::new()
.scatter_streaming(&stream)
.marker_size(9.0)
.into();
let series = only_series(&plot);
assert!(matches!(series.series_type, SeriesType::Scatter { .. }));
assert!(series.streaming_source.is_some());
// Scatter's default marker still applies, exactly as for `scatter()`.
assert_eq!(
series.props.marker_style.cloned(),
Some(MarkerStyle::Circle)
);
assert_eq!(series.props.marker_size.cloned(), Some(9.0));
}
#[test]
fn test_streaming_series_use_the_same_palette_rule_as_their_static_twin() {
let stream = stream_of(&[(0.0, 0.0), (1.0, 1.0)]);
let x = X.to_vec();
let y = Y.to_vec();
let streaming: Plot = Plot::new().line_streaming(&stream).into();
let static_: Plot = Plot::new().line(&x, &y).into();
assert_eq!(
streaming.series_mgr.auto_color_index(),
static_.series_mgr.auto_color_index()
);
}
#[test]
fn test_derived_series_color_tracks_a_custom_theme() {
let x = X.to_vec();
let y = Y.to_vec();
let plot: Plot = Plot::new().theme(Theme::dark()).area(&x, &y, 0.0).into();
let expected = Theme::dark().get_color(0);
let styles = fill_styles(&plot);
assert_eq!(styles[0].color, expected);
}
}
/// The five compute-only plot types wired through `SeriesType::Computed`.
///
/// One variant carries all of them, so the thing worth asserting is not that
/// each one has its own code path — it is that none of them does: the same
/// chain, the same palette rule, the same primitives in both backends.
#[cfg(test)]
mod computed_series_tests {
use super::*;
use crate::render::Color;
use crate::stats::clustering::{LinkageMethod, linkage};
fn samples() -> Vec<f64> {
(0..24).map(|i| f64::from(i) * 0.37 + 1.0).collect()
}
fn categories() -> Vec<&'static str> {
let mut out = Vec::new();
for _ in 0..8 {
out.extend(["a", "b", "c"]);
}
out
}
fn tree() -> crate::stats::clustering::Linkage {
let distances = vec![
vec![0.0, 1.0, 4.0, 5.0],
vec![1.0, 0.0, 4.5, 5.5],
vec![4.0, 4.5, 0.0, 1.5],
vec![5.0, 5.5, 1.5, 0.0],
];
linkage(&distances, LinkageMethod::Average)
}
/// Every builder that can appear in the chain, finalized into a `Plot`,
/// with the SVG element and count its geometry must produce.
///
/// The counts are exact-shaped rather than "something was drawn": rug's
/// renderer used to return `Ok(())` having drawn nothing, and an assertion
/// that only looked for ink would have been satisfied by the axes.
fn every_computed_plot() -> Vec<(&'static str, Plot, &'static str, usize)> {
let values = samples();
let names = categories();
let x: Vec<f64> = (0..64).map(|i| f64::from(i) * 0.1).collect();
let y: Vec<f64> = x.iter().map(|v| v.sin()).collect();
vec![
// One stroked mark per sample.
(
"rug",
Plot::new().rug(&values).label("rug").into(),
"<line",
values.len(),
),
// One marker per observation.
(
"strip",
Plot::new().strip(&names, &values).label("strip").into(),
"<circle",
values.len(),
),
(
"swarm",
Plot::new().swarm(&names, &values).label("swarm").into(),
"<circle",
values.len(),
),
// One filled hexagon per occupied bin.
(
"hexbin",
Plot::new().hexbin(&x, &y).label("hexbin").into(),
"<polygon",
1,
),
// Three segments per merge, three merges for four leaves.
(
"dendrogram",
Plot::new().dendrogram(&tree()).label("tree").into(),
"<line",
9,
),
]
}
#[test]
fn every_computed_plot_type_joins_the_standard_chain() {
// `.<series>(..).label(..).color(..).legend_best().save(..)` has to
// compile for these exactly as it does for the other 21.
let values = samples();
let names = categories();
let plot: Plot = Plot::new()
.rug(&values)
.label("marks")
.color(Color::from_rgb(10, 20, 30))
.legend_best()
.strip(&names, &values)
.label("points")
.color(Color::from_rgb(40, 50, 60))
.into();
assert_eq!(plot.series_mgr.series.len(), 2);
for series in &plot.series_mgr.series {
assert!(matches!(series.series_type, SeriesType::Computed { .. }));
assert!(series.label.is_some());
assert!(series.props.color.value().is_some());
}
}
#[test]
fn every_computed_plot_type_pushes_exactly_one_series() {
for (name, plot, _, _) in every_computed_plot() {
assert_eq!(
plot.series_mgr.series.len(),
1,
"`Plot::{name}` did not add exactly one series"
);
let series = &plot.series_mgr.series[0];
assert!(
matches!(series.series_type, SeriesType::Computed { .. }),
"`Plot::{name}` did not go through SeriesType::Computed"
);
}
}
#[test]
fn a_computed_series_takes_the_next_palette_slot_like_any_other() {
// The palette rule lives in `push_builder_series`; a compute-only plot
// type must not have its own.
let values = samples();
let plot: Plot = Plot::new().line(&values, &values).rug(&values).into();
assert_eq!(plot.series_mgr.auto_color_index(), 2);
let explicit: Plot = Plot::new()
.rug(&values)
.color(Color::from_rgb(1, 2, 3))
.into();
assert_eq!(explicit.series_mgr.auto_color_index(), 0);
}
#[test]
fn every_computed_plot_type_draws_in_both_backends() {
// A plot type that renders in PNG but not SVG is exactly the divergence
// `PlotPrimitive` exists to make impossible, so assert both backends put
// the series' own geometry on the page for every one of them.
for (name, plot, element, minimum) in every_computed_plot() {
let image = plot
.clone()
.size_px(320, 240)
.render()
.unwrap_or_else(|error| panic!("`Plot::{name}` failed to render: {error}"));
let ink = image
.pixels
.chunks_exact(4)
.filter(|p| p[3] > 0 && (p[0] < 250 || p[1] < 250 || p[2] < 250))
.count();
assert!(ink > 0, "`Plot::{name}` rendered a blank PNG");
let svg = plot
.size_px(320, 240)
.render_to_svg()
.unwrap_or_else(|error| panic!("`Plot::{name}` failed to export SVG: {error}"));
let drawn = svg.matches(element).count();
assert!(
drawn >= minimum,
"`Plot::{name}` exported {drawn} `{element}` elements, expected at \
least {minimum} — its geometry did not reach the SVG backend"
);
}
}
#[test]
fn repeating_a_category_name_reuses_its_slot() {
assert_eq!(
category_slot_indices(&[
"b".to_string(),
"a".to_string(),
"b".to_string(),
"c".to_string(),
]),
(
vec![0, 1, 0, 2],
vec!["b".to_string(), "a".to_string(), "c".to_string()],
),
"a repeated category must land back in the slot it first claimed, \
and each distinct name must be reported once, in slot order"
);
}
#[test]
fn mismatched_categorical_input_is_reported_not_silently_truncated() {
let values = vec![1.0, 2.0, 3.0];
let plot: Plot = Plot::new().strip(&["a", "b"], &values).into();
assert!(
plot.render().is_err(),
"a strip plot with more values than categories rendered anyway"
);
}
}
/// The three multi-series plot types: grouped bar, stacked bar, stacked area.
///
/// What is worth asserting is not that each has its own code path — it is that
/// none of them does. N named value columns become N ordinary series, so the
/// palette rule, the legend, the category axis and both backends behave
/// exactly as they do for N separate single-series calls.
#[cfg(test)]
mod multi_series_tests {
use super::*;
use crate::render::Color;
fn categories() -> [&'static str; 3] {
["Q1", "Q2", "Q3"]
}
fn first() -> Vec<f64> {
vec![3.0, 5.0, 4.0]
}
fn second() -> Vec<f64> {
vec![2.0, 1.0, 6.0]
}
fn x() -> Vec<f64> {
vec![0.0, 1.0, 2.0]
}
/// Every multi-series builder, finalized, with the SVG element its geometry
/// must produce and how many of them.
fn every_multi_series_plot() -> Vec<(&'static str, Plot, &'static str, usize)> {
let (a, b) = (first(), second());
vec![
(
"grouped_bar",
Plot::new()
.grouped_bar(&categories(), &[("2023", &a), ("2024", &b)])
.into(),
"<polygon",
6,
),
(
"stacked_bar",
Plot::new()
.stacked_bar(&categories(), &[("2023", &a), ("2024", &b)])
.into(),
"<polygon",
6,
),
(
"stacked_area",
Plot::new()
.stacked_area(&x(), &[("solar", &a), ("wind", &b)])
.into(),
"<polygon",
2,
),
]
}
#[test]
fn every_multi_series_plot_type_joins_the_standard_chain() {
// `.<series>(..).label(..).color(..).legend_best().save(..)` has to
// compile for these exactly as it does for every other plot type.
let (a, b) = (first(), second());
let plot: Plot = Plot::new()
.grouped_bar(&categories(), &[("2023", &a), ("2024", &b)])
.label("unused — both columns are named")
.legend_best()
.stacked_area(&x(), &[("solar", &a), ("wind", &b)])
.label("unused — both columns are named")
.into();
assert_eq!(plot.series_mgr.series.len(), 4);
for series in &plot.series_mgr.series {
assert!(matches!(series.series_type, SeriesType::Computed { .. }));
}
}
#[test]
fn each_named_column_becomes_its_own_series() {
for (name, plot, _, _) in every_multi_series_plot() {
assert_eq!(
plot.series_mgr.series.len(),
2,
"`Plot::{name}` did not add one series per named value column"
);
let labels: Vec<Option<&str>> = plot
.series_mgr
.series
.iter()
.map(|series| series.label.as_deref())
.collect();
assert!(
labels.iter().all(Option::is_some) && labels[0] != labels[1],
"`Plot::{name}` gave its columns {labels:?}; each needs its own \
legend entry, which is the point of a multi-series chart"
);
}
}
#[test]
fn each_column_takes_the_next_palette_slot_like_any_other_series() {
// The palette rule lives in `push_builder_series`; a multi-series plot
// type must not grow a second one.
for (name, plot, _, _) in every_multi_series_plot() {
assert_eq!(
plot.series_mgr.auto_color_index(),
2,
"`Plot::{name}` did not advance the palette once per column"
);
}
let (a, b) = (first(), second());
let after = Plot::new()
.line(&x(), &a)
.grouped_bar(&categories(), &[("2023", &a), ("2024", &b)])
.into_plot();
assert_eq!(after.series_mgr.auto_color_index(), 3);
}
#[test]
fn an_explicit_colour_applies_to_every_column_and_takes_no_palette_slot() {
let (a, b) = (first(), second());
let plot: Plot = Plot::new()
.grouped_bar(&categories(), &[("2023", &a), ("2024", &b)])
.color(Color::from_rgb(1, 2, 3))
.into();
assert_eq!(plot.series_mgr.series.len(), 2);
assert_eq!(plot.series_mgr.auto_color_index(), 0);
for series in &plot.series_mgr.series {
assert_eq!(series.props.color.cloned(), Some(Color::from_rgb(1, 2, 3)));
}
}
#[test]
fn label_names_a_column_that_was_not_named_and_never_overrides_one_that_was() {
let (a, b) = (first(), second());
let plot: Plot = Plot::new()
.stacked_bar(&categories(), &[("hardware", &a), ("", &b)])
.label("everything else")
.into();
let labels: Vec<Option<&str>> = plot
.series_mgr
.series
.iter()
.map(|series| series.label.as_deref())
.collect();
assert_eq!(labels, vec![Some("hardware"), Some("everything else")]);
}
#[test]
fn a_group_shares_the_one_category_axis() {
// Not a second positioning story: the slots a grouped chart claims are
// harvested by exactly the routine that harvests a bar chart's.
let (a, b) = (first(), second());
let plot: Plot = Plot::new()
.grouped_bar(&categories(), &[("2023", &a), ("2024", &b)])
.into();
let axis = super::super::series_internal::CategoryAxis::harvest(&plot.series_mgr.series)
.expect("a grouped bar chart must claim category slots");
assert_eq!(axis.labels, vec!["Q1", "Q2", "Q3"]);
assert_eq!(axis.positions, vec![0.0, 1.0, 2.0]);
assert_eq!(axis.x_span(), (-0.5, 2.5));
}
#[test]
fn a_stack_autoscales_to_its_cumulative_total() {
// The bounds routine is not extended per plot type: each column states
// its own extent through `PlotData`, and the union of those is the
// total. 5 + 1 is the tallest column of `first()`/`second()`.
let (a, b) = (first(), second());
let plot = Plot::new()
.stacked_bar(&categories(), &[("lower", &a), ("upper", &b)])
.into_plot();
let (_, _, _, y_max) = plot.calculate_data_bounds().expect("bounds");
assert!(
(y_max - 10.0).abs() < 1e-9,
"expected the stack total of 4 + 6, got {y_max}"
);
let grouped = Plot::new()
.grouped_bar(&categories(), &[("lower", &a), ("upper", &b)])
.into_plot();
let (_, _, _, grouped_max) = grouped.calculate_data_bounds().expect("bounds");
assert!(
(grouped_max - 6.0).abs() < 1e-9,
"a grouped chart autoscales to its tallest bar, got {grouped_max}"
);
}
#[test]
fn every_multi_series_plot_type_draws_in_both_backends() {
// A plot type that renders in PNG but not SVG is exactly the divergence
// `PlotPrimitive` exists to make impossible.
for (name, plot, element, minimum) in every_multi_series_plot() {
let image = plot
.clone()
.size_px(320, 240)
.render()
.unwrap_or_else(|error| panic!("`Plot::{name}` failed to render: {error}"));
let ink = image
.pixels
.chunks_exact(4)
.filter(|p| p[3] > 0 && (p[0] < 250 || p[1] < 250 || p[2] < 250))
.count();
assert!(ink > 0, "`Plot::{name}` rendered a blank PNG");
let svg = plot
.size_px(320, 240)
.render_to_svg()
.unwrap_or_else(|error| panic!("`Plot::{name}` failed to export SVG: {error}"));
let drawn = svg.matches(element).count();
assert!(
drawn >= minimum,
"`Plot::{name}` exported {drawn} `{element}` elements, expected at \
least {minimum} — its geometry did not reach the SVG backend"
);
}
}
#[test]
fn a_chart_with_no_value_columns_is_an_error_not_a_blank_figure() {
let empty: [(&str, &Vec<f64>); 0] = [];
assert!(
Plot::new()
.grouped_bar(&categories(), &empty)
.render()
.is_err()
);
assert!(Plot::new().stacked_area(&x(), &empty).render().is_err());
}
#[test]
fn a_column_that_does_not_match_the_axis_is_reported_not_truncated() {
// `compute_grouped_bars` would silently `.take(categories)`, so a short
// or long column has to be caught on the way in.
let short = vec![1.0, 2.0];
assert!(
Plot::new()
.grouped_bar(&categories(), &[("short", &short)])
.render()
.is_err(),
"a value column shorter than the category axis rendered anyway"
);
}
}