# RustMeter CLI
**The host-side companion for the RustMeter embedded profiling system.**
[`rustmeter`](https://crates.io/crates/rustmeter) is a command-line tool designed to capture, parse, and export profiling data from embedded Rust applications. It works in tandem with the [`rustmeter-beacon`](https://crates.io/crates/rustmeter-beacon) crate running on your device.
By wrapping `cargo run`, it seamlessly intercepts `defmt` logs, filters out tracing events, and generates a trace file compatible with the **Perfetto UI**.
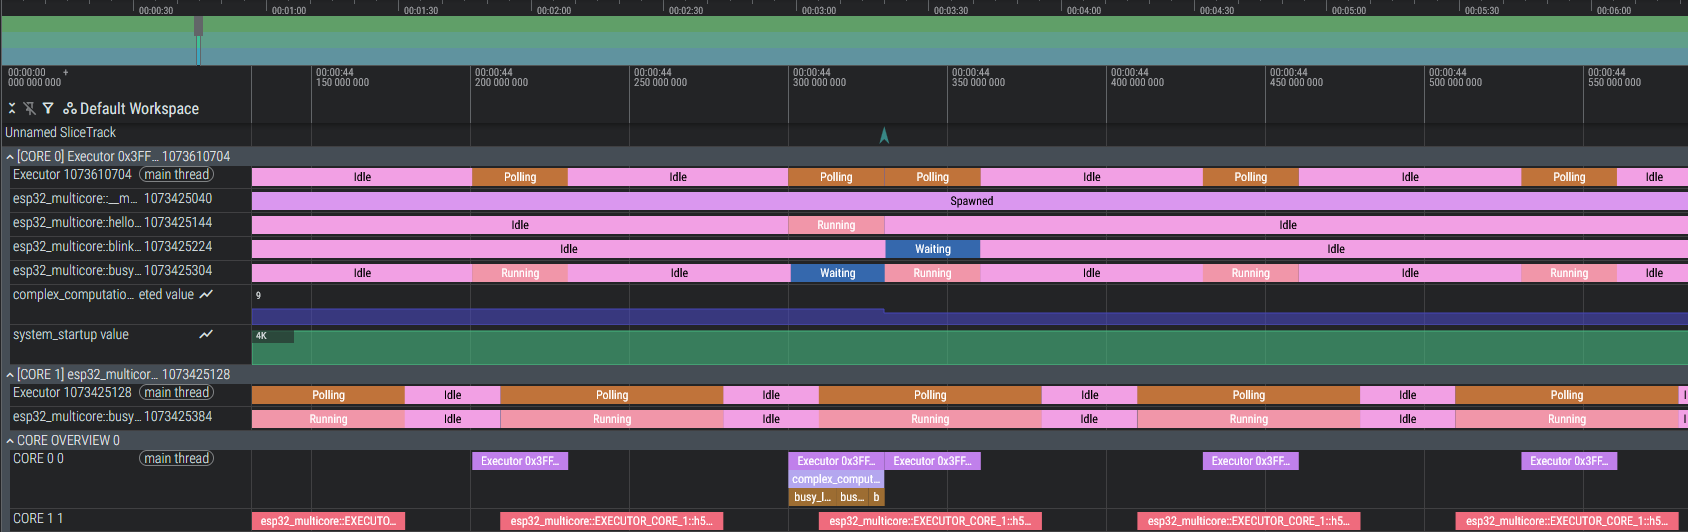
_(Example visualization of a multicore ESP32 trace)_
## 🚀 Features
- **Seamless Integration**: Acts as a wrapper around `cargo run`, preserving your existing workflow.
- **Real-time Parsing**: Decodes `defmt` streams on the fly to extract task transitions, function timings, and metrics.
- **Perfetto Export**: Generates standard JSON trace files readable by [ui.perfetto.dev](https://ui.perfetto.dev/).
- **Console Passthrough**: Standard log messages (`info!`, `warn!`, `error!`) are still printed to your console, keeping your debug output visible.
## 📦 Installation
Install the tool directly from crates.io:
```bash
cargo install rustmeter
```
## 🛠️ Usage
### Prerequisites
Ensure your embedded project is instrumented with the rustmeter-beacon crate. The firmware must use defmt for logging and (optionally) embassy-executor with the trace feature enabled for task tracking.
### Running a Trace Session
1. Navigate to your firmware directory:
```bash
cd path/to/your/firmware
```
2. Start **RustMeter**: Instead of using cargo run, simply use rustmeter. It accepts standard arguments like --release.
```bash
# Debug build
rustmeter
# Release build
rustmeter --release
```
3. **Interact & Stop**: The tool will build and flash your device (via your existing .cargo/config.toml runner). Once running, interact with your device as usual.
To stop the session and save the trace, press Ctrl+C.
### Analyzing the Data
Once stopped, `rustmeter` creates a JSON file in your project directory named `rustmeter-perfetto-debug.json`. Open this file in [ui.perfetto.dev](https://ui.perfetto.dev/) to visualize and analyze the profiling data. Explore the timeline to analyze:
- Task Scheduling: See exactly when Embassy tasks are running, waiting, or being preempted.
- Function Execution: Visualize spans captured by #[monitor_fn].
- Metrics: Inspect plotted values for sensors or internal state.
## 🤝 Relationship with `rustmeter-beacon`
This CLI tool is the receiver. It does not work alone. You need to add the sender crate to your embedded application:
```toml
[dependencies]
rustmeter-beacon = "0.1" # Check crates.io for the latest version
```
See the [`rustmeter-beacon`](https://github.com/Christopher-06/rustmeter) for details on how to instrument your firmware.
## 📄 License
This project is licensed under the MIT License.