import pandas as pd
from rs1090 import flarm
data = pd.read_csv("../../crates/rs1090/data/flarm.csv")
decoded = flarm(
data.rawmessage,
data.timestamp.astype(int),
data.sensorlatitude,
data.sensorlongitude,
)
from itertools import batched
df = pd.concat(pd.DataFrame.from_records(d) for d in batched(decoded, 5000))
df = df.assign(timestamp=pd.to_datetime(df.timestamp, unit="s", utc=True))
df
from pitot.geodesy import distance
flight = df.query(
'icao24 == "38f27b" and '
'"2022-06-15 07:35Z" < timestamp < "2022-06-15 09:30Z"'
).sort_values("timestamp")
flight = flight.assign(
distance=distance(
flight.latitude,
flight.longitude,
flight.reference_lat,
flight.reference_lon,
),
)
flight = flight.query("distance < 200_000")
import numpy as np
coords = flight[["timestamp", "latitude", "longitude"]]
delta = pd.concat([coords, coords.add_suffix("_1").diff()], axis=1)
delta_1 = delta.iloc[1:]
distance_nm = distance(
(delta_1.latitude - delta_1.latitude_1).values,
(delta_1.longitude - delta_1.longitude_1).values,
delta_1.latitude.values,
delta_1.longitude.values,
)
secs = delta_1.timestamp_1.dt.total_seconds()
flight = flight.assign(
gs=list(np.abs(np.pad(distance_nm / secs, (1, 0), "edge")))
)
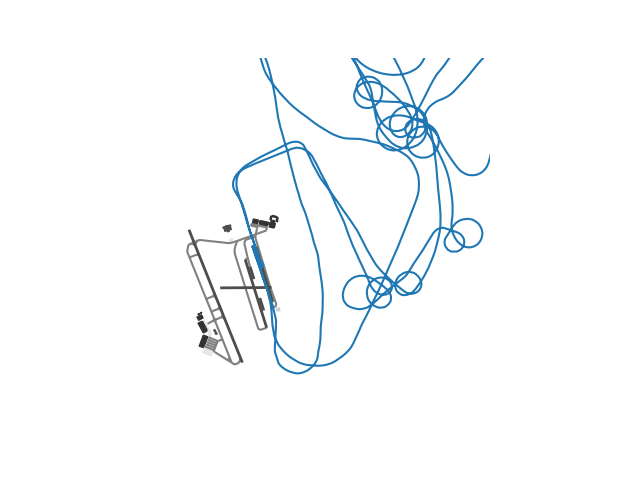
import matplotlib.pyplot as plt from cartes.crs import Lambert93, PlateCarree from cartes.osm import Overpass
airport = Overpass.request(area=dict(icao="LFMY"), aeroway=True)
fig, ax = plt.subplots(subplot_kw=dict(projection=Lambert93()))
airport.plot(
ax,
by="aeroway",
runway={"lw": 2},
aerodrome={"alpha": 0},
radar={"alpha": 0},
)
flight.query("gs < 20000").plot(
ax=ax, x="longitude", y="latitude", legend=False, transform=PlateCarree()
)
ax.spines["geo"].set_visible(False)
ax.yaxis.set_visible(False)
ax.set_extent((5.1, 5.16, 43.59, 43.64)) fig.savefig("flarm.png")