1
2
3
4
5
6
7
8
9
10
11
12
13
14
15
16
17
18
19
20
21
22
23
24
25
26
27
28
29
30
31
32
33
34
35
36
37
38
39
40
41
42
43
44
45
46
47
48
49
50
51
52
53
54
55
56
57
58
59
60
61
62
63
64
65
66
67
68
69
70
71
72
73
74
75
76
77
78
79
80
81
82
83
84
85
86
87
88
89
90
91
92
93
94
95
96
97
98
99
100
101
102
103
104
105
106
107
108
109
110
111
112
113
114
115
116
117
118
119
120
121
122
123
124
125
126
127
128
//! # Scientific communication reflects on the scientist, and your figures should carry the same *rizzma* as your ideas.
//!
//! ## rizzma
//!
//! A single-crate Rust reimplementation of the good parts of matplotlib / pyplot,
//! with first-class WebAssembly support.
//!
//! Everything lives in one publishable crate. The former workspace crates are now
//! namespaced modules — [`figure`], [`pyplot`], [`axis`], [`artist`], [`mathtext`],
//! the backends ([`skia`], [`svg`], [`pdf`]), and [`mplot3d`] — so you can reach any
//! part of the API through a single dependency.
//!
//! ```
//! use rizzma::Figure;
//!
//! let mut fig = Figure::new(4.0, 3.0);
//! let ax = fig.add_axes(0.1, 0.1, 0.8, 0.8);
//! ax.plot(&[0.0, 1.0, 2.0], &[0.0, 1.0, 0.0]);
//! let png = fig.encode_png().expect("encode");
//! assert!(!png.is_empty());
//! ```
//!
//! ## Live demos
//!
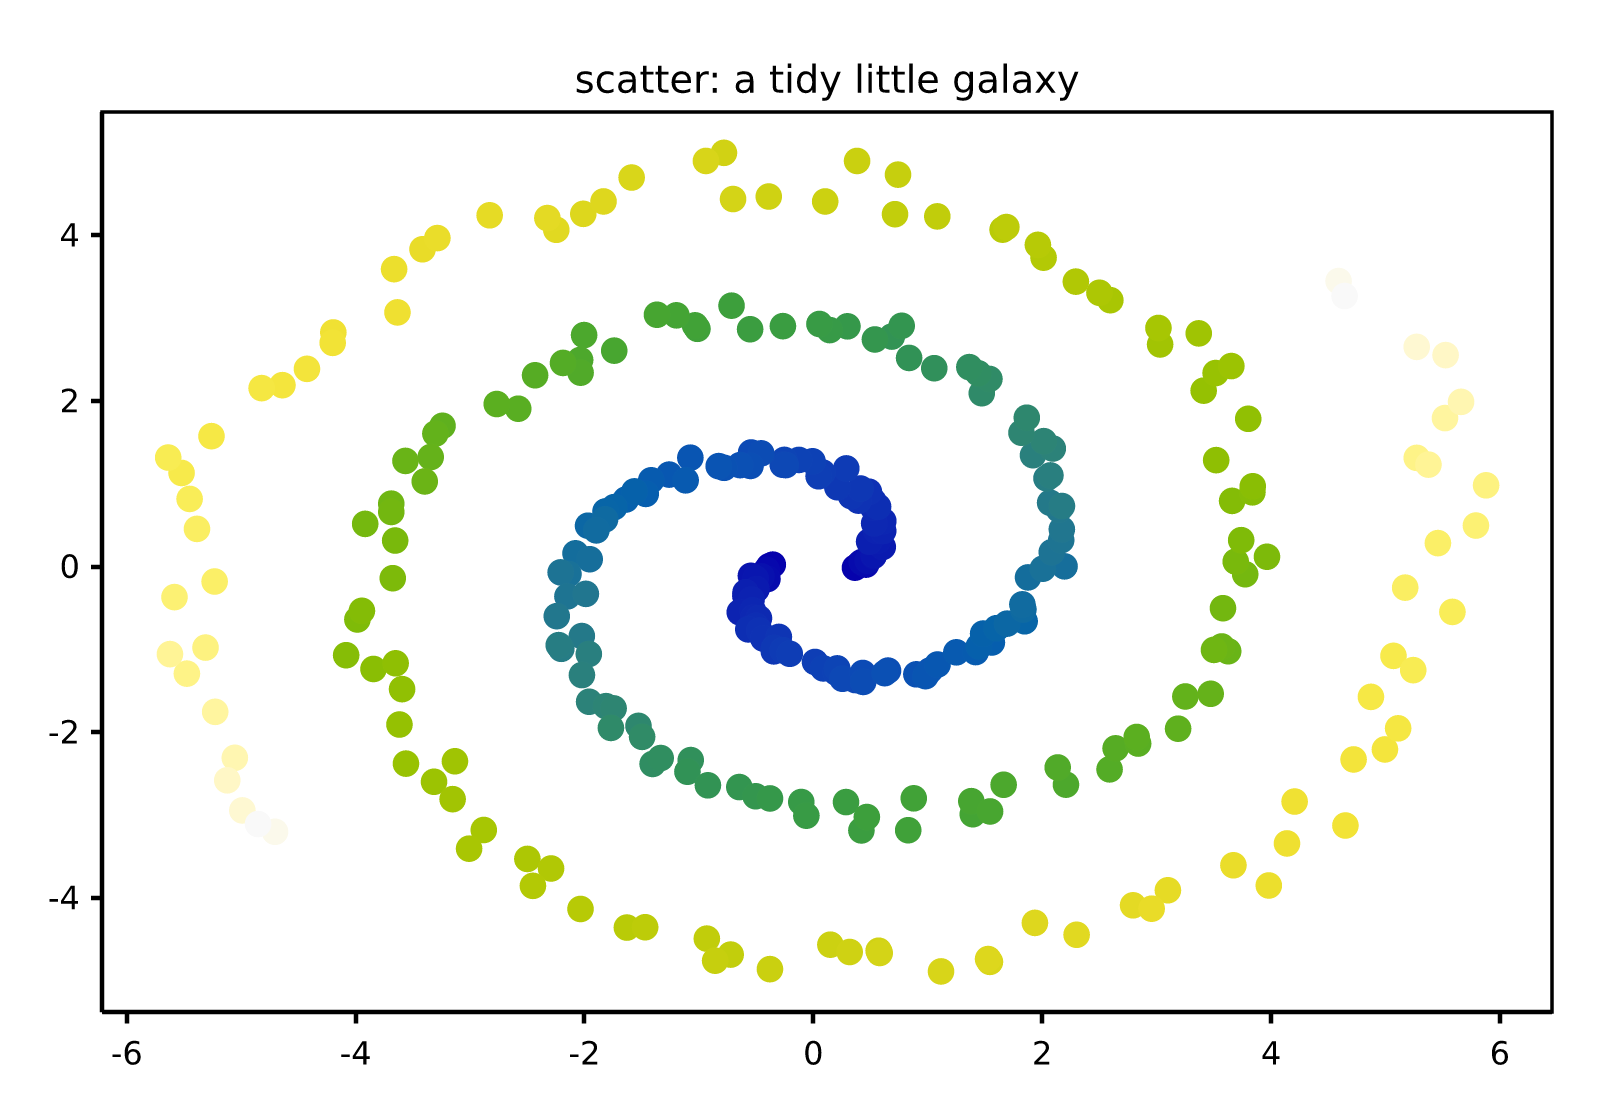
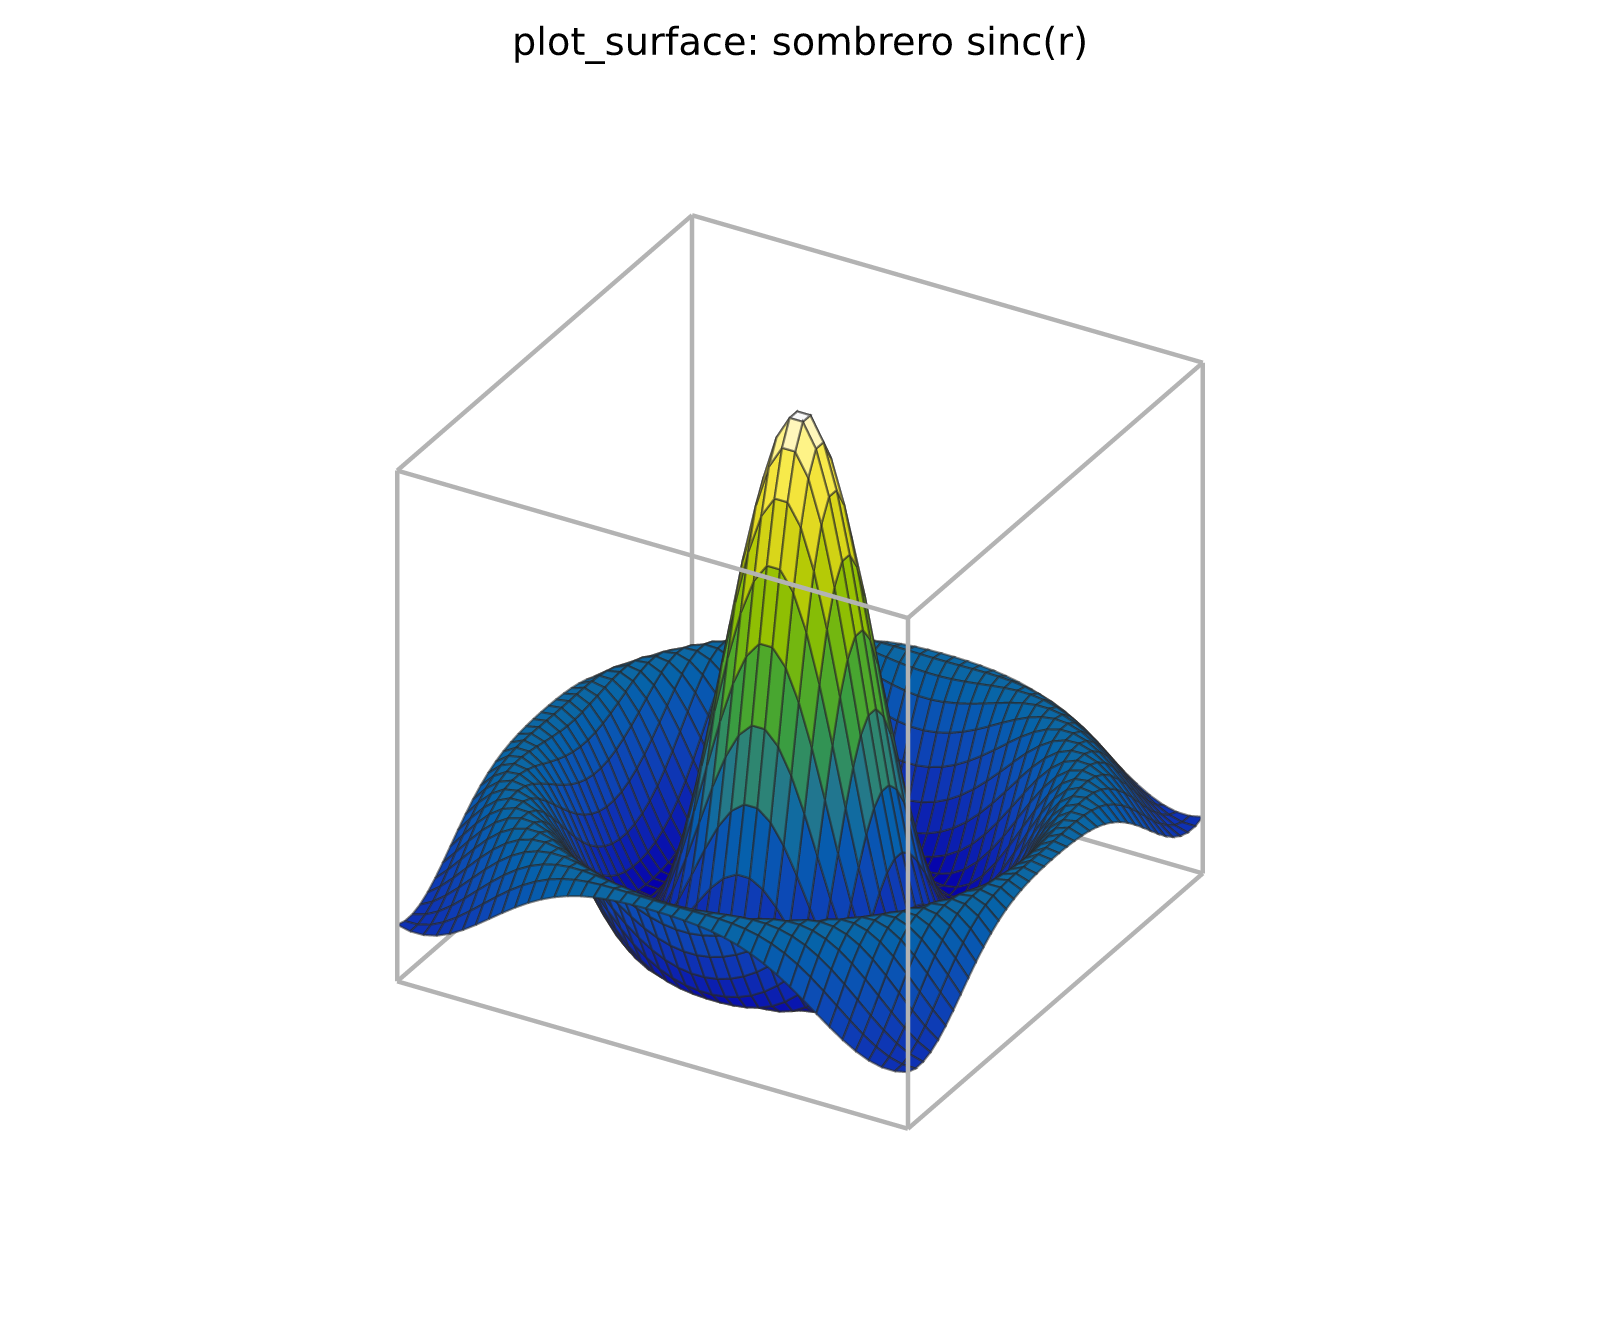
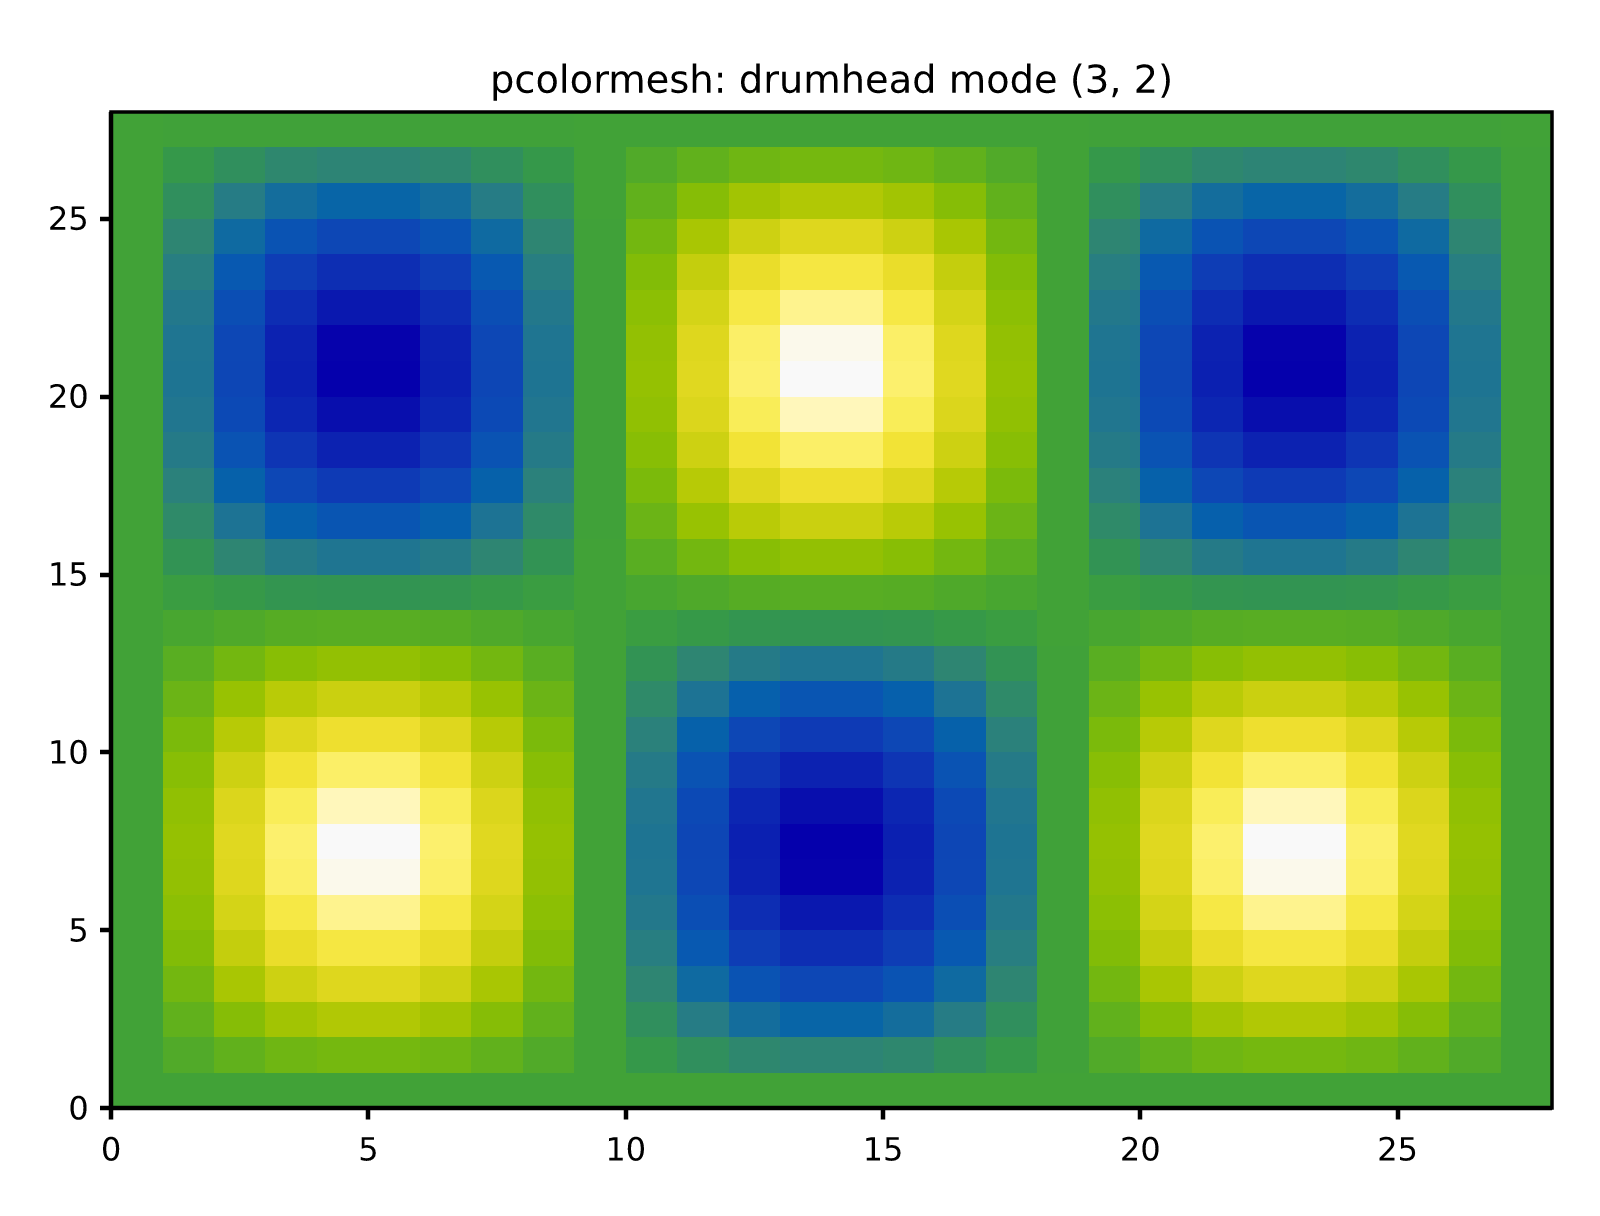
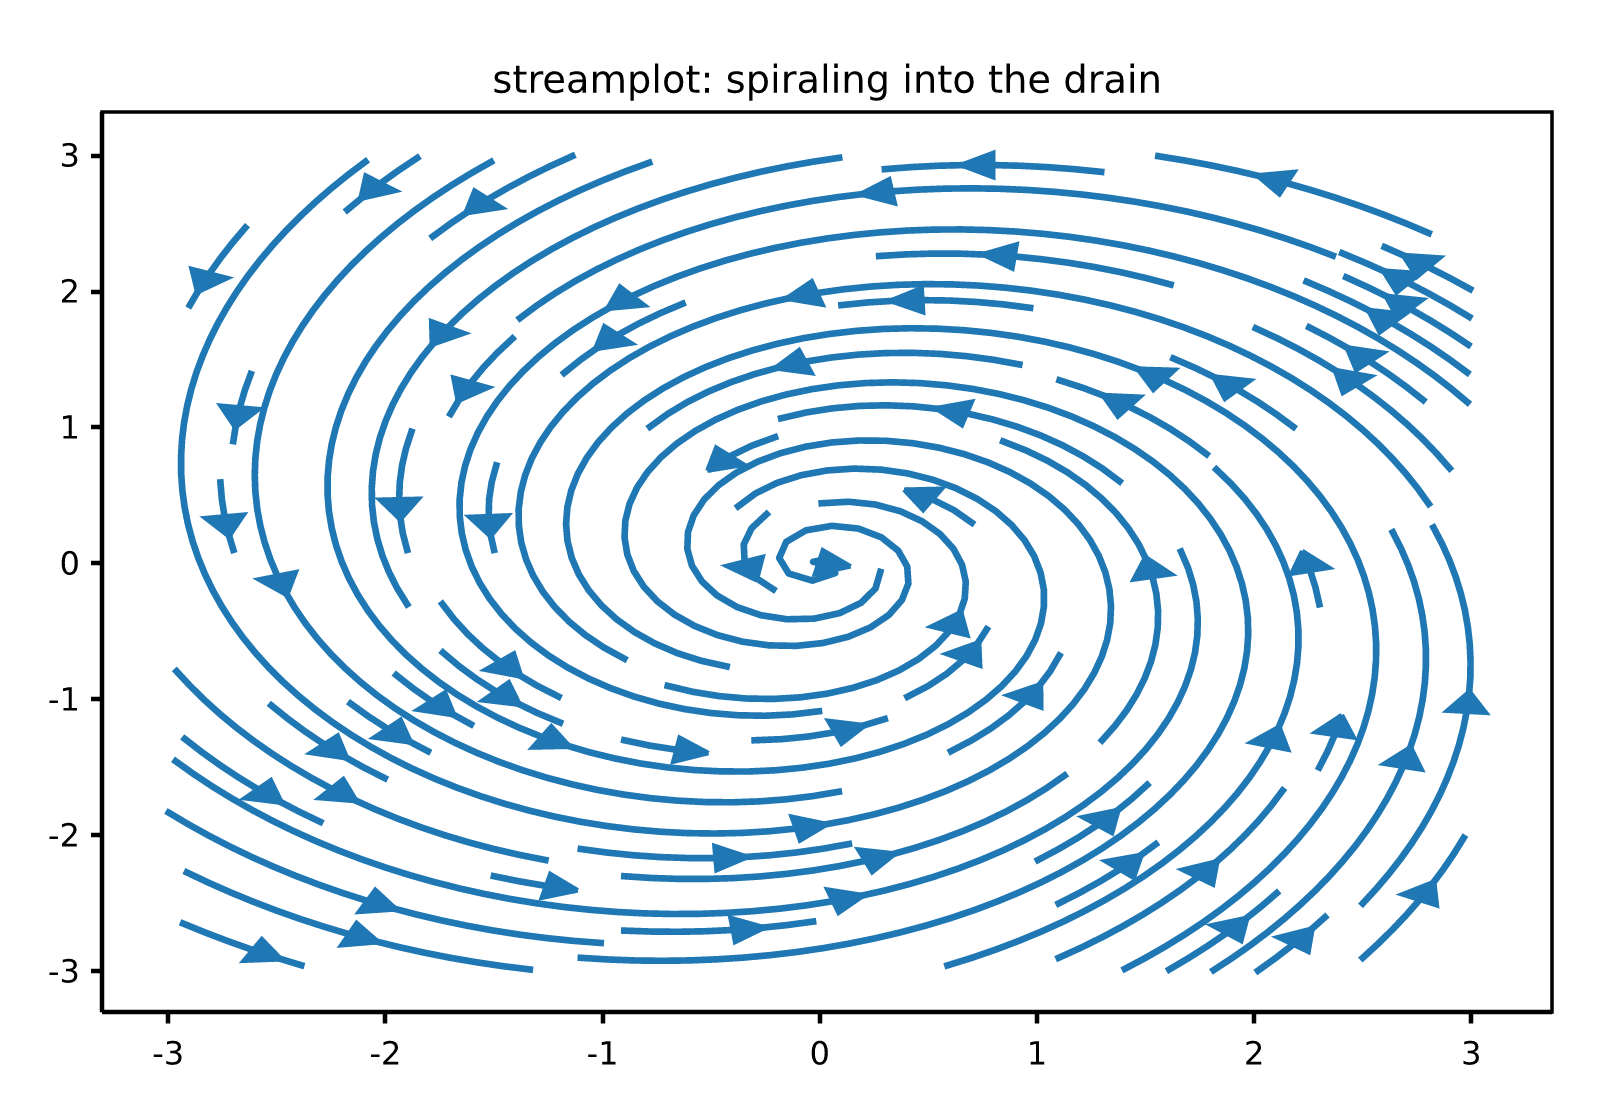
//! On docs.rs every cell below is a real canvas driven by this crate compiled
//! to WebAssembly — animated from Rust each frame, and interactive: wheel to
//! zoom at the cursor, drag to pan, double-click to reset. (Elsewhere the
//! cells fall back to static gallery images. More at
//! <https://orbitalcommons.github.io/rizzma/demo/>.)
//!
//! <div class="rizzma-live-grid">
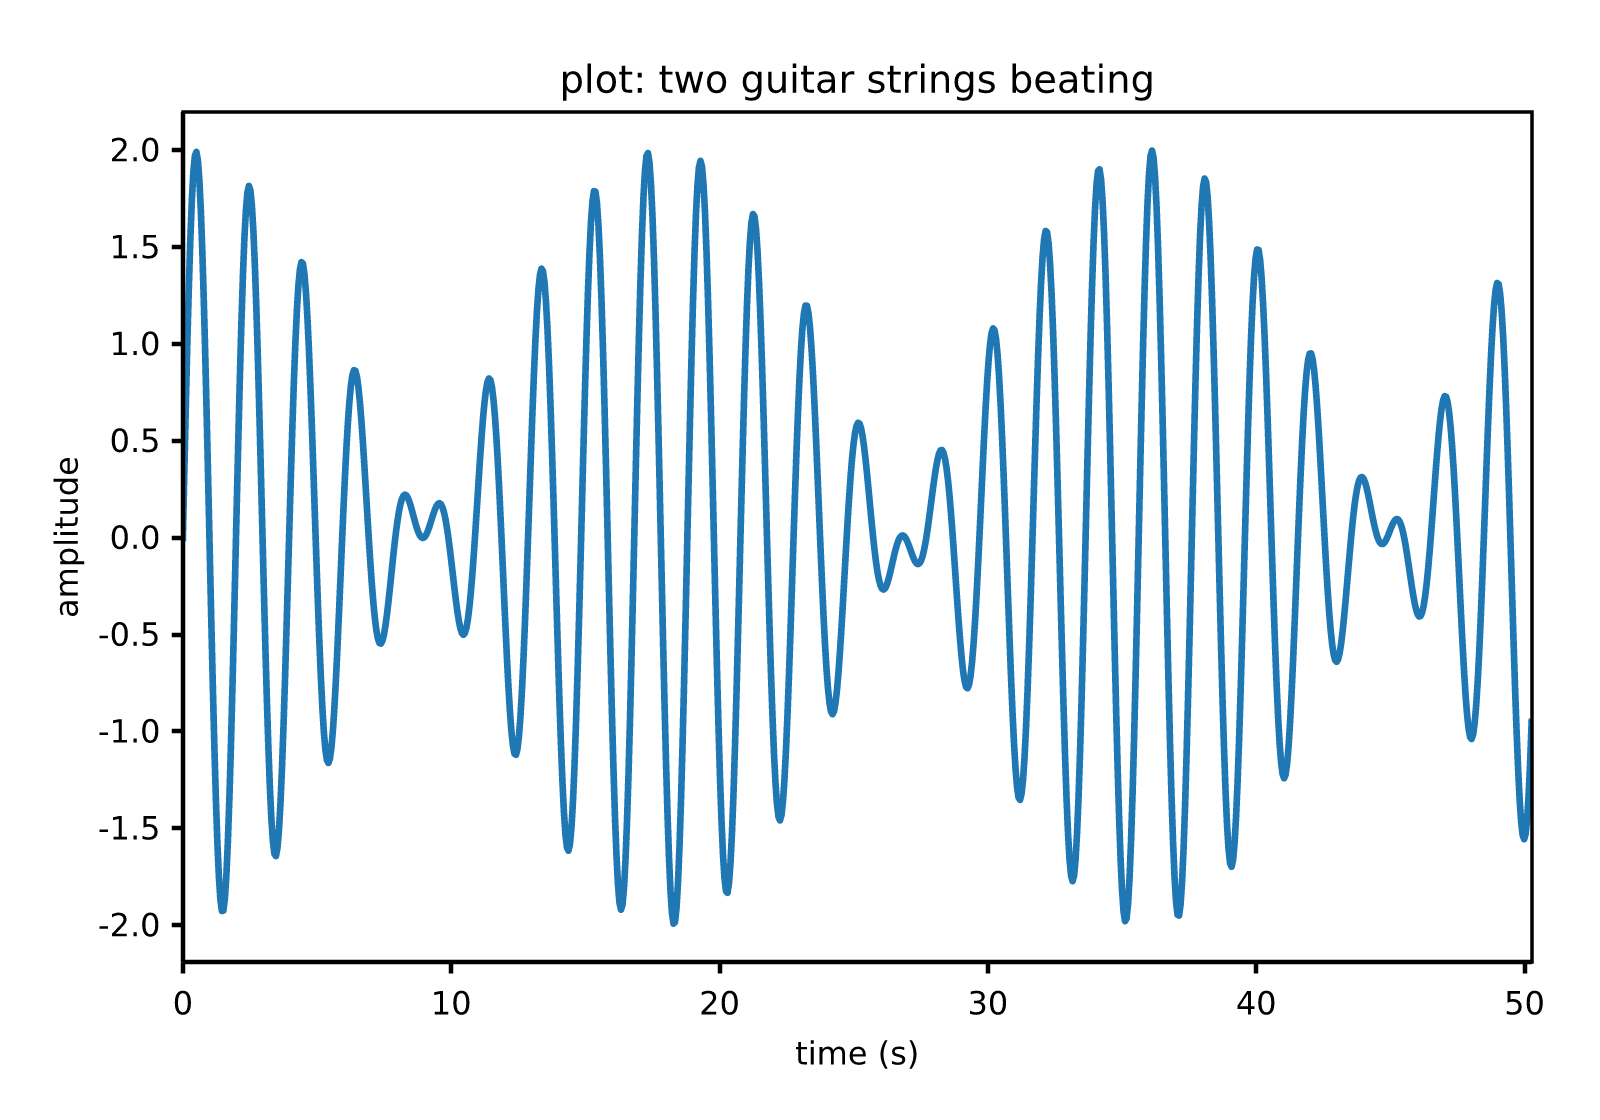
//! <div class="rizzma-live" data-demo="beats">
//!
//! 
//!
//! </div>
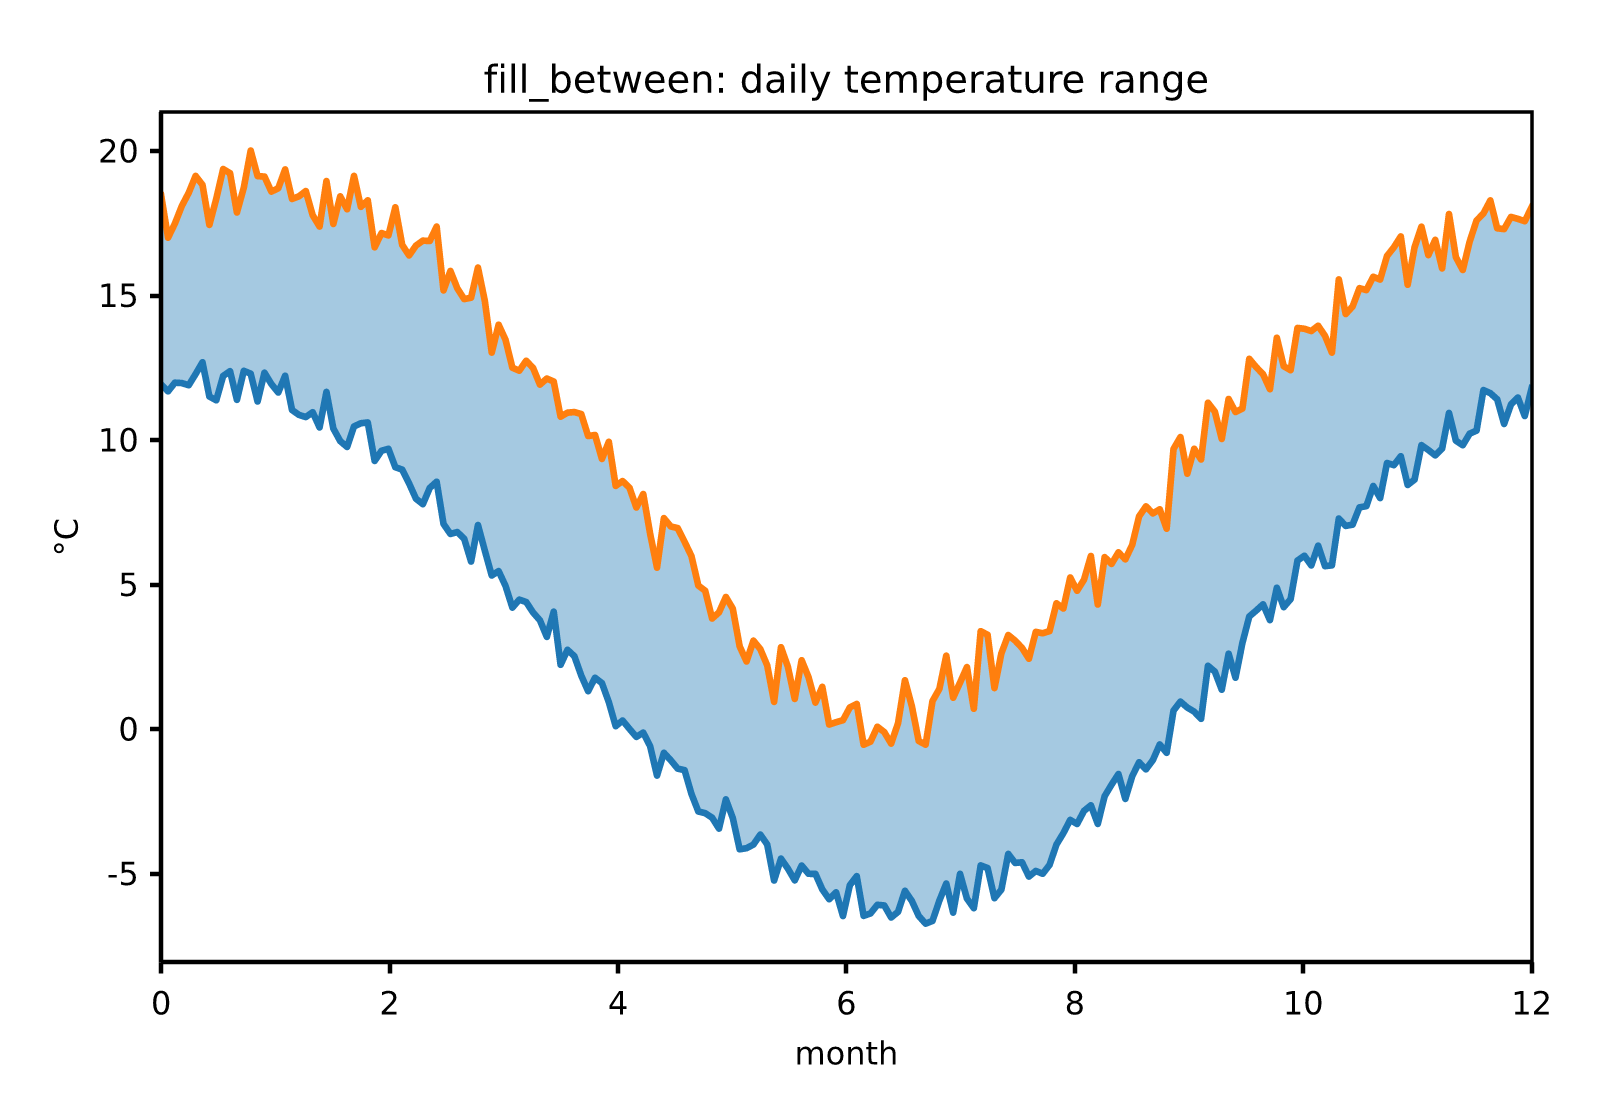
//! <div class="rizzma-live" data-demo="interference">
//!
//! 
//!
//! </div>
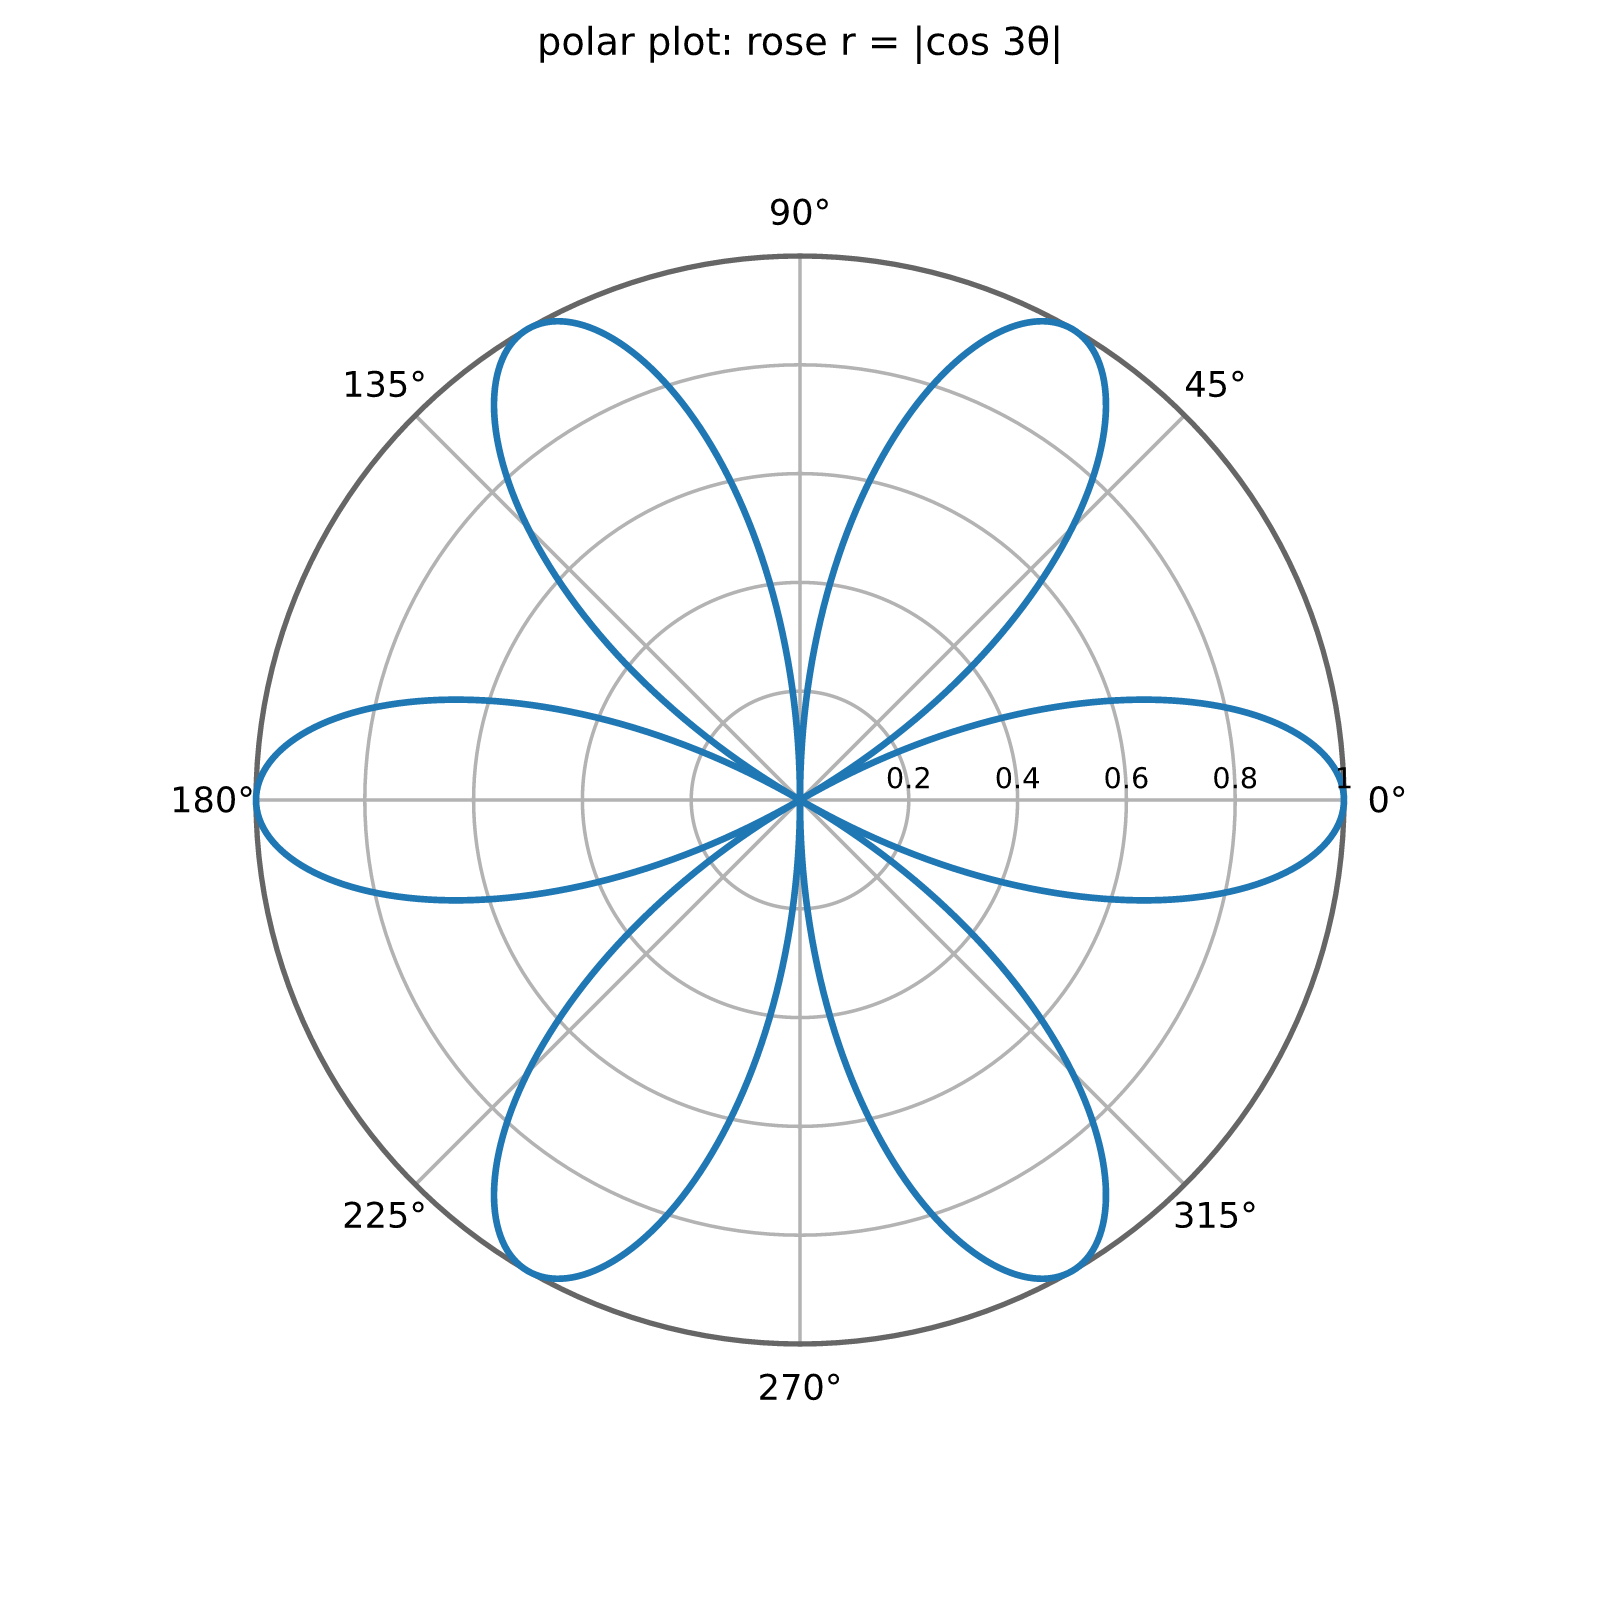
//! <div class="rizzma-live" data-demo="rose">
//!
//! 
//!
//! </div>
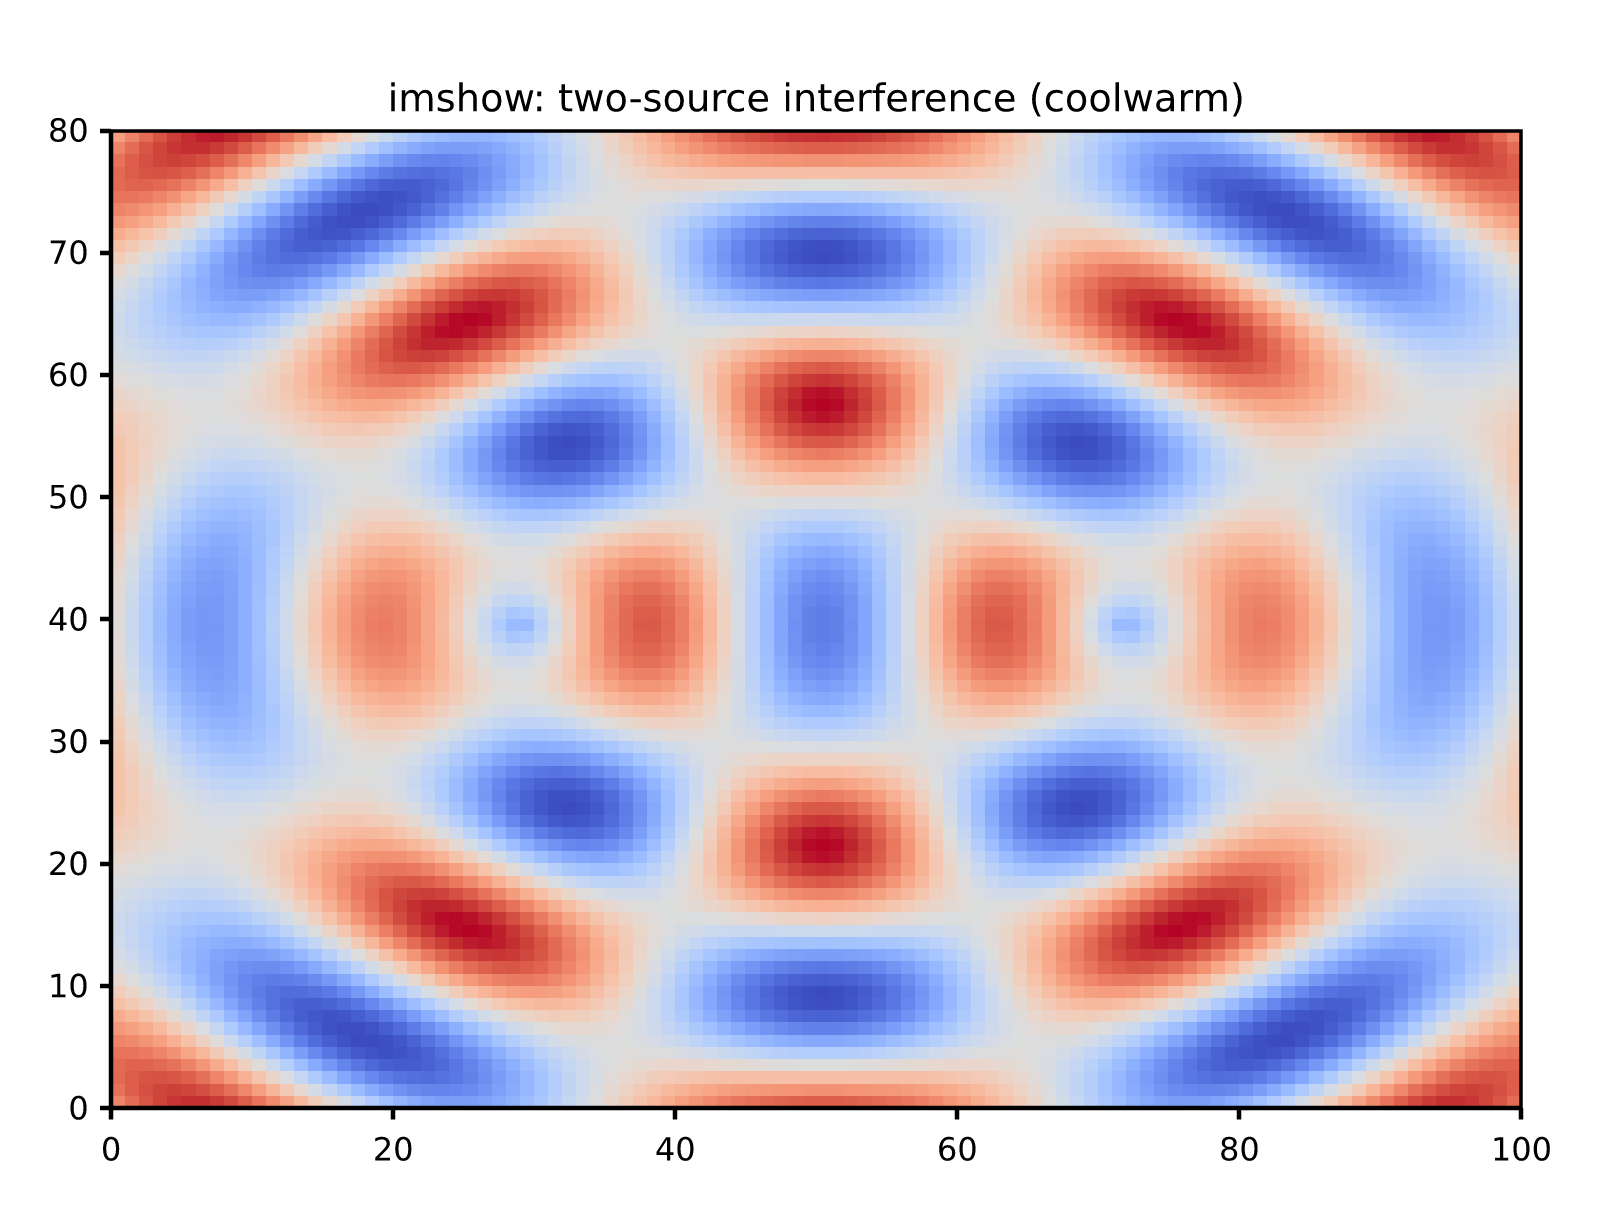
//! <div class="rizzma-live" data-demo="spectro">
//!
//! 
//!
//! </div>
//! <div class="rizzma-live" data-demo="galaxy">
//!
//! 
//!
//! </div>
//! <div class="rizzma-live" data-demo="surface3d">
//!
//! 
//!
//! </div>
//! <div class="rizzma-live" data-demo="ripples">
//!
//! 
//!
//! </div>
//! <div class="rizzma-live" data-demo="lorenz">
//!
//! 
//!
//! </div>
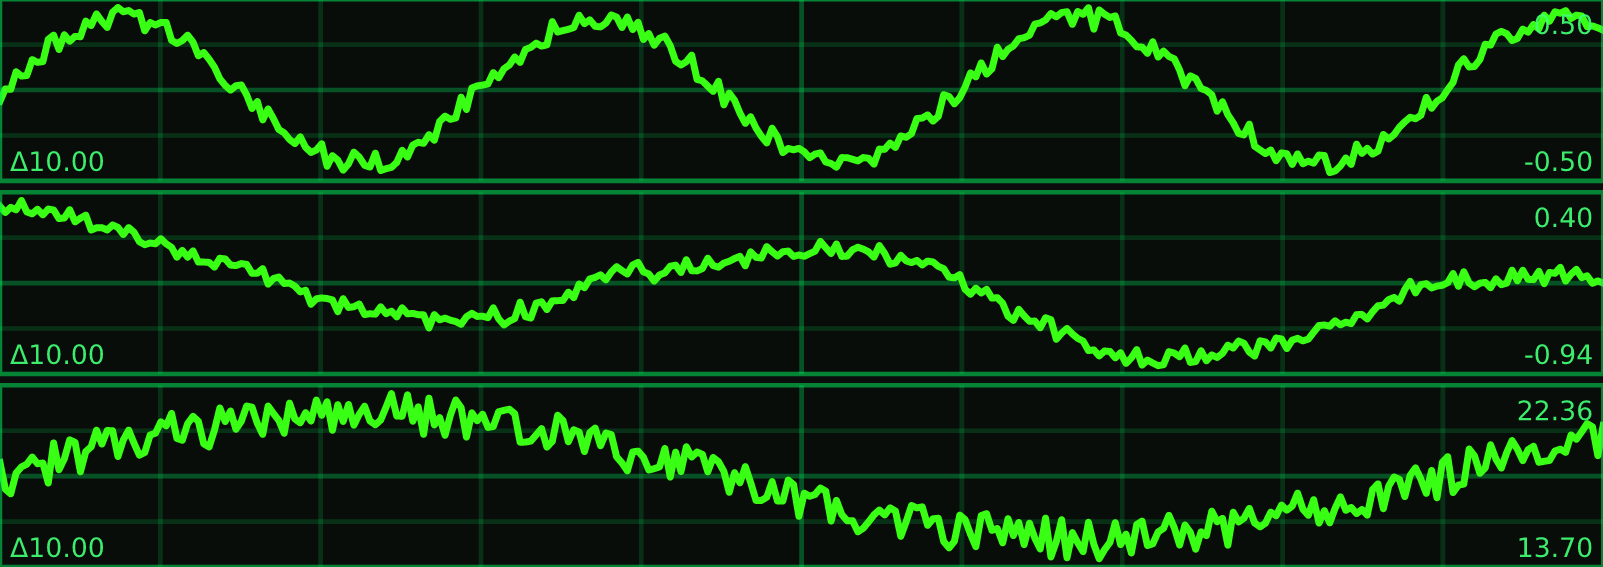
//! <div class="rizzma-live" data-demo="scope">
//!
//! 
//!
//! </div>
//! </div>
//!
//! ## Features
//!
//! The core plotting stack plus the SVG/PDF/raster backends are always compiled.
//! The optional leaf modules are enabled by default but can be turned off:
//!
//! - `plot3d` — the [`mplot3d`] 3D plotting module.
//! - `pyplot` — the stateful [`pyplot`] facade.
//! - `wasm` — the [`wasm`] browser bridge.
//!
//! Building with `--no-default-features` yields the core, figure, and all backends
//! without 3D, pyplot, or wasm.
//!
//! ## Colormaps
//!
//! The default colormap is `bgyw` (CET-L09), a perceptually uniform linear map
//! from Peter Kovesi's CET collection: its lightness rises at a constant rate,
//! so equal steps in your data read as equal steps of contrast on screen. The
//! full set of Kovesi maps featured in the paper ships with the crate,
//! organized by lightness profile — linear, diverging, rainbow, cyclic, and
//! isoluminant; see [`core::color::cmap`] for the taxonomy and when to reach
//! for each class. The classic vendor maps (`jet`, `hot`, `hsv`, `rainbow`)
//! hide and invent features, so they live behind the
//! [`core::color::misleading`] module and a `misleading:` name prefix — usable,
//! but never by accident.
//!
//! Reference: Peter Kovesi. *Good Colour Maps: How to Design Them.*
//! [arXiv:1509.03700 \[cs.GR\] 2015](https://arxiv.org/abs/1509.03700).
pub use ;
/// The version of this crate, from `CARGO_PKG_VERSION`.
pub const VERSION: &str = env!;