1
2
3
4
5
6
7
8
9
10
11
12
13
14
15
16
17
18
19
20
21
22
23
24
25
26
27
28
29
30
31
32
33
34
35
36
37
38
39
40
41
42
43
44
45
46
47
48
49
50
51
52
53
54
55
56
57
58
59
60
61
62
63
64
65
66
67
68
69
70
71
72
73
74
75
76
77
78
79
80
81
82
83
84
85
86
87
88
89
90
91
92
93
94
95
96
97
98
99
100
101
102
103
104
105
106
107
108
109
110
111
112
113
114
115
116
117
118
119
120
121
122
123
124
125
126
127
128
129
130
131
132
133
134
135
136
137
138
139
140
141
142
143
144
145
146
147
148
149
150
151
152
153
154
155
156
157
158
159
160
161
162
163
164
165
166
167
168
169
170
171
172
173
174
175
176
177
178
179
180
181
182
183
184
185
186
187
188
189
190
191
192
193
194
195
196
197
198
199
200
201
202
203
204
205
206
207
208
209
210
211
212
213
214
215
216
217
218
219
220
221
222
223
224
225
226
227
228
229
230
231
232
233
234
235
236
237
238
239
240
241
242
243
244
245
246
247
248
249
250
251
252
253
254
255
256
257
258
259
260
261
262
263
264
265
266
267
268
269
270
271
272
273
274
275
276
277
278
279
280
281
282
283
284
285
286
287
288
289
290
291
292
293
294
295
296
297
298
299
300
301
302
303
304
305
306
307
308
309
310
311
312
313
314
315
316
317
318
319
320
321
322
323
324
325
326
327
328
329
330
331
332
333
334
335
336
337
338
339
340
341
342
343
344
345
346
347
348
349
350
351
352
353
354
355
356
357
358
359
360
361
362
363
364
365
366
367
368
369
370
371
372
373
374
375
376
377
378
379
380
381
382
383
384
385
386
387
388
389
390
391
392
393
394
395
396
397
398
399
400
401
402
403
404
405
406
407
408
409
410
411
412
413
414
415
416
417
418
419
420
421
422
423
424
425
426
427
428
429
430
431
432
433
434
435
436
437
438
439
440
441
442
443
444
445
446
447
448
449
450
451
452
453
454
455
456
457
458
459
460
461
462
463
464
465
466
467
468
469
470
471
472
473
474
475
476
477
478
479
480
481
482
483
484
485
486
487
488
489
490
491
492
493
494
495
496
497
498
499
500
501
502
503
504
505
506
507
508
509
510
511
512
513
514
515
516
517
518
519
520
521
522
523
524
525
526
527
528
529
530
531
532
533
534
535
536
537
538
539
540
541
542
543
544
545
546
547
548
549
550
551
552
553
554
555
556
557
558
559
560
561
562
563
564
565
566
567
568
569
570
571
572
573
574
575
576
577
578
579
580
581
582
583
584
585
586
587
588
589
590
591
592
593
594
595
596
597
598
599
600
601
602
603
604
605
606
607
608
609
610
611
612
613
614
615
616
617
618
619
620
621
622
623
624
625
626
627
628
629
630
631
632
633
634
635
636
637
638
639
640
641
642
643
644
645
646
647
648
649
650
651
652
653
654
655
656
657
658
659
660
661
662
663
664
665
666
667
668
669
670
671
672
673
674
675
676
677
678
679
680
681
682
683
684
685
686
687
688
689
690
691
692
693
694
695
696
697
698
699
700
701
702
703
704
705
706
707
708
709
710
711
712
713
714
715
716
717
718
719
720
721
722
723
724
725
726
727
728
729
730
731
732
733
734
735
736
737
738
739
740
741
742
743
744
745
746
747
748
749
750
751
752
753
754
755
756
757
758
759
760
761
762
763
764
765
766
767
768
769
770
771
772
773
774
775
776
777
778
779
780
781
782
783
784
785
786
787
788
789
790
791
792
793
794
795
796
797
798
799
800
801
802
803
804
805
806
807
808
809
810
811
812
813
814
815
816
817
818
819
820
821
822
823
824
825
826
827
828
829
830
831
832
833
834
835
836
837
838
839
840
841
842
843
844
845
846
847
848
849
850
851
852
853
854
855
856
857
858
859
860
861
862
863
864
865
866
867
868
869
870
871
872
873
874
875
876
877
878
//! Statistical Tier-1 plotting methods on [`Axes`]: scatter, histogram, and
//! error bars.
//!
//! These mirror matplotlib's `scatter`, `hist`, and `errorbar` helpers,
//! translating their arguments into [`Collection`], [`Patch`], and [`Line2D`]
//! artists stored on the [`Axes`]. They live alongside the other Tier-1 helpers
//! in [`plotting`](super::plotting) but are split out to keep that module
//! focused on the line/patch convenience methods.
use crate::artist::{Collection, Line2D, Patch};
use crate::core::Path;
use crate::core::color::{ColorMapping, Rgba};
use crate::figure::Axes;
use crate::render::JoinStyle;
/// Fraction of the x-range used for the horizontal cap half-width drawn at each
/// end of an [`errorbar`](Axes::errorbar) error line.
const ERRORBAR_CAP_FRAC: f64 = 0.01;
/// The finite min/max of `data`, or `None` when there is no finite datum.
fn finite_min_max(data: &[f64]) -> Option<(f64, f64)> {
let mut lo = f64::INFINITY;
let mut hi = f64::NEG_INFINITY;
let mut any = false;
for &v in data {
if v.is_finite() {
lo = lo.min(v);
hi = hi.max(v);
any = true;
}
}
if any { Some((lo, hi)) } else { None }
}
impl Axes {
/// Scatter `y` against `x` as a [`Collection`] of markers.
///
/// Builds a default scatter collection (filled `'o'` marker, size `~6`, the
/// next property-cycle face color, no edge) at the `(x, y)` offsets, stores
/// it on the axes, and returns a mutable reference for further styling. The
/// collection participates in autoscaling via [`data_limits`](Axes::data_limits).
/// Only the common prefix of `x` and `y` is used.
pub fn scatter(&mut self, x: &[f64], y: &[f64]) -> &mut Collection {
let n = x.len().min(y.len());
let offsets: Vec<[f64; 2]> = (0..n).map(|i| [x[i], y[i]]).collect();
let face = self.next_cycle_color();
let coll = Collection::scatter(offsets).with_facecolors(vec![face]);
self.push_collection(coll)
}
/// Scatter `y` against `x` with per-point face colors mapped from `c`.
///
/// Like [`scatter`](Axes::scatter), but each marker's face color is taken
/// from `c` through `mapping`: a colormap name (`"viridis"`), which maps
/// `c` linearly over its own finite range, or a [`ColorMapping`] with
/// `vmin`/`vmax`, a norm, and bad/over/under colors. Points whose `c` is
/// NaN take the bad color (transparent by default), as matplotlib leaves
/// them unplotted. The property cycle is left untouched. Only the common
/// prefix of `x`, `y`, and `c` is used. Returns a mutable reference for
/// further styling.
///
/// ```
/// use rizzma::Figure;
/// use rizzma::core::color::{ColorMapping, TwoSlopeNorm};
/// let (x, y) = ([0.0, 1.0, 2.0, 3.0], [1.0, 3.0, 2.0, 4.0]);
/// let residual = [-0.4, 0.1, 2.5, f64::NAN];
/// let mut fig = Figure::new(4.0, 3.0);
/// let ax = fig.add_subplot(1, 1, 1);
/// ax.scatter_mapped(&x, &y, &residual, "viridis");
/// ax.scatter_mapped(
/// &x,
/// &y,
/// &residual,
/// ColorMapping::new("RdBu").norm(TwoSlopeNorm::new(-0.5, 0.0, 3.0)),
/// );
/// assert!(!fig.encode_png().unwrap().is_empty());
/// ```
pub fn scatter_mapped(
&mut self,
x: &[f64],
y: &[f64],
c: &[f64],
mapping: impl Into<ColorMapping>,
) -> &mut Collection {
let n = x.len().min(y.len()).min(c.len());
let offsets: Vec<[f64; 2]> = (0..n).map(|i| [x[i], y[i]]).collect();
let scale = mapping.into().resolve(&c[..n]);
let coll = Collection::scatter(offsets)
.with_facecolors(scale.colors(&c[..n]))
.with_color_scale(scale);
self.push_collection(coll)
}
/// Draw a histogram of `data` over `bins` equal-width bins.
///
/// Bins span `[min, max]` of the finite data; each datum is counted into its
/// bin (the maximum value falling in the last bin). One [`Patch::rectangle`]
/// is drawn per bin spanning the bin width at height equal to its count, with
/// a black edge and the next property-cycle face color. Returns
/// `(counts, edges)` where `counts` has length `bins` and `edges` has length
/// `bins + 1`. Empty data (or `bins == 0`) yields empty vectors and draws
/// nothing. [`hist_with`](Axes::hist_with) takes explicit edges, a range,
/// weights, density, cumulative counts, step outlines, colors and a label.
pub fn hist(&mut self, data: &[f64], bins: usize) -> (Vec<f64>, Vec<f64>) {
let result = self.hist_with(data, &HistOptions::new().bins(Bins::Count(bins)));
(result.counts, result.edges)
}
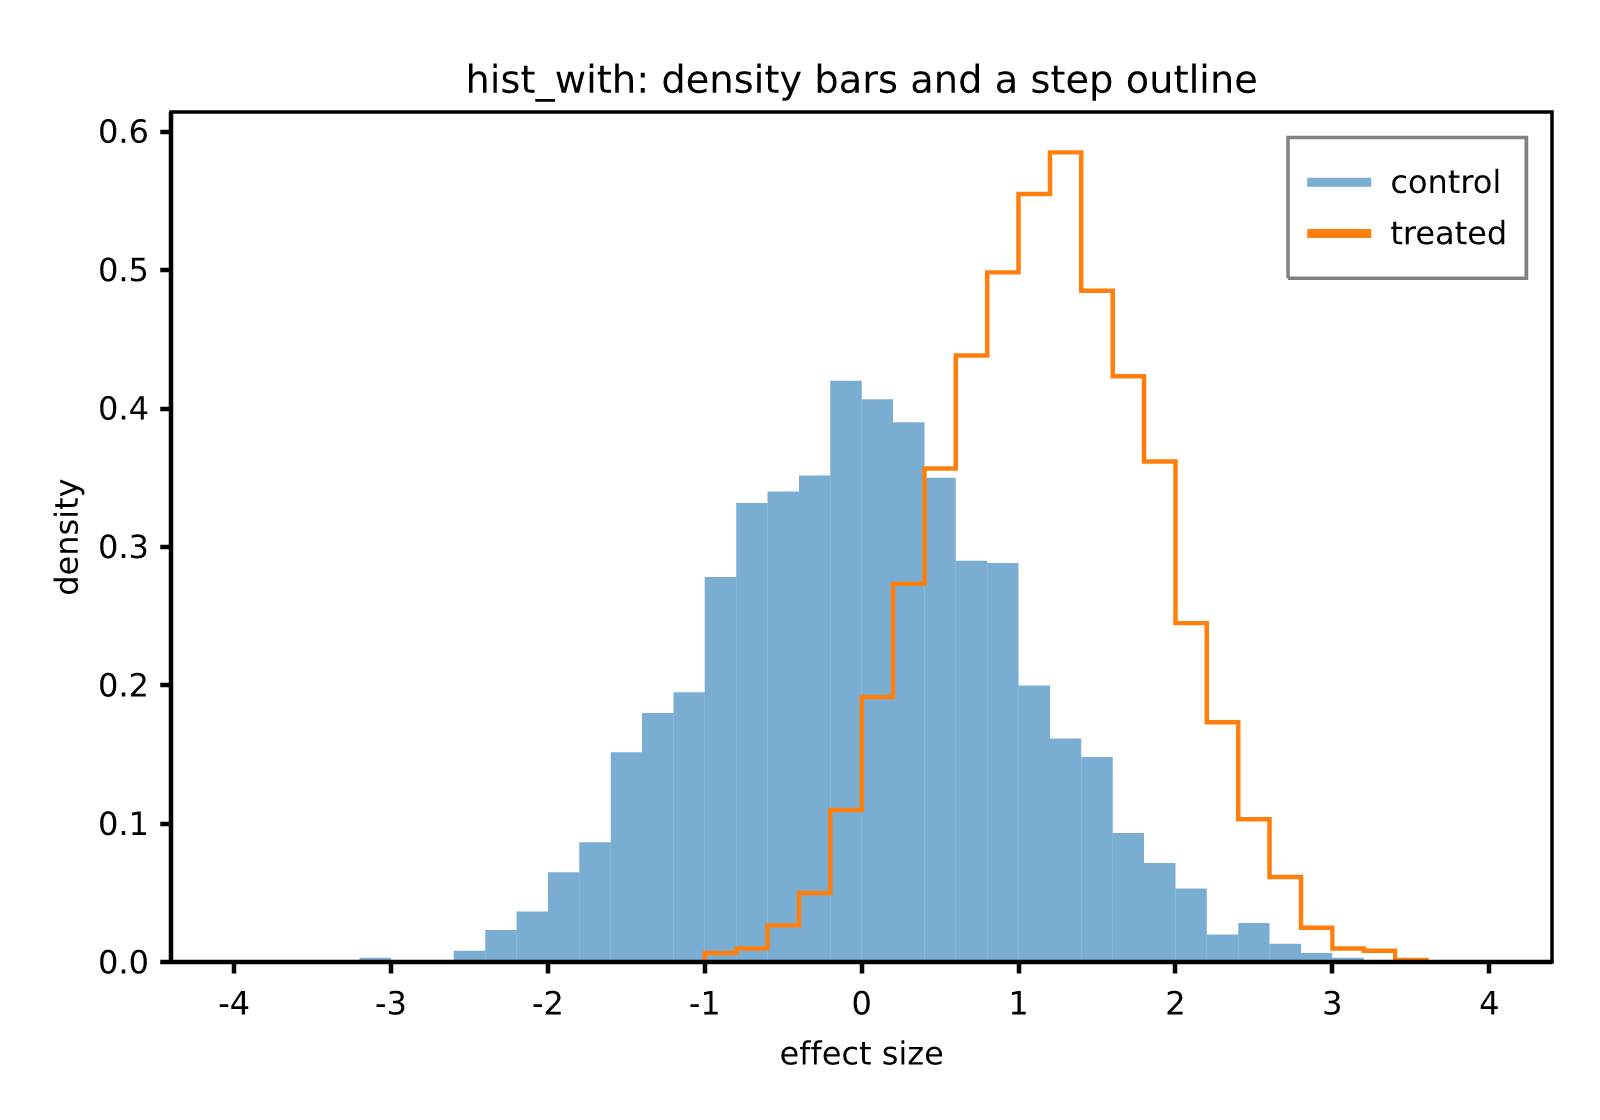
/// Draw a histogram of `data` as matplotlib's `Axes.hist` does, with
/// `options` for its bins, range, weights, density, cumulative counts,
/// histogram type, colors and legend label.
///
/// Counts follow `numpy.histogram`: each bin is half-open, `[e_i,
/// e_{i+1})`, except the last, which includes its right edge, and values
/// outside the range are dropped, as are non-finite ones. Density divides
/// each count by the total and its bin width, so the bars integrate to
/// one; cumulative counts accumulate after that, as matplotlib's do.
///
/// Returns the counts and edges, and the range of the drawn bars among
/// [`patches`](Axes::patches), so they can be restyled in place through
/// [`patches_mut`](Axes::patches_mut). A [`HistType::Bar`] histogram
/// draws one rectangle per bin; a step histogram draws one outline.
///
/// 
///
/// ```
/// use rizzma::Figure;
/// use rizzma::core::color::Rgba;
/// use rizzma::figure::{Bins, HistOptions, HistType};
///
/// let data = [1.0, 2.0, 2.0, 3.0, 3.0, 3.0, 4.5];
/// let mut fig = Figure::new(4.0, 3.0);
/// let ax = fig.add_subplot(1, 1, 1);
/// let hist = ax.hist_with(
/// &data,
/// &HistOptions::new()
/// .bins(Bins::Edges(vec![0.0, 1.5, 2.5, 3.5, 5.0]))
/// .density(true)
/// .histtype(HistType::Step)
/// .color(Rgba::BLUE)
/// .label("sample"),
/// );
/// assert_eq!(hist.counts.len(), 4);
/// ax.legend_auto();
/// ```
pub fn hist_with(&mut self, data: &[f64], options: &HistOptions) -> HistResult {
// Count bars rise from zero: pin the baseline.
self.sticky_y.push(0.0);
let first_patch = self.patches.len();
let empty = |first| HistResult {
counts: Vec::new(),
edges: Vec::new(),
patches: first..first,
};
let Some(edges) = options.edges(data) else {
return empty(first_patch);
};
let counts = options.counts(data, &edges);
let color = match options.color {
Some(color) => color,
None => self.next_cycle_color(),
};
let alpha = |c: Rgba| match options.alpha {
Some(a) => c.with_alpha(c.a * a.clamp(0.0, 1.0)),
None => c,
};
let label = options.label.clone();
match options.histtype {
HistType::Bar => {
let edge = options.edgecolor.unwrap_or(Some(Rgba::BLACK)).map(alpha);
for (i, &count) in counts.iter().enumerate() {
let width = options.bar_width(&edges, i);
let mut patch = Patch::rectangle(edges[i], 0.0, width, count)
.facecolor(Some(alpha(color)))
.edgecolor(edge);
if i == 0 {
if let Some(label) = &label {
patch.set_label(label.clone());
}
}
self.add_patch(patch);
}
}
HistType::Step | HistType::StepFilled => {
let filled = options.histtype == HistType::StepFilled;
let mut outline = Vec::with_capacity(4 * edges.len());
outline.push([edges[0], 0.0]);
for (i, &count) in counts.iter().enumerate() {
outline.push([edges[i], count]);
outline.push([edges[i + 1], count]);
}
outline.push([edges[edges.len() - 1], 0.0]);
if filled {
// Back along the baseline, every edge twice, as
// matplotlib builds the filled outline.
for &e in edges[..edges.len() - 1].iter().rev() {
outline.push([e, 0.0]);
outline.push([e, 0.0]);
}
outline.pop();
}
let (face, edge) = if filled {
(Some(alpha(color)), options.edgecolor.flatten().map(alpha))
} else {
(
None,
Some(alpha(options.edgecolor.flatten().unwrap_or(color))),
)
};
let mut patch = Patch::new(Path::from_polyline(&outline))
.facecolor(face)
.edgecolor(edge);
if let Some(label) = label {
patch.set_label(label);
}
self.add_patch(patch);
}
}
HistResult {
counts,
edges,
patches: first_patch..self.patches.len(),
}
}
/// Plot `y` against `x` with symmetric vertical error bars `yerr`.
///
/// Adds the central [`Line2D`] through `(x, y)` plus, per point, a vertical
/// error [`Line2D`] from `(xi, yi - ei)` to `(xi, yi + ei)` with short
/// horizontal caps (a few percent of the x-range wide) at each end. All
/// pieces are added as plain lines on the axes, so their extents feed
/// autoscaling. Only the common prefix of `x`, `y`, and `yerr` is used.
// TODO: group these into a dedicated `ErrorbarContainer` artist once one
// exists, rather than loose `Line2D`s.
pub fn errorbar(&mut self, x: &[f64], y: &[f64], yerr: &[f64]) {
self.errorbar_with(x, y, yerr, &ErrorbarOptions::default());
}
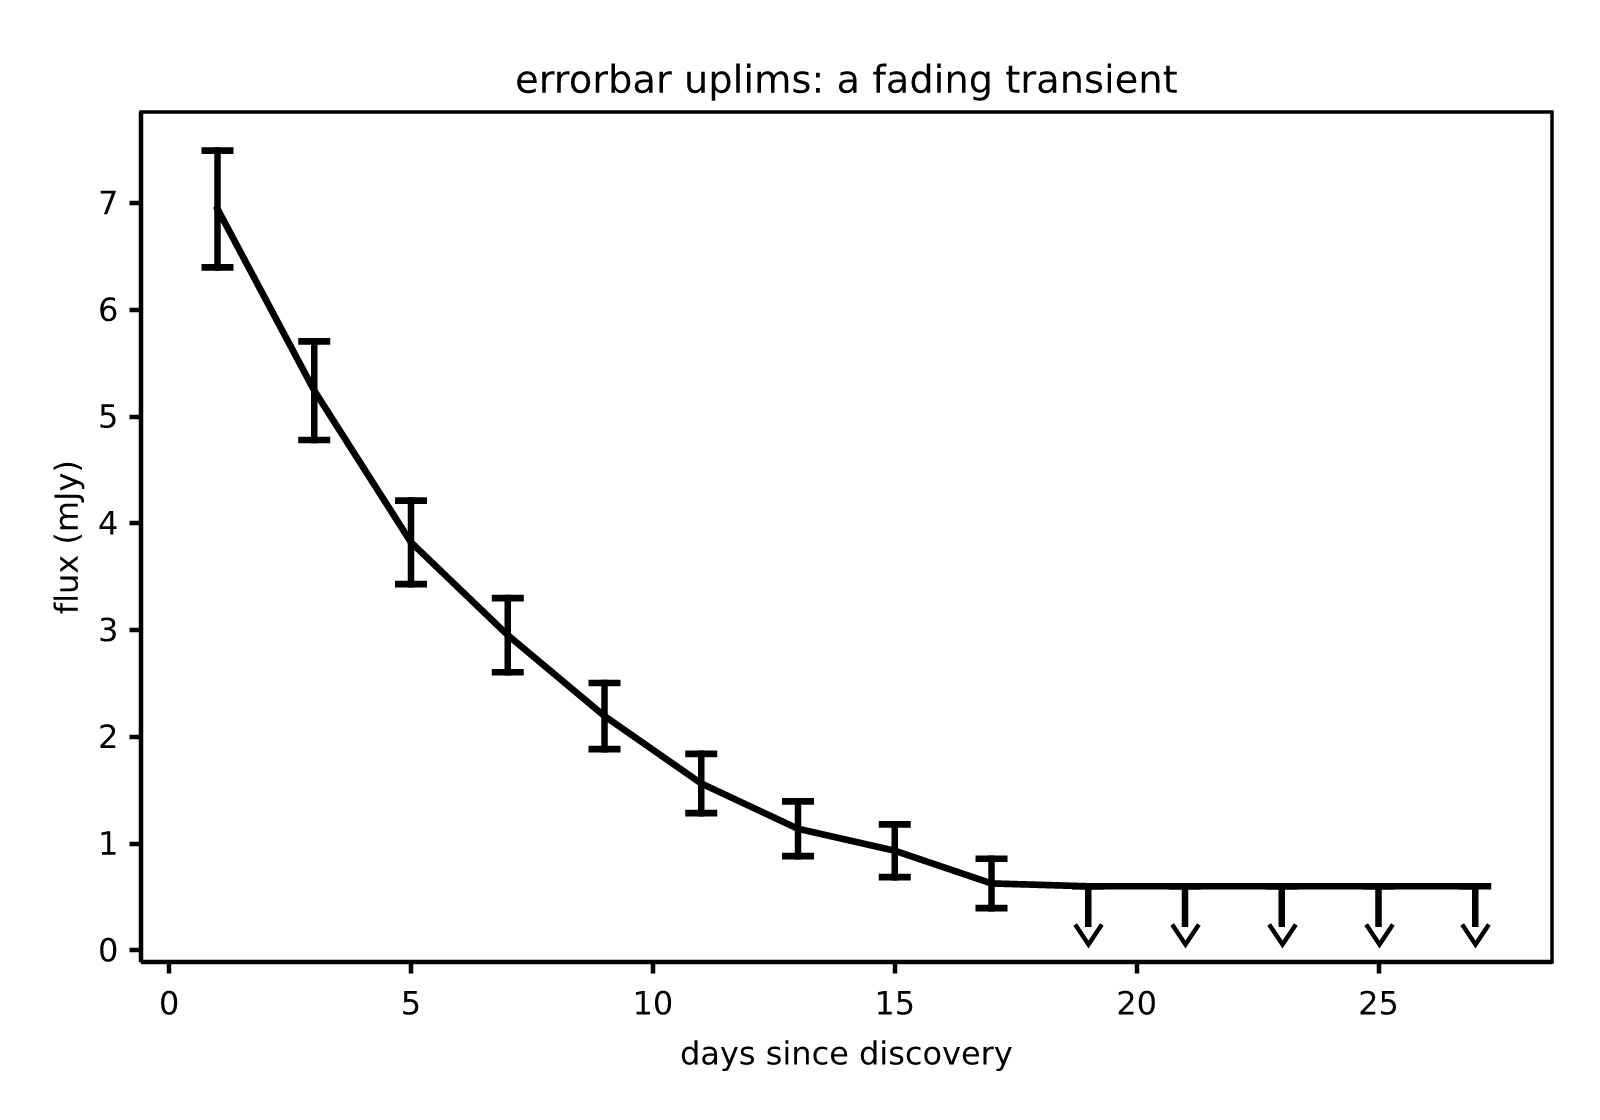
/// [`errorbar`](Axes::errorbar) with upper and lower limits and horizontal
/// errors — matplotlib's `uplims`, `lolims`, `xerr`, `xuplims` and
/// `xlolims`.
///
/// A point flagged as an upper limit keeps only the lower half of its
/// bar, from `y - err` up to `y`, and gets a caret pointing down from
/// `y - err`; a lower limit keeps the upper half and points up from
/// `y + err`. Its cap moves to the value itself, as matplotlib draws one
/// when caps are on. The carets are matplotlib's `caretdownbase` /
/// `caretupbase` markers, 6 points wide, unfilled; the x variants point
/// left from `x - xerr` and right from `x + xerr`. Unflagged points draw
/// exactly as [`errorbar`](Axes::errorbar) draws them.
///
/// 
///
/// ```
/// use rizzma::Figure;
/// use rizzma::figure::ErrorbarOptions;
/// let (t, flux, err) = ([1.0, 2.0, 3.0, 4.0], [3.2, 2.0, 2.7, 1.5], [0.3, 0.6, 0.3, 0.6]);
/// let mut fig = Figure::new(4.0, 3.0);
/// fig.add_subplot(1, 1, 1).errorbar_with(
/// &t,
/// &flux,
/// &err,
/// &ErrorbarOptions::new().uplims(&[false, true, false, true]),
/// );
/// assert!(!fig.encode_png().unwrap().is_empty());
/// ```
pub fn errorbar_with(&mut self, x: &[f64], y: &[f64], yerr: &[f64], options: &ErrorbarOptions) {
let n = x.len().min(y.len()).min(yerr.len());
if n == 0 {
return;
}
// Central line through the data points.
self.add_line(Line2D::new(x[..n].to_vec(), y[..n].to_vec()));
// Cap half-widths as a fraction of the data range across each bar.
let cap_for = |across: &[f64]| match finite_min_max(across) {
Some((lo, hi)) if (hi - lo).abs() > f64::EPSILON => (hi - lo) * ERRORBAR_CAP_FRAC,
_ => ERRORBAR_CAP_FRAC,
};
let cap = cap_for(&x[..n]);
let flag = |mask: &[bool], i: usize| mask.get(i).copied().unwrap_or(false);
let mut carets = Carets::default();
for i in 0..n {
let (xi, yi, ei) = (x[i], y[i], yerr[i]);
let (up, lo) = (flag(&options.uplims, i), flag(&options.lolims, i));
let low = if lo { yi } else { yi - ei };
let high = if up { yi } else { yi + ei };
// Vertical bar.
self.add_line(Line2D::new(vec![xi, xi], vec![low, high]));
if up || lo {
// The cap marks the value; the caret marks the open end.
self.add_line(Line2D::new(vec![xi - cap, xi + cap], vec![yi, yi]));
if lo {
carets.up.push([xi, high]);
}
if up {
carets.down.push([xi, low]);
}
} else {
// Horizontal caps at each end.
self.add_line(Line2D::new(vec![xi - cap, xi + cap], vec![low, low]));
self.add_line(Line2D::new(vec![xi - cap, xi + cap], vec![high, high]));
}
}
let m = n.min(options.xerr.len());
let ycap = cap_for(&y[..n]);
for i in 0..m {
let (xi, yi, ei) = (x[i], y[i], options.xerr[i]);
let (up, lo) = (flag(&options.xuplims, i), flag(&options.xlolims, i));
let left = if lo { xi } else { xi - ei };
let right = if up { xi } else { xi + ei };
// Horizontal bar.
self.add_line(Line2D::new(vec![left, right], vec![yi, yi]));
if up || lo {
self.add_line(Line2D::new(vec![xi, xi], vec![yi - ycap, yi + ycap]));
if lo {
carets.right.push([right, yi]);
}
if up {
carets.left.push([left, yi]);
}
} else {
// Vertical caps at each end.
self.add_line(Line2D::new(vec![left, left], vec![yi - ycap, yi + ycap]));
self.add_line(Line2D::new(vec![right, right], vec![yi - ycap, yi + ycap]));
}
}
carets.add_to(self);
}
}
/// How a histogram's bins are chosen: matplotlib's `bins` argument.
#[derive(Debug, Clone, PartialEq)]
pub enum Bins {
/// This many equal-width bins over the range (the data's, by default).
Count(usize),
/// Explicit, increasing bin edges: `n + 1` edges make `n` bins.
Edges(Vec<f64>),
}
/// How a histogram is drawn: matplotlib's `histtype`.
#[derive(Debug, Clone, Copy, PartialEq, Eq, Default)]
pub enum HistType {
/// One filled rectangle per bin (`"bar"`).
#[default]
Bar,
/// One unfilled outline along the bin tops (`"step"`).
Step,
/// The outline filled (`"stepfilled"`).
StepFilled,
}
/// Options for [`Axes::hist_with`]: matplotlib's `bins`, `range`,
/// `weights`, `density`, `cumulative`, `histtype`, `color`, `edgecolor`,
/// `alpha` and `label`.
#[derive(Debug, Clone, PartialEq)]
pub struct HistOptions {
bins: Bins,
range: Option<(f64, f64)>,
weights: Option<Vec<f64>>,
density: bool,
cumulative: bool,
histtype: HistType,
color: Option<Rgba>,
/// `None` keeps the histogram type's default edge; `Some(None)` none.
edgecolor: Option<Option<Rgba>>,
alpha: Option<f64>,
label: Option<String>,
}
impl Default for HistOptions {
fn default() -> Self {
Self {
bins: Bins::Count(10),
range: None,
weights: None,
density: false,
cumulative: false,
histtype: HistType::Bar,
color: None,
edgecolor: None,
alpha: None,
label: None,
}
}
}
impl HistOptions {
/// Ten equal-width bar bins over the data, in the next cycle color —
/// matplotlib's defaults, except that bars keep the black edge
/// [`Axes::hist`] has always drawn.
#[must_use]
pub fn new() -> Self {
Self::default()
}
/// The bins: a count, or explicit edges.
#[must_use]
pub fn bins(mut self, bins: Bins) -> Self {
self.bins = bins;
self
}
/// The `(lower, upper)` range counted bins span; values outside it are
/// dropped. Ignored with explicit edges.
#[must_use]
pub fn range(mut self, lower: f64, upper: f64) -> Self {
self.range = Some((lower, upper));
self
}
/// Weight each datum (by index; a shorter list leaves the rest weighing 1).
#[must_use]
pub fn weights(mut self, weights: &[f64]) -> Self {
self.weights = Some(weights.to_vec());
self
}
/// Normalize so the bars integrate to one.
#[must_use]
pub fn density(mut self, density: bool) -> Self {
self.density = density;
self
}
/// Accumulate the counts from the first bin.
#[must_use]
pub fn cumulative(mut self, cumulative: bool) -> Self {
self.cumulative = cumulative;
self
}
/// Bars, a step outline, or a filled step outline.
#[must_use]
pub fn histtype(mut self, histtype: HistType) -> Self {
self.histtype = histtype;
self
}
/// The fill color (the outline's for [`HistType::Step`]); the next
/// cycle color by default.
#[must_use]
pub fn color(mut self, color: Rgba) -> Self {
self.color = Some(color);
self
}
/// The edge color, or `None` for no edge. By default bars have a black
/// edge, a step outline is drawn in its color, and a filled step has none.
#[must_use]
pub fn edgecolor(mut self, edgecolor: Option<Rgba>) -> Self {
self.edgecolor = Some(edgecolor);
self
}
/// Scale every color's opacity by `alpha` (`0..=1`).
#[must_use]
pub fn alpha(mut self, alpha: f64) -> Self {
self.alpha = Some(alpha);
self
}
/// The label [`Axes::legend_auto`] shows for the histogram.
#[must_use]
pub fn label(mut self, label: impl Into<String>) -> Self {
self.label = Some(label.into());
self
}
/// The bin edges for `data`, or `None` when there is nothing to bin.
/// Counted bins are `numpy.linspace` over the range (the finite data's
/// by default, widened by ±0.5 when it is a single value).
fn edges(&self, data: &[f64]) -> Option<Vec<f64>> {
match &self.bins {
Bins::Edges(edges) => (edges.len() >= 2
&& edges.iter().all(|e| e.is_finite())
&& edges.windows(2).all(|w| w[0] < w[1]))
.then(|| edges.clone()),
&Bins::Count(n) => {
let (lo, hi) = self.range.or_else(|| finite_min_max(data))?;
if n == 0 || !(lo.is_finite() && hi.is_finite()) || hi < lo {
return None;
}
let (lo, hi) = if lo == hi {
(lo - 0.5, hi + 0.5)
} else {
(lo, hi)
};
let step = (hi - lo) / n as f64;
let mut edges: Vec<f64> = (0..=n).map(|i| lo + i as f64 * step).collect();
edges[n] = hi;
Some(edges)
}
}
}
/// The width of bar `i`: the uniform step for counted bins (so equal
/// bins are drawn equal), the edge difference otherwise.
fn bar_width(&self, edges: &[f64], i: usize) -> f64 {
match self.bins {
Bins::Count(n) => (edges[n] - edges[0]) / n as f64,
Bins::Edges(_) => edges[i + 1] - edges[i],
}
}
/// The bar heights over `edges`: `numpy.histogram`'s weighted counts,
/// then density and cumulative as matplotlib applies them.
fn counts(&self, data: &[f64], edges: &[f64]) -> Vec<f64> {
let n = edges.len() - 1;
let (first, last) = (edges[0], edges[n]);
let weight = |k: usize| {
self.weights
.as_ref()
.and_then(|w| w.get(k))
.copied()
.unwrap_or(1.0)
};
let mut counts = vec![0.0; n];
if let (Bins::Edges(_), Some(_)) = (&self.bins, &self.weights) {
// numpy sums weights over explicit edges by sorting, taking a
// running total and differencing it at the edges; doing the
// same keeps the floats identical.
let mut sorted: Vec<(f64, f64)> = data
.iter()
.enumerate()
.filter(|(_, v)| v.is_finite())
.map(|(k, &v)| (v, weight(k)))
.collect();
sorted.sort_by(|a, b| a.0.total_cmp(&b.0));
let mut running = Vec::with_capacity(sorted.len() + 1);
running.push(0.0);
for &(_, w) in &sorted {
running.push(running[running.len() - 1] + w);
}
let at = |i: usize| {
if i < n {
sorted.partition_point(|&(v, _)| v < edges[i])
} else {
sorted.partition_point(|&(v, _)| v <= edges[i])
}
};
for (i, c) in counts.iter_mut().enumerate() {
*c = running[at(i + 1)] - running[at(i)];
}
} else {
// Unweighted counts are whole numbers either way; weights over
// counted bins accumulate in data order, as numpy's bincount does.
for (k, &v) in data.iter().enumerate() {
if !v.is_finite() || v < first || v > last {
continue;
}
let i = match &self.bins {
Bins::Count(_) => {
// numpy's uniform-bin index, corrected against the
// edges for values rounding put in a neighbour.
let mut i = ((v - first) * (n as f64 / (last - first))) as usize;
i = i.min(n - 1);
if i > 0 && v < edges[i] {
i -= 1;
} else if i + 1 < n && v >= edges[i + 1] {
i += 1;
}
i
}
Bins::Edges(_) => edges
.partition_point(|&e| e <= v)
.saturating_sub(1)
.min(n - 1),
};
counts[i] += weight(k);
}
}
if self.density {
let total: f64 = counts.iter().sum();
if total > 0.0 {
for (i, c) in counts.iter_mut().enumerate() {
// numpy's order, `n / db / n.sum()`, for identical floats.
*c = *c / (edges[i + 1] - edges[i]) / total;
}
}
}
if self.cumulative {
let mut running = 0.0;
for (i, c) in counts.iter_mut().enumerate() {
running += if self.density {
*c * (edges[i + 1] - edges[i])
} else {
*c
};
*c = running;
}
}
counts
}
}
/// What [`Axes::hist_with`] returns: matplotlib's `(n, bins, patches)`.
#[derive(Debug, Clone, PartialEq)]
pub struct HistResult {
/// The bar heights (counts, densities or running totals).
pub counts: Vec<f64>,
/// The bin edges, one more than the counts.
pub edges: Vec<f64>,
/// The drawn bars' indices among [`Axes::patches`]: one per bin for
/// [`HistType::Bar`], one outline otherwise; empty when nothing drew.
pub patches: std::ops::Range<usize>,
}
/// Upper and lower limits and horizontal errors for
/// [`Axes::errorbar_with`] — matplotlib's `uplims`, `lolims`, `xerr`,
/// `xuplims` and `xlolims`. Masks shorter than the series leave the rest of
/// its points unflagged.
#[derive(Debug, Clone, Default, PartialEq)]
pub struct ErrorbarOptions {
uplims: Vec<bool>,
lolims: Vec<bool>,
xerr: Vec<f64>,
xuplims: Vec<bool>,
xlolims: Vec<bool>,
}
impl ErrorbarOptions {
/// No limits and no horizontal errors.
#[must_use]
pub fn new() -> Self {
Self::default()
}
/// Flag the points whose value is an upper limit.
#[must_use]
pub fn uplims(mut self, mask: &[bool]) -> Self {
self.uplims = mask.to_vec();
self
}
/// Flag the points whose value is a lower limit.
#[must_use]
pub fn lolims(mut self, mask: &[bool]) -> Self {
self.lolims = mask.to_vec();
self
}
/// Add symmetric horizontal error bars.
#[must_use]
pub fn xerr(mut self, xerr: &[f64]) -> Self {
self.xerr = xerr.to_vec();
self
}
/// Flag the points whose `x` is an upper limit (caret pointing left).
#[must_use]
pub fn xuplims(mut self, mask: &[bool]) -> Self {
self.xuplims = mask.to_vec();
self
}
/// Flag the points whose `x` is a lower limit (caret pointing right).
#[must_use]
pub fn xlolims(mut self, mask: &[bool]) -> Self {
self.xlolims = mask.to_vec();
self
}
}
/// matplotlib's default marker size, which its limit carets take when caps
/// have no size of their own.
const CARET_SIZE: f64 = 6.0;
/// matplotlib's default marker edge width, in points.
const CARET_WIDTH: f64 = 1.0;
/// Limit carets by direction, at the bar ends they mark.
#[derive(Default)]
struct Carets {
up: Vec<[f64; 2]>,
down: Vec<[f64; 2]>,
left: Vec<[f64; 2]>,
right: Vec<[f64; 2]>,
}
impl Carets {
/// Add one unfilled marker collection per direction in use.
fn add_to(self, ax: &mut Axes) {
// matplotlib's `_caret_path_base` at its 0.5 scale: the base on the
// point, the tip 0.75 marker sizes away.
let base = [[-0.5, 0.0], [0.0, -0.75], [0.5, 0.0]];
let turned = |f: fn([f64; 2]) -> [f64; 2]| Path::from_polyline(&base.map(f));
let sets = [
(self.down, turned(|p| p)),
(self.up, turned(|[x, y]| [x, -y])),
(self.left, turned(|[x, y]| [y, x])),
(self.right, turned(|[x, y]| [-y, x])),
];
for (offsets, marker) in sets {
if offsets.is_empty() {
continue;
}
ax.push_collection(
Collection::scatter(offsets)
.with_marker(marker)
.with_sizes(vec![CARET_SIZE])
.with_facecolors(Vec::new())
.with_edgecolors(vec![Rgba::BLACK])
.linewidth(CARET_WIDTH)
// matplotlib draws carets as line markers, which miter.
.with_joinstyle(JoinStyle::Miter)
.with_zorder(2.0),
);
}
}
}
#[cfg(test)]
mod tests {
use super::*;
use crate::artist::Artist;
use crate::core::Bbox;
fn approx(a: f64, b: f64) {
assert!((a - b).abs() < 1e-9, "expected {b}, got {a}");
}
#[test]
fn scatter_adds_a_collection_covering_the_data() {
let mut ax = Axes::new(Bbox::from_extents(0.0, 0.0, 1.0, 1.0));
let x = [0.0, 1.0, 2.0, 3.0];
let y = [-1.0, 4.0, 2.0, 0.0];
ax.scatter(&x, &y);
assert_eq!(ax.collections.len(), 1);
let e = ax.collections[0]
.data_extents()
.expect("collection has extents");
approx(e.xmin(), 0.0);
approx(e.xmax(), 3.0);
approx(e.ymin(), -1.0);
approx(e.ymax(), 4.0);
}
#[test]
fn data_limits_include_scatter_collection() {
let mut ax = Axes::new(Bbox::from_extents(0.0, 0.0, 1.0, 1.0));
ax.scatter(&[5.0, 7.0], &[10.0, 20.0]);
let e = ax.data_limits().expect("scatter contributes data limits");
approx(e.xmin(), 5.0);
approx(e.xmax(), 7.0);
approx(e.ymin(), 10.0);
approx(e.ymax(), 20.0);
}
#[test]
fn set_collection_offsets_replaces_data_and_checks_range() {
let mut ax = Axes::new(Bbox::from_extents(0.0, 0.0, 1.0, 1.0));
ax.scatter(&[0.0, 1.0], &[0.0, 1.0]);
ax.set_collection_offsets(0, &[5.0, 7.0, 9.0], &[10.0, 20.0])
.expect("collection 0 exists");
// Common prefix of x/y is used; extents re-derive from the new data.
let e = ax.collections[0]
.data_extents()
.expect("collection has extents");
approx(e.xmin(), 5.0);
approx(e.xmax(), 7.0);
approx(e.ymin(), 10.0);
approx(e.ymax(), 20.0);
let err = ax
.set_collection_offsets(3, &[0.0], &[0.0])
.expect_err("index 3 is out of range");
assert!(err.contains("out of range"), "unexpected error: {err}");
}
#[test]
fn scatter_mapped_sets_per_point_face_colors() {
let mut ax = Axes::new(Bbox::from_extents(0.0, 0.0, 1.0, 1.0));
let x = [0.0, 1.0, 2.0];
let y = [0.0, 1.0, 2.0];
let c = [0.0, 0.5, 1.0];
ax.scatter_mapped(&x, &y, &c, "viridis");
assert_eq!(ax.collections.len(), 1);
// The property cycle is untouched by the mapped variant.
assert_eq!(ax.prop_cycle_index, 0);
}
#[test]
fn hist_returns_expected_counts_and_edges() {
let mut ax = Axes::new(Bbox::from_extents(0.0, 0.0, 1.0, 1.0));
// Four bins over [0, 4]: edges 0,1,2,3,4.
let data = [0.0, 0.5, 1.5, 1.5, 2.5, 4.0];
let (counts, edges) = ax.hist(&data, 4);
assert_eq!(edges.len(), 5);
// bin0: [0,1) -> 0.0,0.5 => 2; bin1: [1,2) -> 1.5,1.5 => 2;
// bin2: [2,3) -> 2.5 => 1; bin3: [3,4] -> 4.0 => 1.
assert_eq!(counts, vec![2.0, 2.0, 1.0, 1.0]);
assert_eq!(ax.patches.len(), 4);
}
#[test]
fn hist_edges_are_evenly_spaced() {
let mut ax = Axes::new(Bbox::from_extents(0.0, 0.0, 1.0, 1.0));
let data = [0.0, 10.0];
let (_counts, edges) = ax.hist(&data, 5);
for (i, &edge) in edges.iter().enumerate() {
approx(edge, i as f64 * 2.0);
}
}
#[test]
fn hist_empty_data_is_empty() {
let mut ax = Axes::new(Bbox::from_extents(0.0, 0.0, 1.0, 1.0));
let (counts, edges) = ax.hist(&[], 4);
assert!(counts.is_empty());
assert!(edges.is_empty());
assert!(ax.patches.is_empty());
}
#[test]
fn errorbar_adds_central_line_plus_per_point_lines() {
let mut ax = Axes::new(Bbox::from_extents(0.0, 0.0, 1.0, 1.0));
let x = [0.0, 1.0, 2.0];
let y = [1.0, 2.0, 3.0];
let yerr = [0.5, 0.5, 0.5];
ax.errorbar(&x, &y, &yerr);
// 1 central line + 3 per-point (1 vertical + 2 caps) = 1 + 9 = 10.
assert_eq!(ax.lines.len(), 1 + 3 * 3);
}
#[test]
fn errorbar_extents_include_error_range() {
let mut ax = Axes::new(Bbox::from_extents(0.0, 0.0, 1.0, 1.0));
ax.errorbar(&[0.0, 1.0], &[5.0, 5.0], &[2.0, 2.0]);
let e = ax.data_limits().expect("errorbar contributes data limits");
approx(e.ymin(), 3.0);
approx(e.ymax(), 7.0);
}
#[test]
fn limits_keep_half_the_bar_and_mark_the_open_end() {
let mut ax = Axes::new(Bbox::from_extents(0.0, 0.0, 1.0, 1.0));
ax.errorbar_with(
&[0.0, 1.0, 2.0],
&[5.0, 5.0, 5.0],
&[2.0, 2.0, 2.0],
&ErrorbarOptions::new()
.uplims(&[false, true])
.lolims(&[false, false, true])
.xerr(&[0.5, 0.5])
.xuplims(&[true]),
);
let bar = |i: usize| ax.lines[i].points();
// Lines: the central line, then (bar, cap, cap) for point 0 and
// (bar, cap) for each limit point, then the x bars.
assert_eq!(bar(1), [[0.0, 3.0], [0.0, 7.0]]);
assert_eq!(bar(4), [[1.0, 3.0], [1.0, 5.0]]); // upper limit: below y
assert_eq!(bar(5)[0][1], 5.0); // its cap sits on the value
assert_eq!(bar(6), [[2.0, 5.0], [2.0, 7.0]]); // lower limit: above y
assert_eq!(bar(8), [[-0.5, 5.0], [0.0, 5.0]]); // x upper limit: left of x
// One caret collection per direction used: down, up, left.
let carets: Vec<Vec<[f64; 2]>> = ax
.collections
.iter()
.map(|c| c.offsets().to_vec())
.collect();
assert_eq!(
carets,
[vec![[1.0, 3.0]], vec![[2.0, 7.0]], vec![[-0.5, 5.0]]]
);
}
#[test]
fn errorbar_without_limits_adds_no_carets() {
let mut ax = Axes::new(Bbox::from_extents(0.0, 0.0, 1.0, 1.0));
ax.errorbar(&[0.0, 1.0], &[5.0, 5.0], &[2.0, 2.0]);
assert!(ax.collections.is_empty());
assert_eq!(ax.lines.len(), 1 + 2 * 3);
}
}