1
2
3
4
5
6
7
8
9
10
11
12
13
14
15
16
17
18
19
20
21
22
23
24
25
26
27
28
29
30
31
32
33
34
35
36
37
38
39
40
41
42
43
44
45
46
47
48
49
50
51
52
53
54
55
56
57
58
59
60
61
62
63
64
65
66
67
68
69
70
71
72
73
74
75
76
77
78
79
80
81
82
83
84
85
86
87
88
89
90
91
92
93
94
95
96
97
98
99
/*!
# Quick start with Google Forms
This example shows you how to run an example end to end, using an online tool to collect the votes. This example uses Google Forms because it
is free to use and has a large limit (millions of votes). Other providers (Microsoft, Qualtrics) provide similar systems for free.
This section assumes that you have an account on Google Drive (either through the free GMail service or a professional Google Workspace).
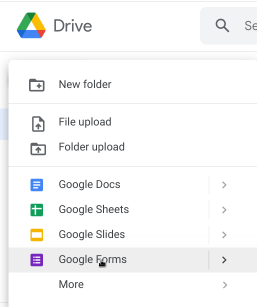
We would like to decide on the election between 3 candidates: Alice, Bob and Charlie. To do that, we are going to create a new Form in Google
Drive:
**Creating a poll** We are going to populate this form with one voting question. Use the **Multiple Choice Grid** type of widget to add a voting question.
The rows are the ranking choices (`1`, `2`, `3`, etc.), the columns are the candidates (`Alice`, `Bob`, `Charlie`).
The name of the question is also important as it will be the reference to refer later to the results. Here it is `Who do you want to vote for?`
With this style of poll, the first row is the first (most prefered) choice of candidate, the second row is the second choice, and so on.
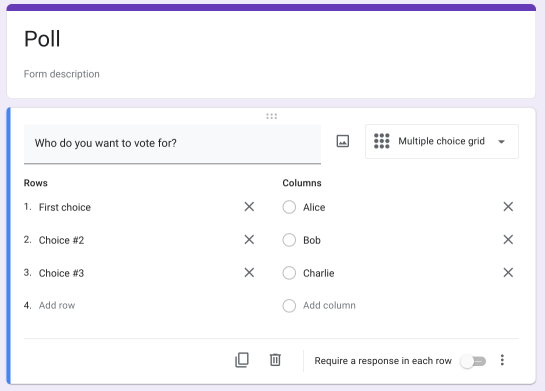
If you enable the option "Require a response in each row", the voters will be force to fill in all the ranks.
**Voting process** You can then share the voting form with all the voters, for instance using the "Share" button. It is possible to add other elements to the forms,
such as other votes, other polls, etc.
**Getting the results** After the poll is ended, all the results must be collected to the right format. In the `Responses` form,
use the `Create spreadsheet` option.
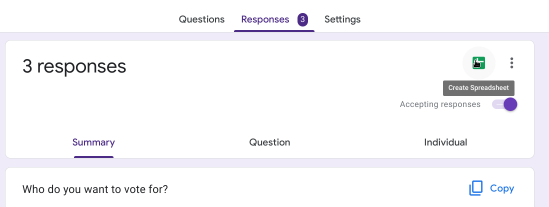
This will lead you to the online spreadsheet that should look like the following:
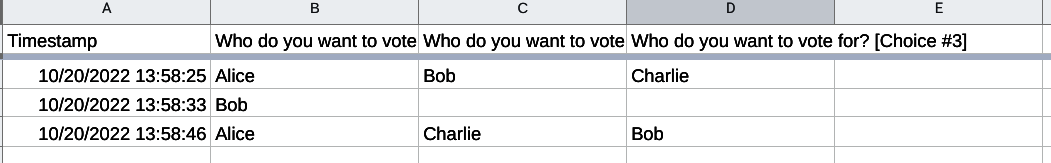
Download the spreadsheet on our computer in the **Excel format** (xlsx).
Run `timrcv` with the following command (the name of the file may differ for you).
```bash
timrcv -i 'test voting.xlsx' --input-type msforms_likert_transpose \
--choices "Who do you want to vote for? [First choice]" \
--choices "Who do you want to vote for? [Choice #2]" \
--choices "Who do you want to vote for? [Choice #3]"
```
The program needs to now which columns in the spreadsheet corresponds to choices. This is provided with the `--choices` flag. Each of the input is the name of
the column in the first row of the spreadsheet. The order of specifying the `--choices` flags is important. It will control which choice is the first then
the second then the third and so on.
After running this command, you should see the outcome of the election;
```text
[2022-10-21T09:55:59Z INFO ranked_voting] run_voting_stats: Processing 3 votes
[2022-10-21T09:55:59Z INFO ranked_voting] Processing 3 aggregated votes
[2022-10-21T09:55:59Z INFO ranked_voting] Candidate: 1: Alice
[2022-10-21T09:55:59Z INFO ranked_voting] Candidate: 2: Bob
[2022-10-21T09:55:59Z INFO ranked_voting] Candidate: 3: Charlie
[2022-10-21T09:55:59Z INFO ranked_voting] Round 1 (winning threshold: 2)
[2022-10-21T09:55:59Z INFO ranked_voting] 2 Alice -> elected
[2022-10-21T09:55:59Z INFO ranked_voting] 1 Bob -> eliminated:1 exhausted,
[2022-10-21T09:55:59Z INFO ranked_voting] 0 Charlie -> eliminated:
```
With these few example votes, `Alice` is declared the winner of this election
using the Instant-Runoff Voting scheme. Your results will vary depending on
the contents of the votes.
**Display the output** The output can also be displayed in an interactive form, for example using the [RCVis website](https://rcvis.com/).
`timrcv` can generate
a file in the JSON format that summarizes the election results in a format
compatible with RCVis. This is controled with the `--out` flag.
Going back to our example, we create an output summary:
```bash
timrcv -i 'test voting.xlsx' --input-type msforms_likert_transpose \
--choices "Who do you want to vote for? [First choice]" \
--choices "Who do you want to vote for? [Choice #2]" \
--choices "Who do you want to vote for? [Choice #3]"
--out my_election_results.json
```
Create an account or log into your account on the [RCVis website](https://rcvis.com)
Select "Upload election result". **Do not upload election results
to RCVis if the results are sensitive. The results on RCVis are publicly accessible**
You should obtain a visualization similar to this one:
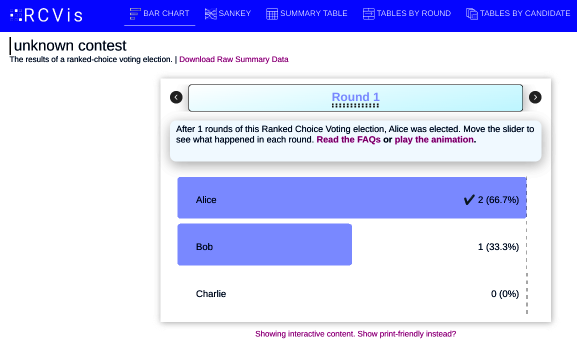
It is the end of this quick start. You can explore the following sections:
- if you are trying to recreate a specific election outcome from official tabulated data,
you should check the documentation of the `--config` flag. `timrcv` accepts many options in a
JSON format to control exactly how an election can be run. See the [configuration section](../manual/index.html#configuration).
- if your input is in a different format, check the input documentation page.
*/