
profile-bee
An eBPF-based CPU profiler for Linux, written in Rust. Single binary, no BCC/libbpf dependencies.
About
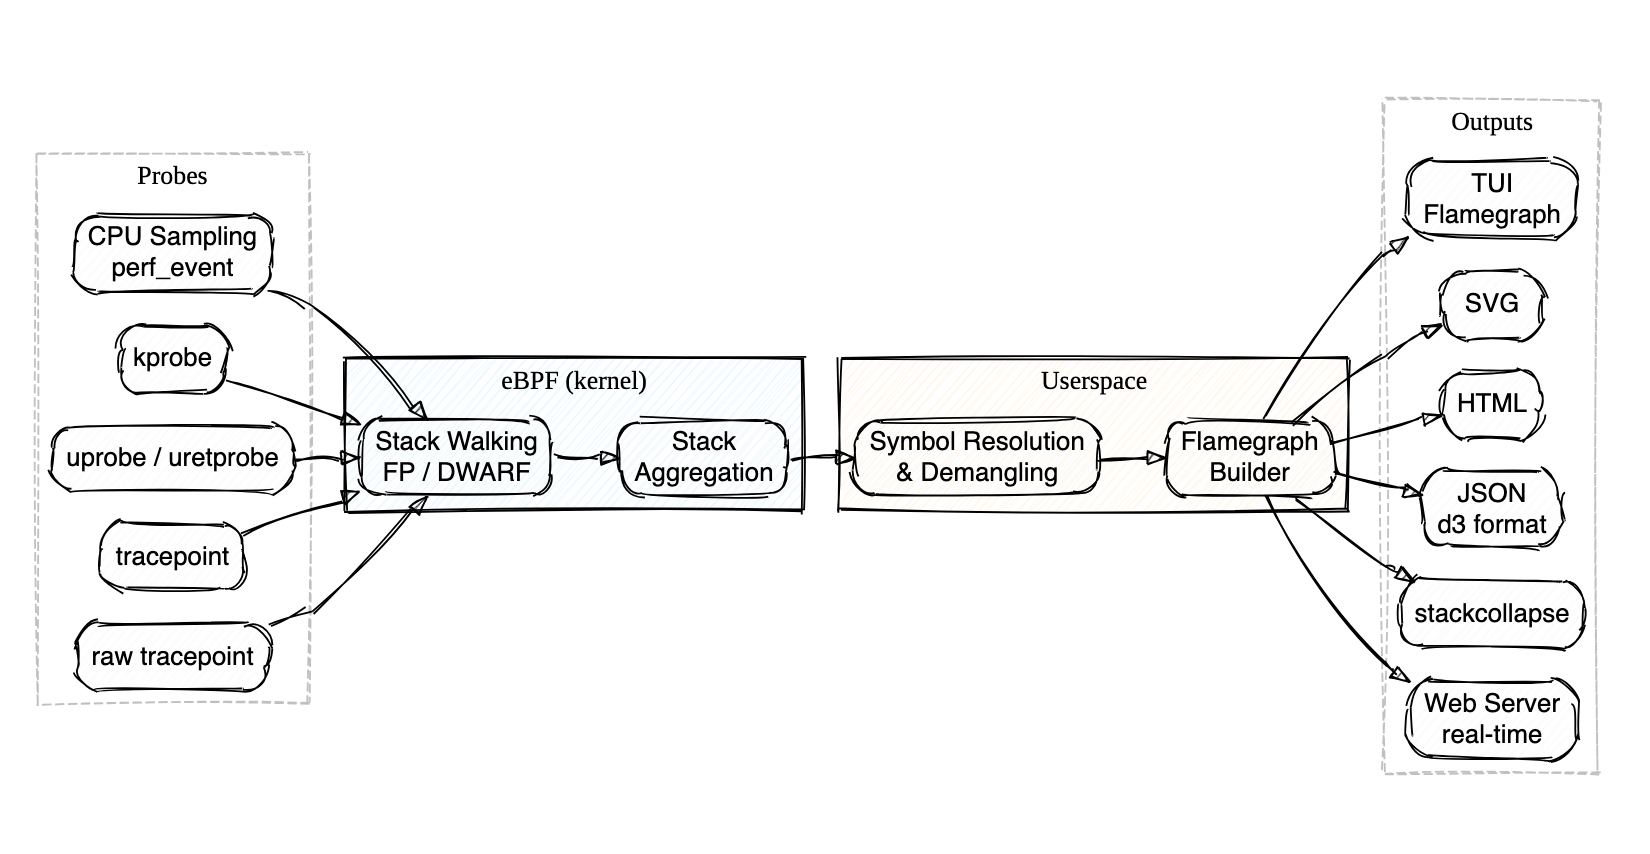
Profile Bee is an eBPF-based CPU profiler that ships as a single binary — no BCC, libbpf, or perf tooling needed on the target host. Built with Rust and aya.
- Just
cargo install,sudo probee --tui, and you're looking at a live flamegraph — no package manager dance, no Python dependencies, no separate visualization step - Walks stacks directly in the kernel via frame pointers (fast, the default) or DWARF unwind tables (for those
-O2binaries everyone ships without frame pointers) - Attaches to perf events, kprobes, uprobes, or tracepoints — auto-discovers uprobe targets with glob and regex matching
- Demangles Rust and C++ symbols out of the box
- Outputs to interactive TUI, SVG, HTML, JSON, stackcollapse, or a real-time web server — whatever fits your workflow
Install
Installs probee and pbee (short alias). No nightly Rust required — a prebuilt eBPF binary is bundled. Requires root to run (eBPF).
Quick Start
# Interactive TUI flamegraph (live, system-wide)
# Profile a specific command
# Generate an SVG flamegraph
# Profile a command with args
# Real-time flamegraphs via web server
# Trace function calls with uprobe
Run probee with no arguments or probee --help for the full list of options and examples.
Features
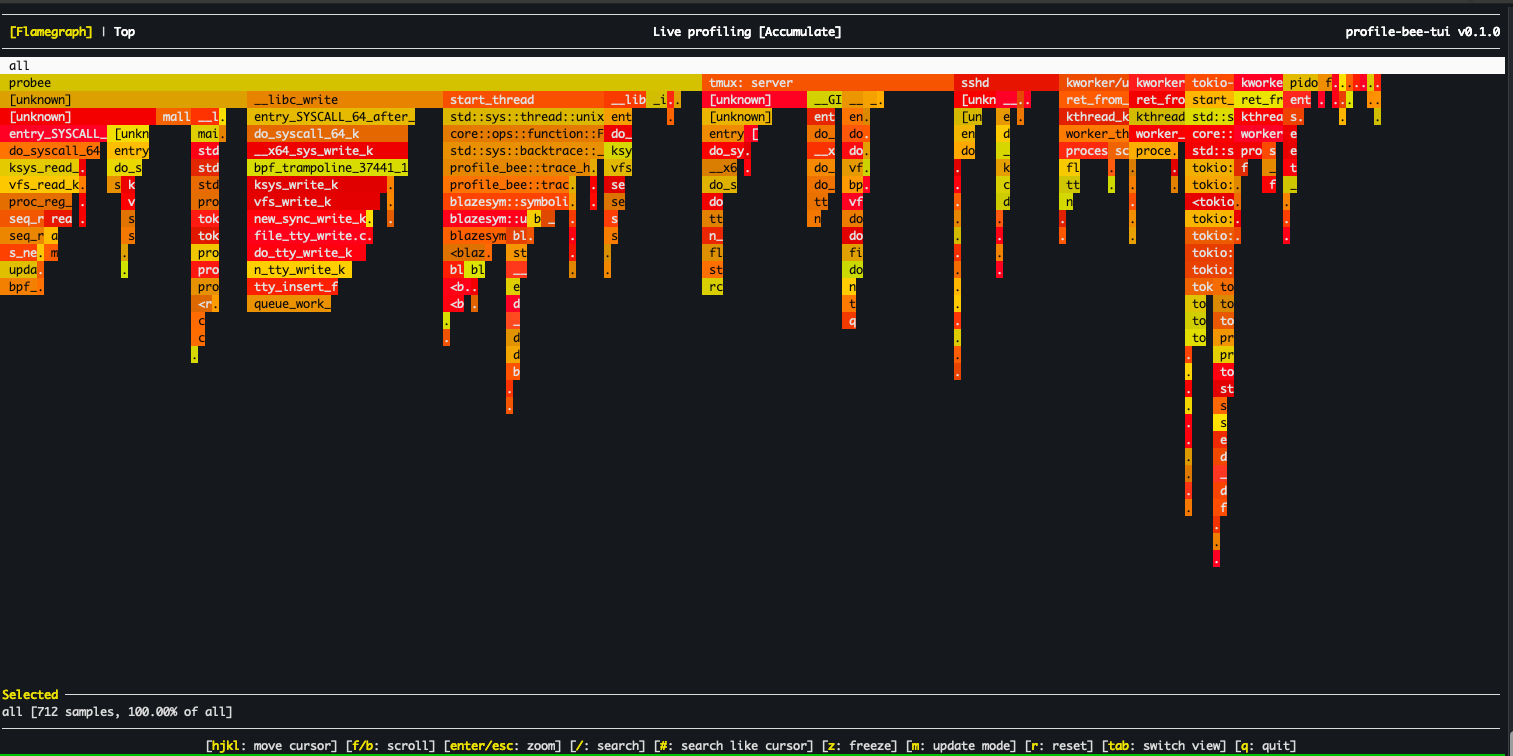
- Interactive TUI — real-time flamegraph viewer with vim-style navigation, search, and zoom
- Multiple output formats — SVG, HTML, JSON (d3), and stackcollapse format
- Frame pointer unwinding (default) — fast eBPF-based stack walking via
bpf_get_stackid - DWARF unwinding (
--dwarf) — profiles-O2/-O3binaries without frame pointers using.eh_frametables loaded into eBPF maps - Smart uprobes — GDB-style symbol resolution with glob, regex, demangled name matching, and multi-attach
- kprobe & tracepoint support — profile kernel functions and tracepoint events
- Real-time web server (
--serve) — live flamegraph updates over HTTP - Automatic termination — stops when
--pidtarget or--cmdprocess exits - Rust & C++ demangling — via gimli/blazesym
- BPF-based aggregation — stack counting in kernel to reduce userspace data transfer
- Group by CPU — per-core flamegraph breakdown
Detailed Usage
Output Formats
# SVG flamegraph
# HTML flamegraph
# Stackcollapse format (compatible with speedscope, flamegraph.pl)
# All output formats at once
# Grouped by CPU
Targeting
# Profile specific PID (auto-stops when process exits)
# Profile specific CPU core
# Profile a command
# Real-time flamegraphs via web server
# Then open http://localhost:8000/ and click "realtime-updates"
Kprobe & Tracepoint
# Profile kernel function calls
# Profile tracepoint events
Smart Uprobe Targeting
Profile-bee supports GDB-style symbol resolution for uprobes. Instead of manually specifying which library a function lives in, you provide a probe spec and the tool auto-discovers matching symbols across all loaded ELF binaries.
# Auto-discover library
# Multiple probes at once
# Glob matching — trace all pthread functions
# Regex matching
# Demangled C++/Rust name matching
# Source file and line number (requires DWARF debug info)
# Explicit library prefix
# Absolute path to binary
# Return probe (uretprobe)
# Function with offset
# Scope to a specific PID
# Discovery mode — list matching symbols without attaching
Probe spec syntax:
| Syntax | Example | Description |
|---|---|---|
function |
malloc |
Exact match, auto-discover library |
lib:function |
libc:malloc |
Explicit library name prefix |
/path:function |
/usr/lib/libc.so.6:malloc |
Absolute path prefix |
ret:function |
ret:malloc |
Return probe (uretprobe) |
function+offset |
malloc+0x10 |
Function with byte offset |
glob_pattern |
pthread_* |
Glob matching (*, ?, [...]) |
/regex/ |
/^sql_.*query/ |
Regex matching |
Namespace::func |
std::vector::push_back |
Demangled C++/Rust name match |
file.c:line |
main.c:42 |
Source location (requires DWARF) |
Resolution order:
- If
--pidor--uprobe-pidis set, scans/proc/<pid>/mapsfor all mapped executables - Otherwise, scans system libraries via
ldconfigcache and standard paths - For each candidate ELF, reads
.symtaband.dynsymsymbol tables - Demangled matching uses both Rust and C++ demanglers
- Source locations are resolved via gimli
.debug_lineparsing
Multi-attach: If a spec matches multiple symbols (e.g. pthread_* matching 20 functions), uprobes are attached to all of them.
TUI Mode
The interactive terminal flamegraph viewer is included by default (forked and adapted from flamelens).
# Interactive TUI with a command
# Live profiling of a running process
# With DWARF unwinding for optimized binaries
# Build without TUI support
Key Bindings:
| Key | Action |
|---|---|
hjkl / arrows |
Navigate cursor |
Enter |
Zoom into selected frame |
Esc |
Reset zoom |
/ |
Search frames with regex |
# |
Highlight selected frame |
n / N |
Next / previous match |
z |
Freeze / unfreeze live updates |
q or Ctrl+C |
Quit |
Stack Unwinding
Profile Bee supports two methods for stack unwinding. Both run the actual stack walking in eBPF (kernel space) for performance. Symbolization always happens in userspace.
Frame Pointer Method (default)
Uses the kernel's bpf_get_stackid to walk the frame pointer chain. Works out of the box for binaries compiled with frame pointers:
- Rust:
RUSTFLAGS="-Cforce-frame-pointers=yes" - C/C++:
-fno-omit-frame-pointerflag
DWARF Method (--dwarf)
Handles binaries compiled without frame pointers (the default for most -O2/-O3 builds). Use --dwarf to enable DWARF-based stack unwinding.
How it works:
- At startup, userspace parses
/proc/[pid]/mapsand.eh_framesections from each executable mapping - Pre-evaluates DWARF CFI rules into a flat
UnwindEntrytable (PC → CFA rule + RA rule) - Loads the table into eBPF maps before profiling begins
- At sample time, the eBPF program binary-searches the table and walks the stack using CFA computation +
bpf_probe_read_user - A background thread polls for newly loaded libraries (e.g. via
dlopen) and updates the unwind tables at runtime
This is the same approach used by parca-agent and other production eBPF profilers.
# Enable DWARF unwinding for a no-frame-pointer binary
# Frame pointer unwinding (the default)
Note: For symbol resolution, you still need debug information:
- Rust: Add
-gflag when compiling - C/C++: Compile with debug symbols (
-gflag)
Limitations: Max 16 executable mappings per process, 500K unwind table entries total, 32 frame depth. x86_64 only. Libraries loaded via dlopen are detected within ~1 second.
See docs/dwarf_unwinding_design.md for architecture details, and Polar Signals' article on profiling without frame pointers for background.
Limitations
- Linux only (requires eBPF support)
- DWARF unwinding: x86_64 only, see limits above
- Interpreted / JIT stack traces not yet supported
- VDSO
.eh_frameparsed for DWARF unwinding; VDSO symbolization not yet supported
Development
Prerequisites
- Install stable and nightly Rust:
rustup install stable nightly - Install bpf-linker:
cargo install bpf-linker
Build
# Build eBPF program (requires nightly)
# Build userspace (uses fresh eBPF build if available, otherwise prebuilt)
# Run
To perform a release build of the eBPF program, use cargo xtask build-ebpf --release. You may also change the target architecture with the --target flag.
More documentation in the docs directory.
Alternatives
- perf + Cargo flamegraph
- BCC profile
- parca-agent — always-on eBPF profiling in Go