# Multi-Allele Phasing
A single `PoaGraph` built from reads covering two haplotypes contains both alleles
simultaneously. The graph has **bubble** structures at every position where the haplotypes
differ. Multi-allele extraction recovers per-allele consensuses by partitioning reads into
haplotype groups before running the heaviest-path DP.
## Bubble detection
A node is **heterozygous** if it has two or more outgoing edges where each target edge
weight satisfies:
```
edge_weight >= ceil(n_reads * min_allele_freq)
```
`min_allele_freq` defaults to 0.25. With 20 reads, an arm must have at least 5 reads to
qualify. Arms below the threshold are treated as noise.
## Structural vs SNP bubbles
**Structural bubbles** are bubbles where at least one arm spans `phasing_bubble_min_span`
bases (default 10). A CAG×20 vs CAG×30 allele difference creates a 30-node arm (30 × 3 =
90 bp) that easily clears this threshold. An ONT substitution error at one position creates
a 1-node arm that does not.
**SNP bubbles** are single-node forks caused by substitution errors or true SNPs.
The phasing strategy uses structural bubbles preferentially because they are far less likely
to be noise. SNP bubble phasing is a fallback when no structural bubble is found.
## Structural phasing (union-find)
1. `find_structural_bubbles()` identifies all bubbles with at least one arm ≥
`phasing_bubble_min_span` bases.
2. For each structural bubble, reads are labelled with which arm they traversed (0 or 1).
3. Across all structural bubbles, reads that agree on arm choice at every shared bubble are
placed in the same haplotype group (union-find over pairwise compatibility).
4. Groups below `min_reads` depth are merged into the largest group.
This correctly separates CAG-length variants from error-induced SNP bubbles: the error
bubbles are single-node and below the structural span threshold, so they don't influence
the phasing.
## SNP fallback
If no structural bubble exists after the initial banded graph build, `consensus_multi`
rebuilds the graph **unbanded** and tries again. The banded aligner with w ≈ 13 cannot
handle a 90 bp diagonal drift (e.g. CAG×20 vs CAG×50 = 90 bp length difference); unbanded
creates the correct Insert-arm bubble, enabling structural phasing to succeed.
If the unbanded graph still has no structural bubble, the single strongest SNP bubble
(the one with the most-balanced arm support) is used to partition reads.
If there is no bubble at all, `consensus_multi` returns the single-allele consensus.
## Per-allele consensus
After partitioning, each group builds its own sub-graph with only that group's reads and
extracts an independent heaviest-path consensus. The sub-graph uses `min_cov` computed from
the **per-group** read count, not the total. With 20 reads split 10/10, `min_cov` is based
on 10, not 20.
`read_indices` in each returned `Consensus` records which original read indices contributed
to that allele, allowing the caller to assign per-read metadata (TSV rows, brick-plot lanes,
statistics) to the correct haplotype.
## Depth requirements
With `min_reads = 3` (the default), `consensus_multi` requires at least 3 reads **per
allele**. If a group falls below this after phasing, it is merged into the largest group and
the result is effectively single-allele.
For reliable two-allele calls, a minimum per-allele depth of 5-10 is recommended. At
depth 3, a single error read equals 33% frequency and can influence the minority-arm
detection.
## Example: two-allele SNV bubble graph
The graph below was built from 20 reads split evenly between two alleles with a SNV at
position 11. The spine (blue) follows allele A; the grey arm is allele B. A minor noise
arm (single read with a sequencing error) is also visible.

With one allele-B read overlaid (orange), you can see exactly which nodes it traverses
through the bubble and which nodes it shares with allele A:

## Example: repeat expansion alleles
For repeat loci, alleles differ in the number of repeat units rather than a single base.
Each allele is processed separately by `consensus_multi` after phasing. The two graphs
below compare normal and pathogenic CAG alleles (modelled at reduced scale for clarity;
real HTT expansions reach 36+ units for disease onset).
**Normal allele: (CAG)×4 = 12 bp**
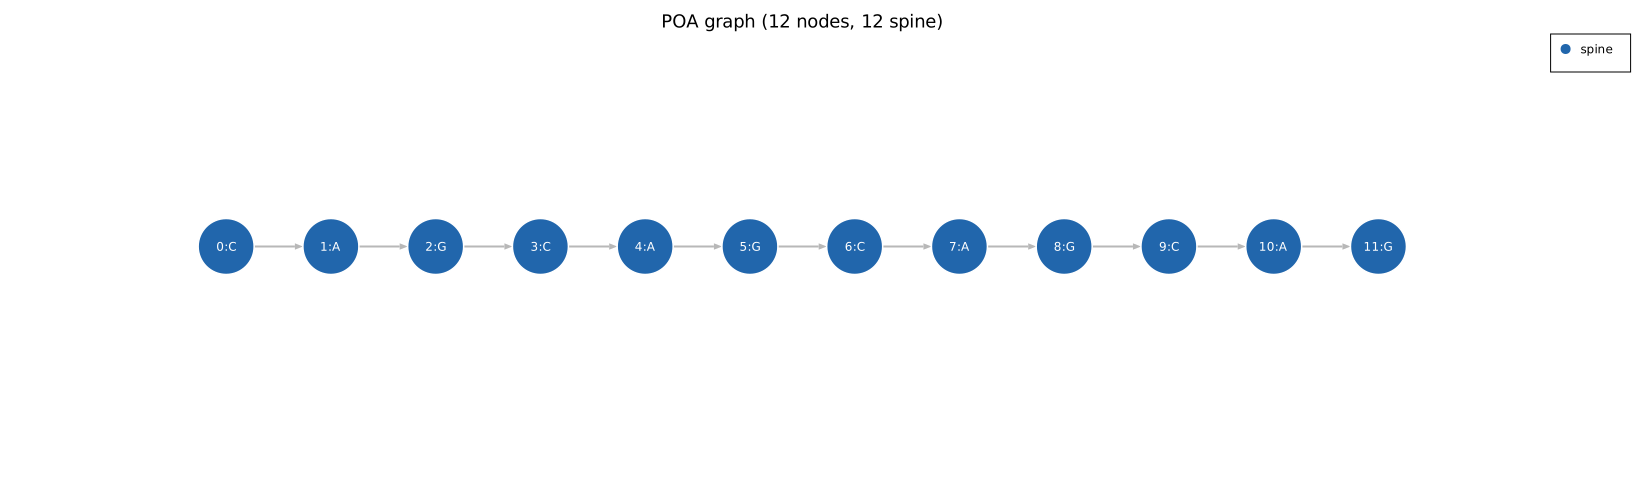
**Pathogenic allele: (CAG)×7 = 21 bp (+3 units)**

The same pattern applies to the GAA repeat (Friedreich's ataxia, FXN intron 1).
Disease range is >66 units; scaled to 4 vs 8 units here.
**Normal allele: (GAA)×4 = 12 bp**
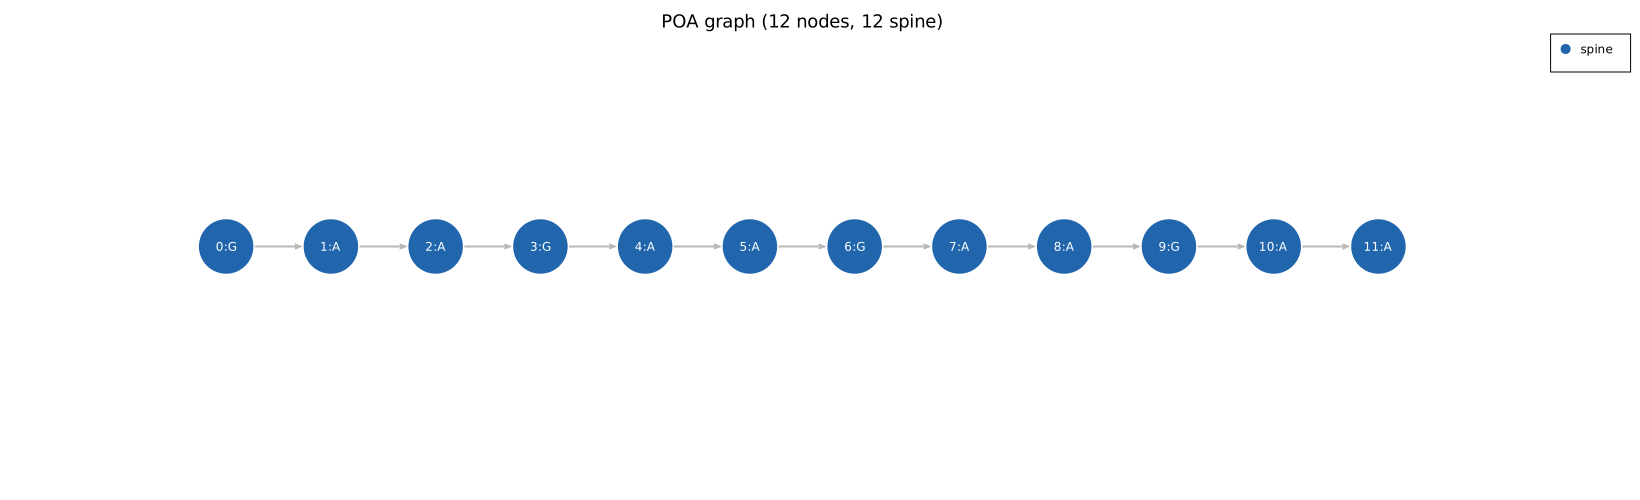
**Pathogenic allele: (GAA)×8 = 24 bp (+4 units)**

## Example: unphased RFC1-style mixed read set
The CANVAS locus (RFC1 intron 2) is a 5-mer repeat where the normal allele is (AAAAG)×N
and the most common pathogenic allele is (AAAGT)×N. The two motifs are 2 substitutions
apart per 5-mer -- not a length difference -- so the aligner prefers mismatches over
Insert/Delete pairs. The two motifs do not create bubble arms within the shared repeat
region. However, if the pathogenic allele is also expanded (more repeat units), the extra
units create Insert arm nodes that extend the spine.
The graph below was built from 15 reads of (AAAAG)×4 (75%, normal) and 5 reads of
(AAAGT)×6 (25%, pathogenic minority). The first 20 nodes come from the shared 4-unit region;
the last 10 nodes are the 2 extra AAAGT units that only the pathogenic reads carry. Node
sizes reflect coverage: the first 20 nodes are larger (depth 20) while the last 10 are
smaller (depth 5, below min_cov = 10). The heaviest path extends through the expansion
because each extra edge adds to the cumulative score. A single call to `consensus()` would
return the expanded allele length; `consensus_multi` with structural phasing is required to
recover both allele lengths correctly.
