mod test_utils;
use plotters::prelude::*;
use plotters_wxdragon::WxBackend;
use wxdragon::DeviceContext;
use test_utils::run_plotters_image_test;
#[test]
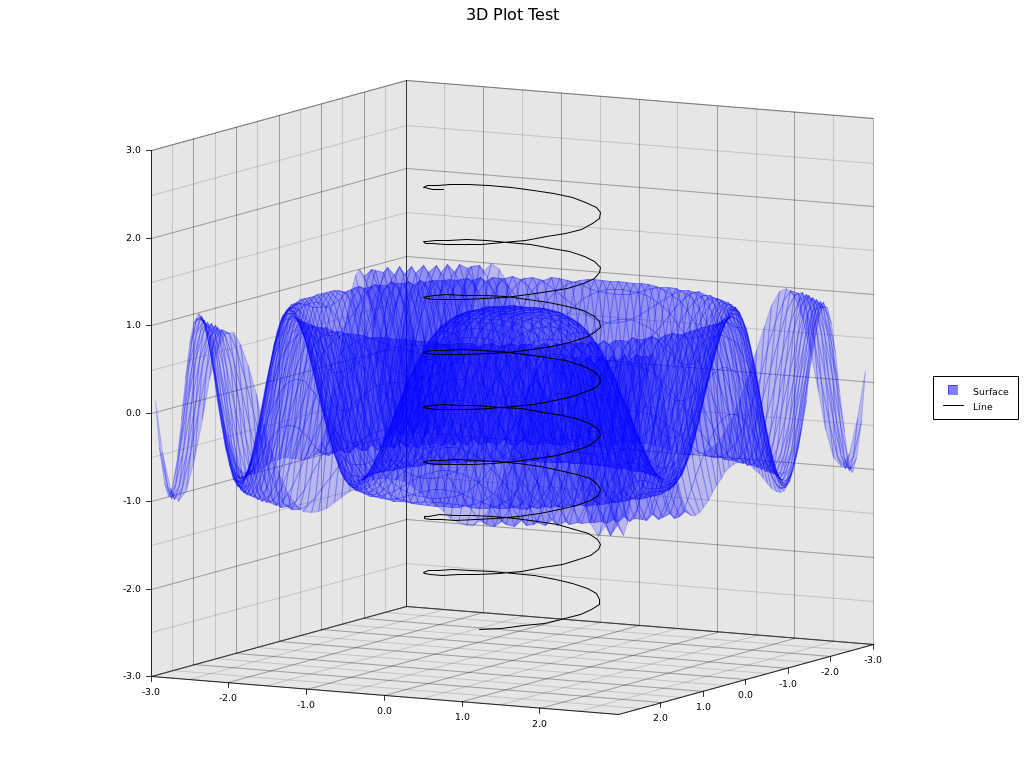
fn test_3d_plot() -> anyhow::Result<()> {
run_plotters_image_test(1024, 768, "tests/3d_plot", draw_3d_plot)
}
fn draw_3d_plot<C: DeviceContext>(backend: WxBackend<C>) -> anyhow::Result<()> {
let root_area = backend.into_drawing_area();
root_area.fill(&WHITE)?;
let x_axis = (-3.0..3.0).step(0.1);
let z_axis = (-3.0..3.0).step(0.1);
let mut chart = ChartBuilder::on(&root_area)
.caption("3D Plot Test", ("sans", 20))
.build_cartesian_3d(x_axis.clone(), -3.0..3.0, z_axis.clone())?;
chart.with_projection(|mut pb| {
pb.yaw = 0.5;
pb.scale = 0.9;
pb.into_matrix()
});
chart
.configure_axes()
.light_grid_style(BLACK.mix(0.15))
.max_light_lines(3)
.draw()?;
chart
.draw_series(
SurfaceSeries::xoz(
(-30..30).map(|f| f as f64 / 10.0),
(-30..30).map(|f| f as f64 / 10.0),
|x, z| (x * x + z * z).cos(),
)
.style(BLUE.mix(0.2).filled()),
)?
.label("Surface")
.legend(|(x, y)| {
Rectangle::new(
[(x + 5, y - 5), (x + 15, y + 5)],
BLUE.mix(0.5).filled(),
)
});
chart
.draw_series(LineSeries::new(
(-100..100)
.map(|y| y as f64 / 40.0)
.map(|y| ((y * 10.0).sin(), y, (y * 10.0).cos())),
&BLACK,
))?
.label("Line")
.legend(|(x, y)| PathElement::new(vec![(x, y), (x + 20, y)], BLACK));
chart.configure_series_labels().border_style(BLACK).draw()?;
root_area.present().expect("present");
Ok(())
}