# plotters-iced
[](https://github.com/joylei/plotters-iced/actions?query=workflow%3A%22Test+and+Build%22)
[](https://docs.rs/plotters-iced)
[](https://crates.io/crates/plotters-iced)
[](https://github.com/joylei/plotters-iced/blob/master/LICENSE)
This is an implementation of an Iced backend for Plotters, for both native ~~and wasm applications(not working for v0.3)~~.
This backend has been optimized as for speed. Note that some specific plotting features supported in the Bitmap backend may not be implemented there, though.
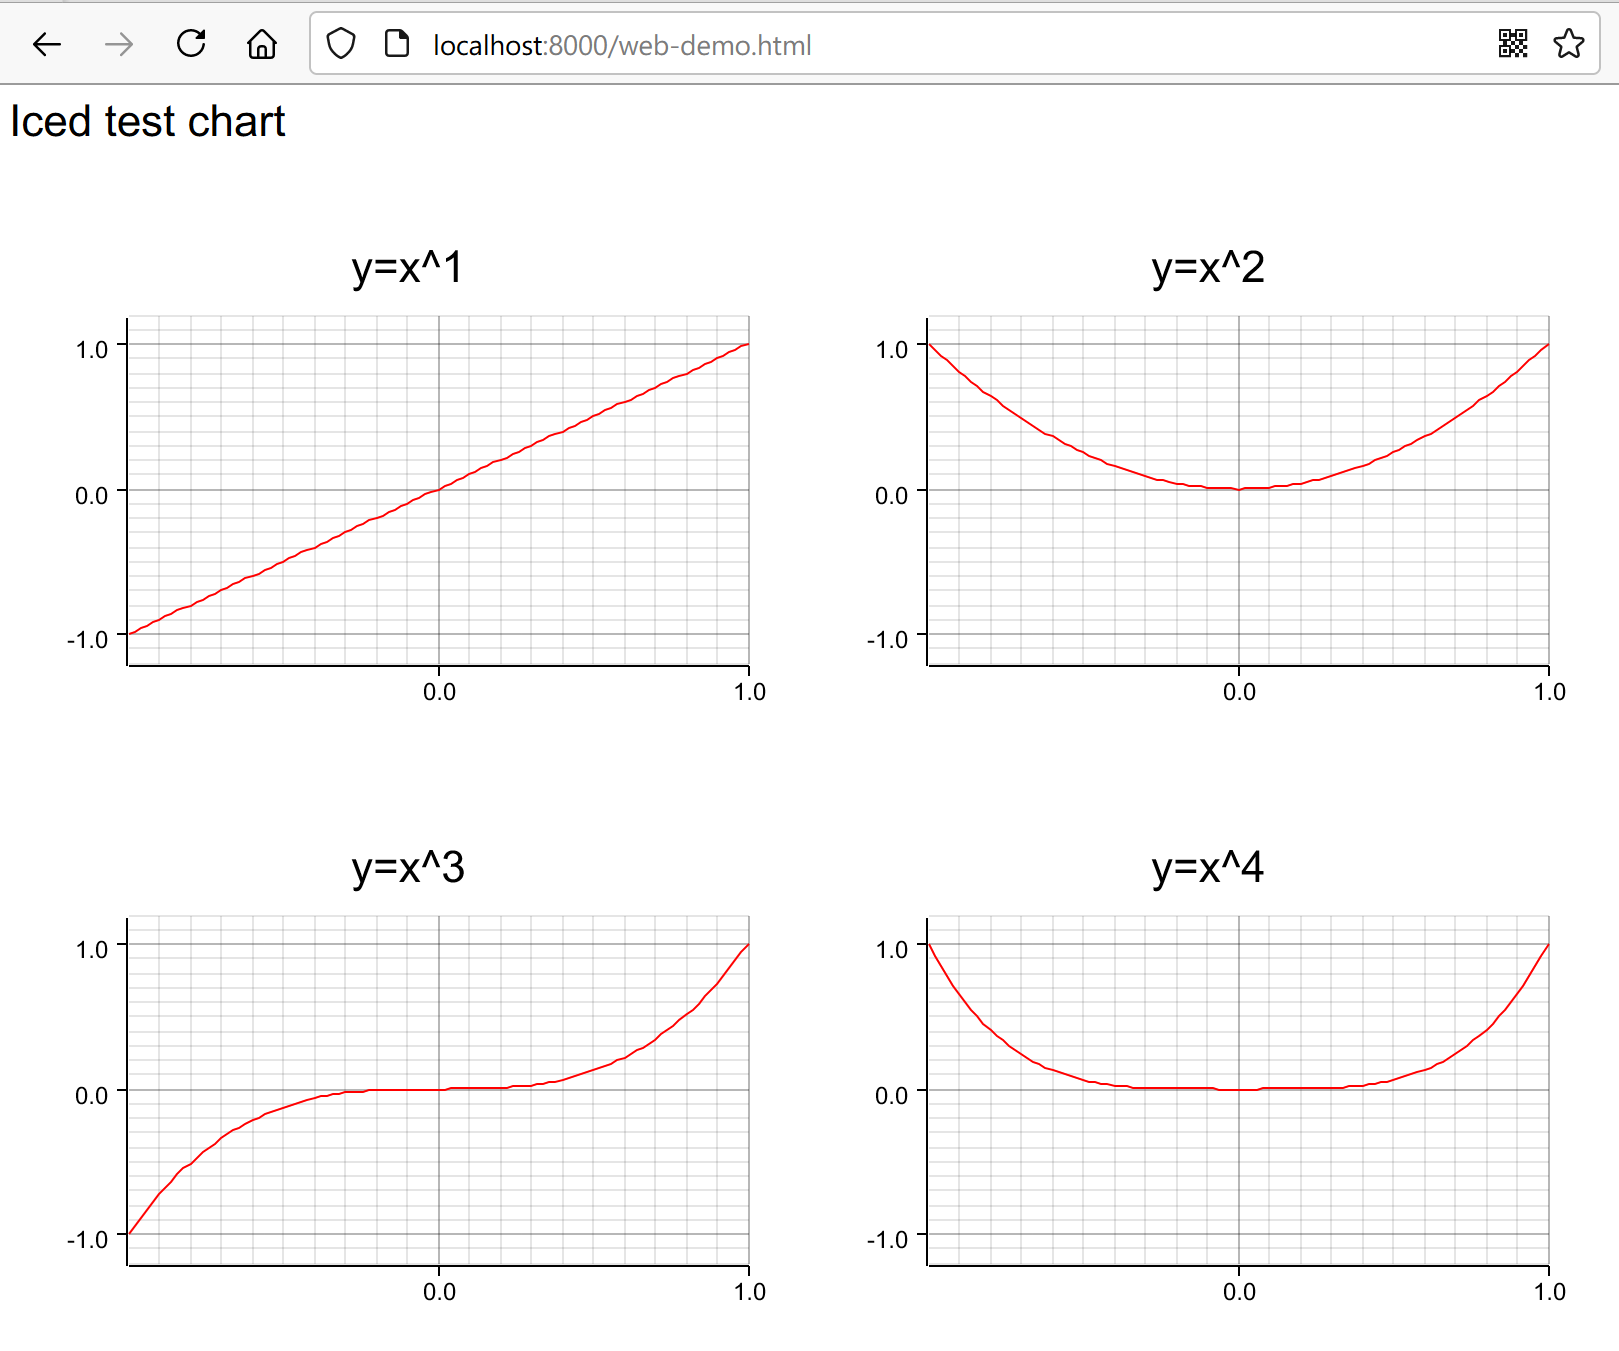
## Showcase

## What is Plotters?
Plotters is an extensible Rust drawing library that can be used to plot data on nice-looking graphs, rendering them through a plotting backend (eg. to a Bitmap image raw buffer, to your GUI backend, to an SVG file, etc.).
**For more details on Plotters, please check the following links:**
- For an introduction of Plotters, see: [Plotters on Crates.io](https://crates.io/crates/plotters);
- Check the main repository on [GitHub](https://github.com/38/plotters);
- You can also visit the Plotters [homepage](https://plotters-rs.github.io/);
## How to install?
Include `plotters-iced` in your `Cargo.toml` dependencies:
```toml
[dependencies]
plotters-iced = "0.3"
iced = { version = "0.4", features = ["canvas", "tokio"] }
plotters="0.3"
```
## How to use?
First, import `Chart` and `ChartWidget`:
```rust
use plotters_iced::{Chart, ChartWidget, DrawingBackend, ChartBuilder};
```
Then, derive `Chart` trait and build your chart, and let `plotters-iced` takes care the rest:
```rust
struct MyChart;
impl Chart<Message> for MyChart {
fn build_chart<DB:DrawingBackend>(&self, builder: ChartBuilder<DB>) {
//build your chart here, please refer to plotters for more details
}
}
```
Finally, render your chart view:
```rust
impl MyChart {
fn view(&mut self)->Element<Message> {
ChartWidget::new(self)
.width(Length::Unit(200))
.height(Length::Unit(200))
.into()
}
}
```
_If you are looking for a full example of an implementation, please check [cpu-monitor.rs](./examples/cpu-monitor.rs)._
## How to run the examples?
### Example #1: `cpu-monitor`
This example samples your CPU load every second, and renders it in a real-time chart:
```sh
cargo run --release --example cpu-monitor
```
From this example, you'll learn:
- how to build charts by `plotters-iced`
- how to feed data to charts
- how to make layouts of charts responsive
- how to use fonts with charts
### Example #2: `split-chart`
This example shows you how to split drawing area.
- run the native version
```sh
cargo run --release --example split-chart
```
## Are there any limitations?
### Limitation #1: No image rendering
No image rendering for native and wasm applications.
### Limitation #2: Limited text rendering for native applications
Only TTF font family are supported for text rendering, which is a limitation of `Iced`, please look at [cpu-monitor.rs](./examples/cpu-monitor.rs). As well, font transforms are not supported,which is also a limitation of `Iced`.
## Credits
- [plotters-conrod](https://github.com/valeriansaliou/plotters-conrod)