# Changelog
## Unreleased
## 0.5.1 - 2020-03-28
### Fixed
- Set default axis bounds for case where all values are equal (Issue #36)
- Optimise tick generation to jump straight to range (Issue #42)
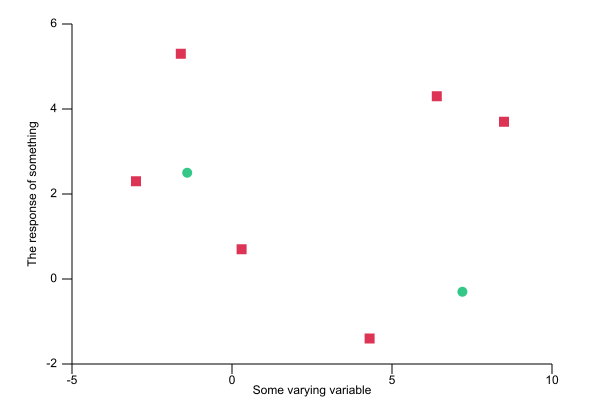
- Fix text rendering of scatter plots
## 0.5.0 - 2020-03-14
### Added
- Legends for line plots
### Changed
- Remove style traits and replace all style structs with 3 common ones in `style`
- Group all representations under a `repr` module.
- Add `linejoin` option to line style.
- More Box and less & in the interface
- Replace Line, Scatter and Function with Plot
## 0.4.0 - 2019-03-02
### Added
- Line charts.
- Box plots.
- Bar charts.
- Introduce categorical representation, views and axes.
- Add ability to set dimensions of plot (PR #8)
- Added ability to display a histogram as densities
- Add ability to display grids (PR #23)
### Changed
- Change `create_axes`, `save`, `to_svg` and `to_text` to return `Result` indicating an error.
- Make `representation` module public.
- Rename `Scatter::from_vec` to `Scatter::from_slice`.
- Rename `Histogram::from_vec` to `Histogram::from_slice`.
- Rename `view::View` to `view::ContinuousView` and introduce `view::View` as a trait.
- Change `svg_render` functions to take data slices rather than Representations.
- `Histogram::from_slice` now takes either a bin count or a bin bound list as its second argument.
## 0.3.0 - 2018-03-01
### Added
- Axis labels
- Function plotting
- Histogram styling
### Changed
- Rename `plot::Plot` to `page::Page`
- Move `scatter::Marker` to `style::Marker`
## 0.2.0 - 2017-03-16
### Added
- SVG rendering
### Changed
- Reorganise things to use traits for plot types
## 0.1.0 - 2017-03-09
### Added
- Initial release with histograms and scatter plots