# Picolo
Image-reading crate for plotting data and transposing image contents into a data structure with the precision decided by the user.
# Implementations
```rust
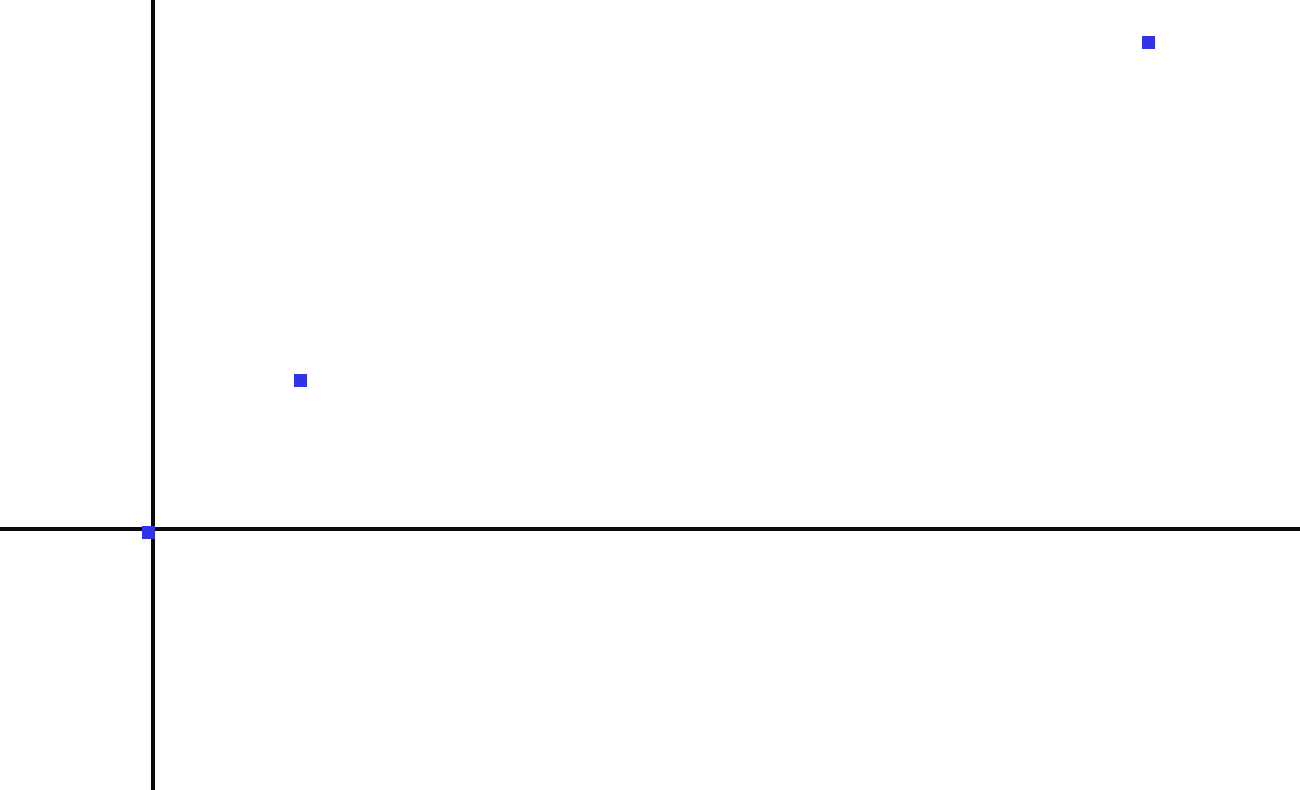
// Plotting a 2d Vector
// @Params: x: &u32, y: &u32
use picolo::plot::plot;
fn main() {
let x = vec![0, 152, 1000];
let y = vec![0, 152, 490];
plot(&x, &y);
}
```
# Setting up
```rust
// Easiest way to print half the contents
let pixl_struct = load_picture("images/icon.png", 2);
for i in pixl_struct {
println!("{:?}", i);
}
// Accessing all fields:
// @Params: &path as &str, precision as u32 (1 = 100% precision, 2 = 50% ...)
let foo = "images/icon.png";
let bar_str = &foo;
let precision = 1;
let pixl_struct = picolo::load_picture(bar_str, precision);
// Print all the contents derived from image
for i in pixl_struct {
println!("x {} y {} red {} green {} blue: {}", i[0].x, i[0].y,
i[0].color.red, i[0].color.green, i[0].color.blue);
}
```
#TODO:
* Implement shrinking if dataset is too big (Idea: check the biggest number in a list, check if bigger than bounds, and divide by the difference of list surpassing the bounds eg: if bounds = 1000 and an element in list is 1100 then divide by 10%)
*Convert to uf32 functionality (Floats are just easier to work with)
* Add option to draw circles if preferred
* Add coloring variation if dataset become too large for the plot
* Add line drawing
* Add function to open image after the plot has been drawn so the user doesn't have to
* Refactor current way of finding origin with exact positions