# Stack Trace Library
## Introduction
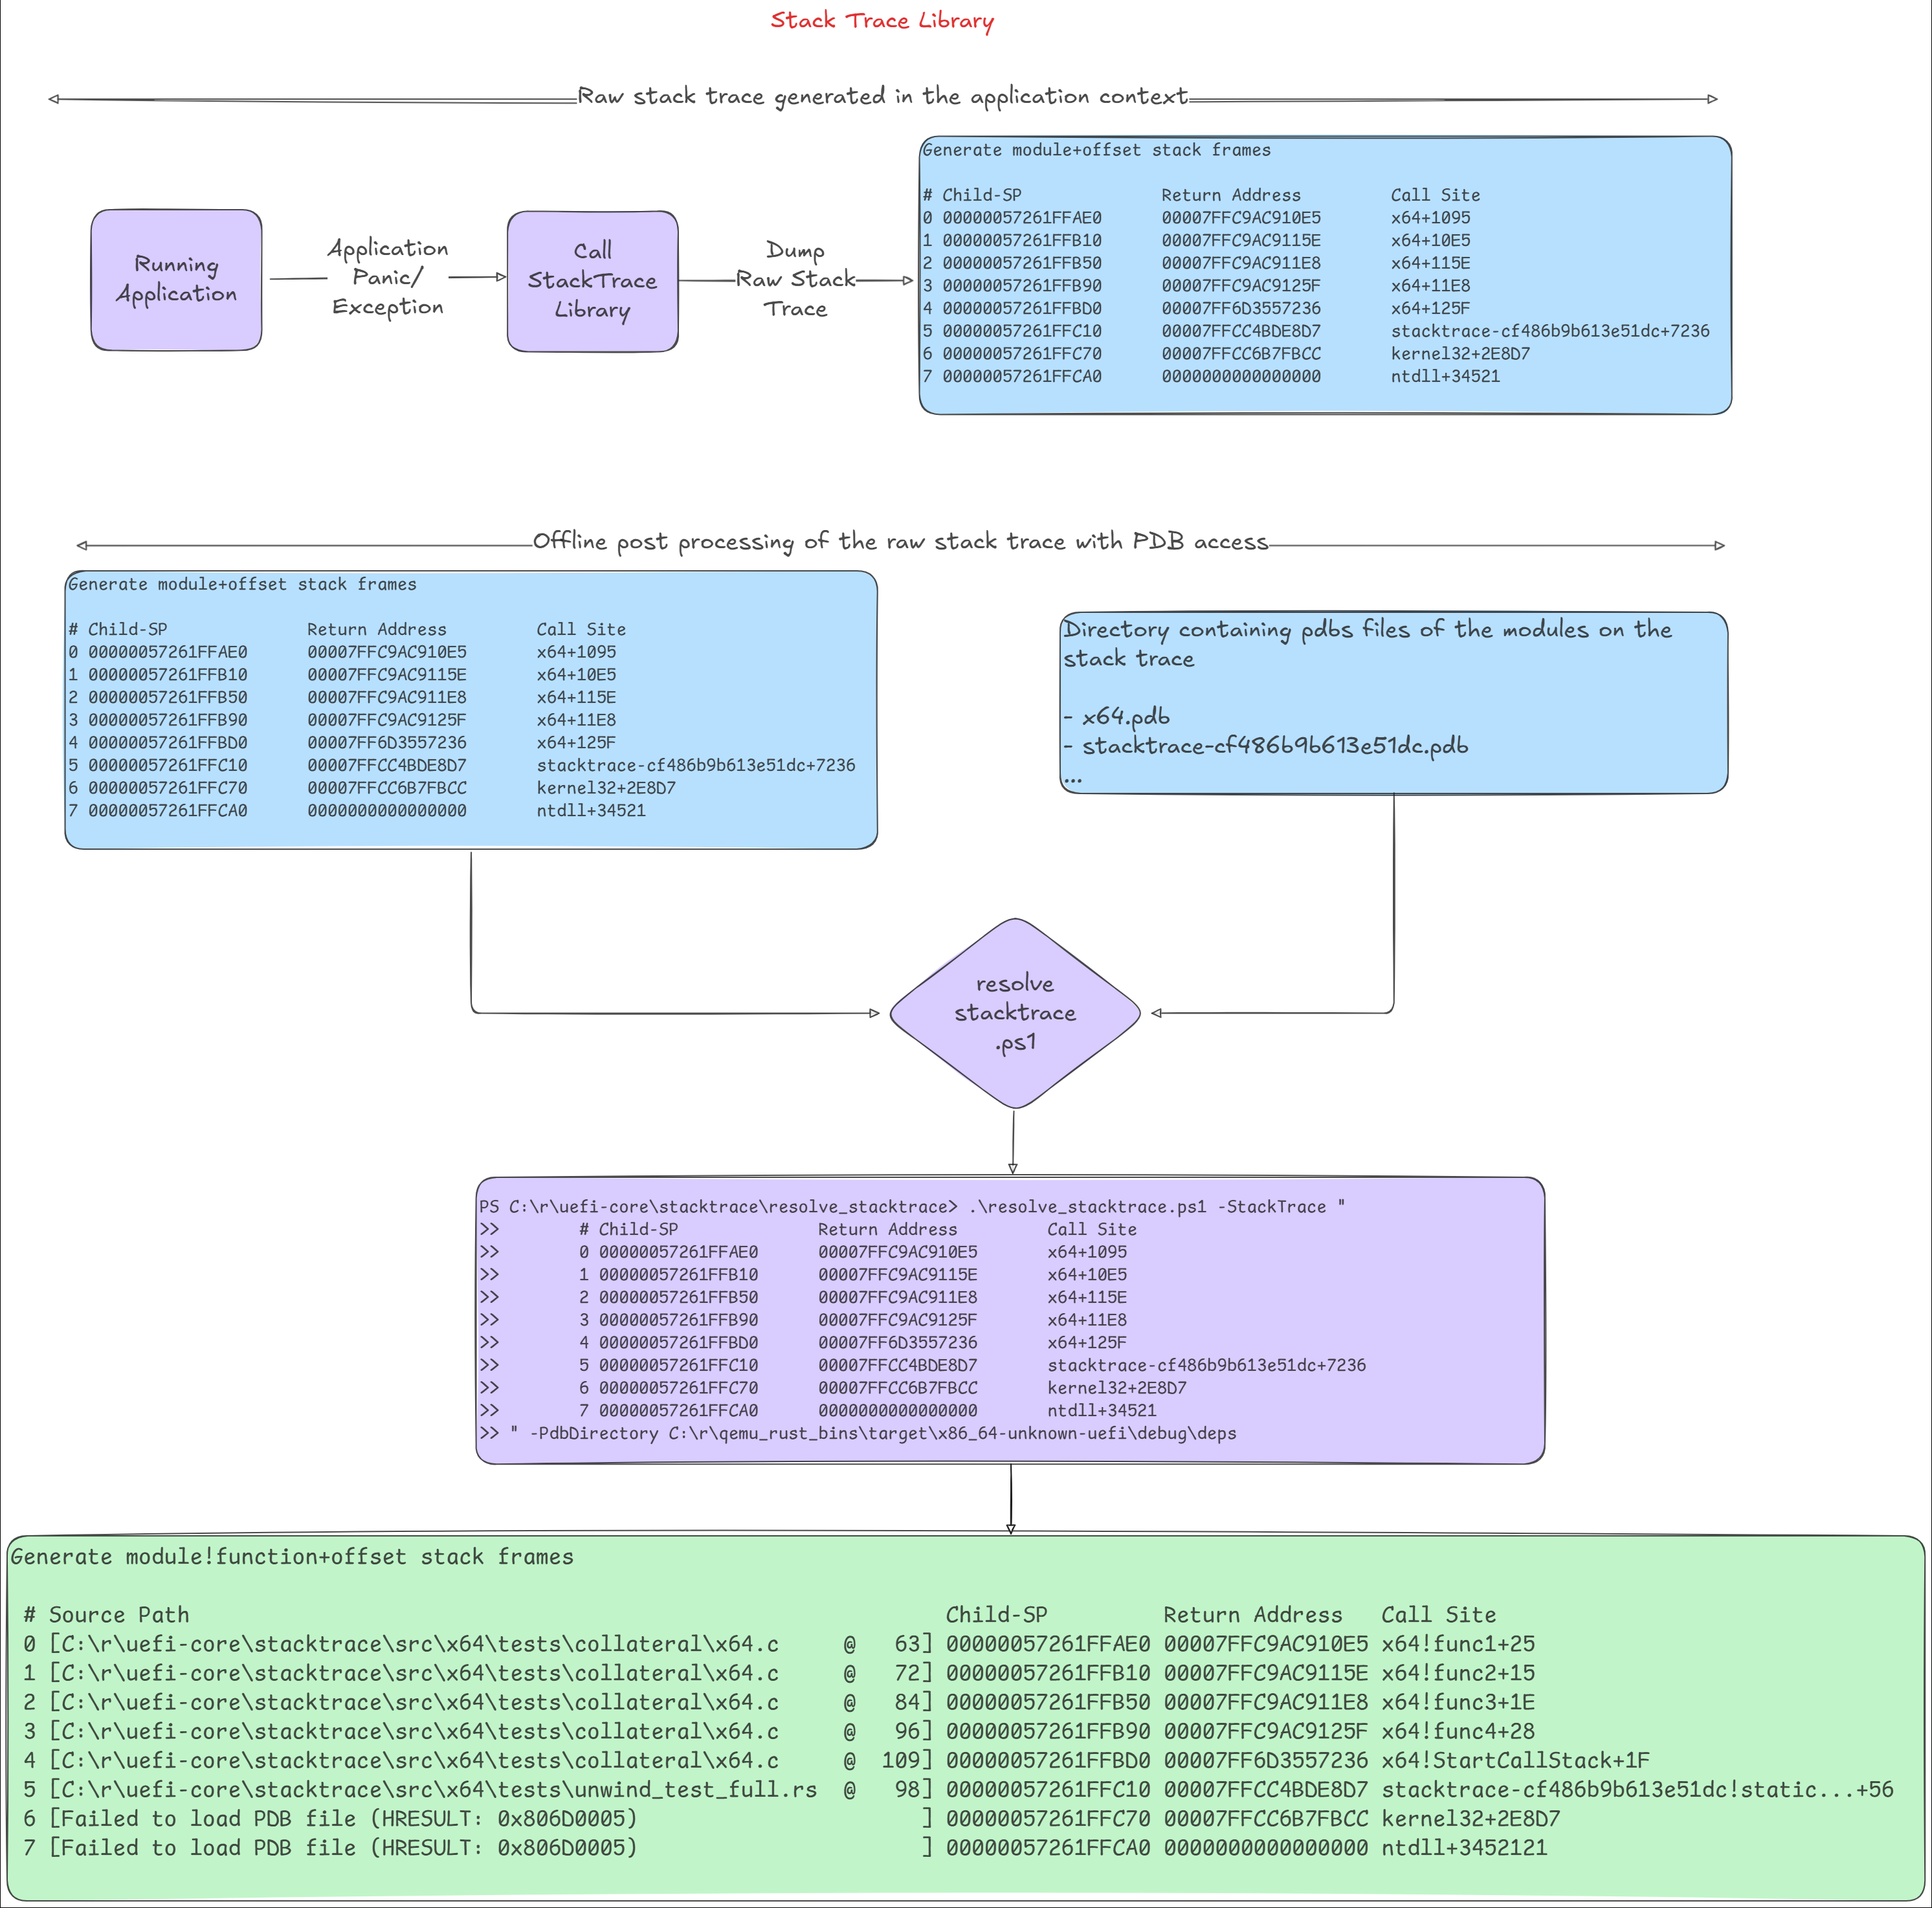
This library implements the stack walking logic. Given the instruction pointer
and stack pointer, the [API](#public-api) will dump the stack trace leading to
that machine state. It currently does not resolve symbols, as PDB debug info is
not embedded in the PE image, unlike the DWARF format for ELF images. Therefore,
symbol resolution must be done offline. As a result, the "Call Site" column in
the output will display `module+<relative rip>` instead of
`module!function+<relative rip>`. Outside of this library, with PDB access,
these module-relative RIP offsets can be resolved to function-relative offsets,
as shown below.
```cmd
PS C:\> .\resolve_stacktrace.ps1 -StackTrace "
>> # Child-SP Return Address Call Site
>> 0 00000057261FFAE0 00007FFC9AC910E5 x64+1095
>> 1 00000057261FFB10 00007FFC9AC9115E x64+10E5
>> 2 00000057261FFB50 00007FFC9AC911E8 x64+115E
>> 3 00000057261FFB90 00007FFC9AC9125F x64+11E8
>> 4 00000057261FFBD0 00007FF6D3557236 x64+125F
>> 5 00000057261FFC10 00007FFCC4BDE8D7 patina_stacktrace-cf486b9b613e51dc+7236
>> 6 00000057261FFC70 00007FFCC6B7FBCC kernel32+2E8D7
>> 7 00000057261FFCA0 0000000000000000 ntdll+34521
>>
>> " -PdbDirectory "C:\pdbs\"
Output:
# Source Path Child-SP Return Address Call Site
0 [C:\r\patina\core\patina_stacktrace\src\x64\tests\collateral\x64.c @ 63] 00000057261FFAE0 00007FFC9AC910E5 x64!func1+25
1 [C:\r\patina\core\patina_stacktrace\src\x64\tests\collateral\x64.c @ 72] 00000057261FFB10 00007FFC9AC9115E x64!func2+15
2 [C:\r\patina\core\patina_stacktrace\src\x64\tests\collateral\x64.c @ 84] 00000057261FFB50 00007FFC9AC911E8 x64!func3+1E
3 [C:\r\patina\core\patina_stacktrace\src\x64\tests\collateral\x64.c @ 96] 00000057261FFB90 00007FFC9AC9125F x64!func4+28
4 [C:\r\patina\core\patina_stacktrace\src\x64\tests\collateral\x64.c @ 109] 00000057261FFBD0 00007FF6D3557236 x64!StartCallStack+1F
5 [C:\r\patina\core\patina_stacktrace\src\x64\tests\unwind_test_full.rs @ 98] 00000057261FFC10 00007FFCC4BDE8D7 patina_stacktrace-cf486b9b613e51dc!static unsigned int patina_stacktrace::x64::tests::unwind_test_full::call_stack_thread(union enum2$<winapi::ctypes::c_void> *)+56
6 [Failed to load PDB file (HRESULT: 0x806D0005) ] 00000057261FFC70 00007FFCC6B7FBCC kernel32+2E8D7
7 [Failed to load PDB file (HRESULT: 0x806D0005) ] 00000057261FFCA0 0000000000000000 ntdll+34521
```
The input may contain additional whitespace before each frame line, a timestamp in the format shown, or a log prefix
level. Those will be ignored.
## Allowed Examples
Each of these examples will produce the same output:
```cmd
.\resolve_stacktrace\resolve_stacktrace.ps1 -StackTrace "
> 13:39:09.014 : INFO - # Child-SP Return Address Call Site
> 13:39:09.014 : INFO - 0 000000007E96F930 000000007E982668 qemu_q35_dxe_core-2d9bed3cc1f2b4ea+6E1BF
> 13:39:09.014 : INFO - 1 000000007E96F960 000000007EA8B92F qemu_q35_dxe_core-2d9bed3cc1f2b4ea+12668
> 13:39:09.014 : INFO - 2 000000007E96FA70 000000007E9739E0 qemu_q35_dxe_core-2d9bed3cc1f2b4ea+11B92F
> 13:39:09.014 : INFO - 3 000000007E96FAB0 000000007E98301D qemu_q35_dxe_core-2d9bed3cc1f2b4ea+39E0
> 13:39:09.014 : INFO - 4 000000007E96FC00 000000007EBE62F4 qemu_q35_dxe_core-2d9bed3cc1f2b4ea+1301D
>
> " -PdbDirectory C:\src\patina-dxe-core-qemu\target\x86_64-unknown-uefi\debug\deps
```
```cmd
.\resolve_stacktrace\resolve_stacktrace.ps1 -StackTrace "
> INFO - # Child-SP Return Address Call Site
> INFO - 0 000000007E96F930 000000007E982668 qemu_q35_dxe_core-2d9bed3cc1f2b4ea+6E1BF
> INFO - 1 000000007E96F960 000000007EA8B92F qemu_q35_dxe_core-2d9bed3cc1f2b4ea+12668
> INFO - 2 000000007E96FA70 000000007E9739E0 qemu_q35_dxe_core-2d9bed3cc1f2b4ea+11B92F
> INFO - 3 000000007E96FAB0 000000007E98301D qemu_q35_dxe_core-2d9bed3cc1f2b4ea+39E0
> INFO - 4 000000007E96FC00 000000007EBE62F4 qemu_q35_dxe_core-2d9bed3cc1f2b4ea+1301D
>
> " -PdbDirectory C:\src\patina-dxe-core-qemu\target\x86_64-unknown-uefi\debug\deps
```
```cmd
.\resolve_stacktrace\resolve_stacktrace.ps1 -StackTrace "
> # Child-SP Return Address Call Site
> 0 000000007E96F930 000000007E982668 qemu_q35_dxe_core-2d9bed3cc1f2b4ea+6E1BF
> 1 000000007E96F960 000000007EA8B92F qemu_q35_dxe_core-2d9bed3cc1f2b4ea+12668
> 2 000000007E96FA70 000000007E9739E0 qemu_q35_dxe_core-2d9bed3cc1f2b4ea+11B92F
> 3 000000007E96FAB0 000000007E98301D qemu_q35_dxe_core-2d9bed3cc1f2b4ea+39E0
> 4 000000007E96FC00 000000007EBE62F4 qemu_q35_dxe_core-2d9bed3cc1f2b4ea+1301D
>
> " -PdbDirectory C:\src\patina-dxe-core-qemu\target\x86_64-unknown-uefi\debug\deps
```
## Prerequisites
This library uses the PE image `.pdata` section to calculate the stack unwind
information required to walk the call stack. Therefore, all binaries should be
compiled with the following `rustc` flag to generate the `.pdata` section in the
PE images:
`RUSTFLAGS=-Cforce-unwind-tables`
In order to preserve stack data about C binaries, this needs to be set in the platform DSC's build options section:
`*_*_*_GENFW_FLAGS = --keepexceptiontable`
## Supported Platforms
- Hardware
- X64
- AArch64
- File Formats
- PE32+
- Environments
- UEFI
- Windows
## Public API
The main API for public use is the `dump()` function in the `StackTrace` module.
```rust
/// Dumps the stack trace for the given RIP and RSP values.
///
/// # Safety
///
/// This function is marked `unsafe` to indicate that the caller is
/// responsible for validating the provided RIP and RSP values. Invalid
/// values can result in undefined behavior, including potential page
/// faults.
///
/// ```text
/// # Child-SP Return Address Call Site
/// 0 000000346BCFFAC0 00007FF8A0A710E5 x64+1095
/// 1 000000346BCFFAF0 00007FF8A0A7115E x64+10E5
/// 2 000000346BCFFB30 00007FF8A0A711E8 x64+115E
/// 3 000000346BCFFB70 00007FF8A0A7125F x64+11E8
/// 4 000000346BCFFBB0 00007FF6801B0EF8 x64+125F
/// 5 000000346BCFFBF0 00007FF8A548E8D7 patina_stacktrace-326fa000ab73904b+10EF8
/// 6 000000346BCFFC60 00007FF8A749FBCC kernel32+2E8D7
/// 7 000000346BCFFC90 0000000000000000 ntdll+2FBCC
/// ```
pub unsafe fn dump(rip: u64, rsp: u64) -> StResult<()>;
/// Dumps the stack trace. This function reads the RIP and RSP registers and
/// attempts to dump the call stack.
///
/// # Safety
///
/// It is marked `unsafe` to indicate that the caller is responsible for the
/// validity of the RIP and RSP values. Invalid or corrupt machine state can
/// result in undefined behavior, including potential page faults.
///
/// ```text
/// # Child-SP Return Address Call Site
/// 0 000000346BCFFAC0 00007FF8A0A710E5 x64+1095
/// 1 000000346BCFFAF0 00007FF8A0A7115E x64+10E5
/// 2 000000346BCFFB30 00007FF8A0A711E8 x64+115E
/// 3 000000346BCFFB70 00007FF8A0A7125F x64+11E8
/// 4 000000346BCFFBB0 00007FF6801B0EF8 x64+125F
/// 5 000000346BCFFBF0 00007FF8A548E8D7 patina_stacktrace-326fa000ab73904b+10EF8
/// 6 000000346BCFFC60 00007FF8A749FBCC kernel32+2E8D7
/// 7 000000346BCFFC90 0000000000000000 ntdll+2FBCC
/// ```
pub unsafe fn dump() -> StResult<()>;
```
## API usage
```rust
// Inside exception handler
StackTrace::dump_with(rip, rsp);
// Inside rust panic handler and drivers
StackTrace::dump();
```
## Reference
More reference test cases are in `src\x64\tests\*.rs`