
p99gate
p99gate is an HTTP load tester for CI: it measures latency without hiding stalls, and fails the build when a threshold such as p99>300ms is crossed.
Prebuilt binaries for Linux (static), macOS and Windows are attached to every GitHub Release.
What a run looks like
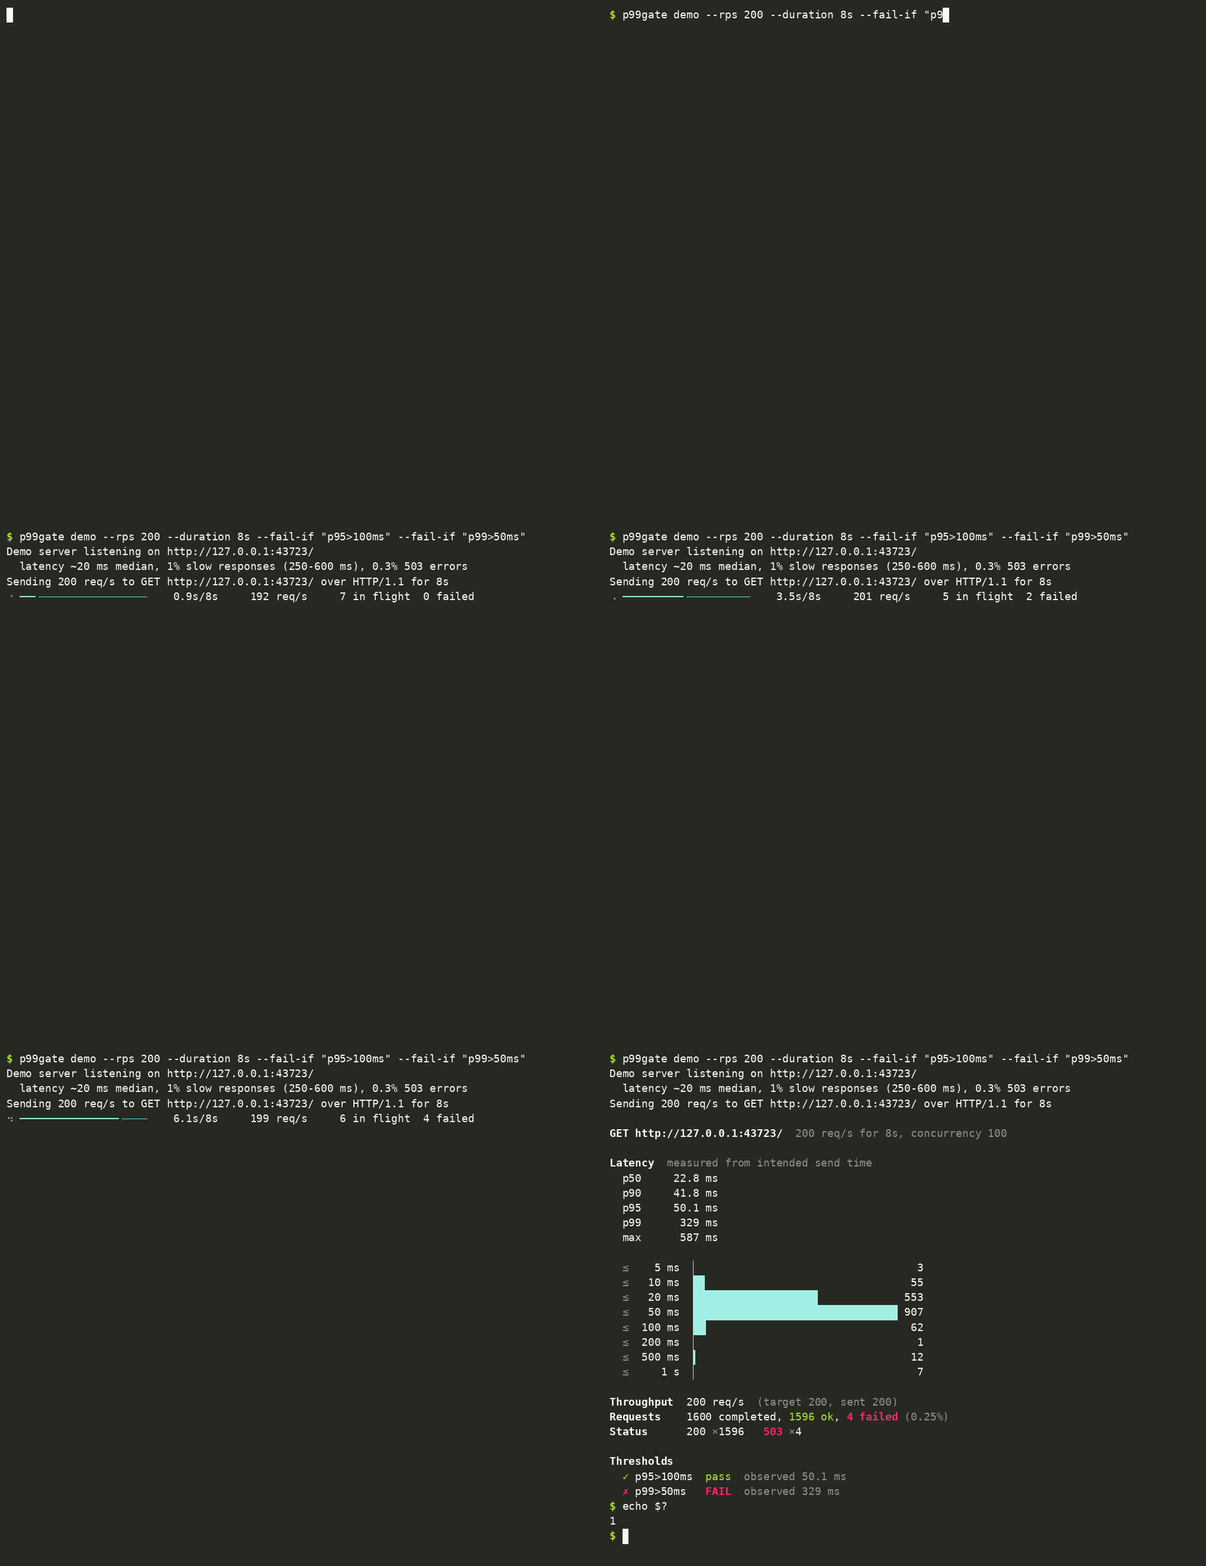
This is the real output of p99gate demo --fail-if "p99>250ms" --fail-if "error_rate>1%"
against the built-in demo server, which answers in about 20 ms but sends 1% of
responses slowly (250–600 ms) and 0.3% as 503:
GET http://127.0.0.1:42743/  50 req/s for 10s, concurrency 100

Latency  measured from intended send time
  p50     23.0 ms
  p90     41.8 ms
  p95     49.7 ms
  p99      267 ms
  max      531 ms

  ≤    5 ms  ▏                                  1
  ≤   10 ms  █▎                                12
  ≤   20 ms  ████████████████▍                157
  ≤   50 ms  ████████████████████████████████ 305
  ≤  100 ms  █▊                                17
  ≤  200 ms  ▏                                  1
  ≤  500 ms  ▌                                  5
  ≤     1 s  ▏                                  2

Throughput  50 req/s  (target 50, sent 50)
Requests    500 completed, 499 ok, 1 failed (0.20%)
Status      200 ×499   503 ×1

Thresholds
  ✗ p99>250ms      FAIL  observed 267 ms
  ✓ error_rate>1%  pass  observed 0.20%
The process exited with status 1 because a threshold failed. While a run is in progress, a live line on stderr shows elapsed time, the current request rate, requests in flight and failures. It is hidden when stderr is not a terminal, so CI logs stay clean.
Why the numbers can be trusted
Most load generators send the next request only after a previous one returns. When the server stalls, they stop sending, so the stall affects only a handful of samples and the tail percentiles look far better than what users experienced. This is called coordinated omission.
p99gate avoids it:
- Open-loop schedule. Request i is due at
start + i / rps, whatever happened to earlier requests. - Latency from the intended send time. If every
--concurrencyslot is busy when a request is due, it waits, and the wait counts towards its latency. A one-second stall shows up as every request that should have been sent during that second, not as one slow sample. - No silent under-delivery. The report shows the achieved send rate and send lag (how late requests went out). If requests could not be sent, or p99 send lag exceeds 50 ms, the run is flagged as saturated and the report says so.
- HDR histograms keep every percentile accurate to 3 significant digits.
The test suite checks this with targets that freeze for a set period. It asserts that the reported p90, p99 and max match what the freeze implies, both on a simulated clock (exact) and over real sockets.
Usage
p99gate run <URL> [OPTIONS]
p99gate demo [OPTIONS]
| Option | Default | Description |
|---|---|---|
-r, --rps <N> |
50 |
Target request rate per second. |
-d, --duration <D> |
10s |
How long to send, e.g. 30s, 2m. |
-c, --concurrency <N> |
100 |
Maximum requests in flight. |
-t, --timeout <D> |
10s |
Per-request timeout. |
-X, --method <M> |
GET |
HTTP method (run only). |
-H, --header <H> |
"Name: value", repeatable (run only). |
|
-b, --body <B> |
Request body, or @file (run only). |
|
--http2 |
Use HTTP/2: ALPN for https, prior knowledge (h2c) for http. Default is HTTP/1.1. |
|
--proxy <URL> |
Send requests through this http:// proxy (run only). |
|
--no-proxy |
Ignore HTTP_PROXY / HTTPS_PROXY (run only). |
|
-o, --output <F> |
text |
text or json, written to stdout. |
--json-out <PATH> |
Also write the JSON report to a file. | |
--fail-if <COND> |
Fail the run if the condition holds. Repeatable. | |
--strict |
Fail the run if the target rate was not sustained. |
Proxies and HTTP versions
Like curl, p99gate run uses HTTP_PROXY, HTTPS_PROXY and ALL_PROXY, and
honours NO_PROXY. --proxy overrides them and --no-proxy disables them.
Credentials in the proxy URL (http://user:pass@proxy:3128) are sent as basic
auth. https targets go through a CONNECT tunnel, so TLS stays end to end.
Proxy latency is part of every measurement, so the report records the proxy
(without credentials). p99gate demo never uses a proxy.
HTTP/1.1 is the default, with up to --concurrency connections. With
--http2, all requests share one multiplexed connection. If the server's
stream limit makes requests queue, that wait counts towards latency.
Thresholds
A threshold describes the failing condition: <metric><op><value>, with >,
>=, < or <=.
| Metric | Value | Example |
|---|---|---|
p50 p75 p90 p95 p99 p999 max mean |
duration (us, ms, s) |
--fail-if "p99>300ms" |
error_rate |
percentage or ratio | --fail-if "error_rate>1%" |
rps |
completed requests per second | --fail-if "rps<450" |
A request counts as failed if it gets a transport error (timeout, connection failure) or an HTTP status of 400 or above. Failed requests are included in the latency percentiles, so timeouts make the tail worse, not better.
Exit codes
| Code | Meaning |
|---|---|
| 0 | Run completed and no threshold failed. |
| 1 | At least one --fail-if threshold failed. |
| 2 | Invalid arguments, or the run could not start. |
| 3 | --strict was set and the target rate was not sustained. |
| 130 | Interrupted with Ctrl-C (the report is still printed). |
JSON output
--output json and --json-out produce a versioned report (schema_version: 1)
with every percentile, the latency histogram, status codes, errors, send lag and
threshold results. The schema is documented in
docs/json-schema.md. Later versions will compare reports
from different runs.
Using it in CI
- run: cargo install --locked p99gate
- run: ./start-my-service.sh &
- run: p99gate run http://localhost:8080/api/items --rps 200 --duration 60s
         --fail-if "p99>250ms" --fail-if "error_rate>0.5%" --json-out p99gate.json
Load test only systems you own or have permission to test. To try the tool,
use p99gate demo.
Performance of the generator itself
A load generator is only useful while it can keep up with the target rate. p99gate reports when it cannot (see saturated above), so you never get a quiet under-delivery.
These figures come from one machine, so treat them as a rough guide only. They were measured on a laptop with an Intel Core i5-1035G1 (4 cores, 8 threads), with the p99gate generator and its demo server (~20 ms median latency) sharing that CPU, over HTTP/1.1, for 10 s per rate:
| Target rate | Achieved | p99 send lag | Generator CPU | Generator memory | Saturated |
|---|---|---|---|---|---|
| 5,000/s | 4,999/s | 2.0 ms | 0.4 cores | 14 MB | no |
| 15,000/s | 14,999/s | 2.1 ms | 1.0 cores | 41 MB | no |
| 30,000/s | 29,997/s | 2.0 ms | 2.1 cores | 64 MB | no |
| 45,000/s | 44,994/s | 5.6 ms | 2.5 cores | 118 MB | no |
| 60,000/s | 59,996/s | 102 ms | 2.7 cores | 175 MB | yes |
A 5-minute run at 5,000/s (1.5 million requests) kept memory between 15 and 18 MB, and p99 send lag stayed at 2.0 ms.
As a library
The engine is a separate library crate. It is protocol-independent: anything
that implements Executor can be driven with the same scheduling and
measurement. See the crate documentation for a runnable example.
Roadmap
Not in 0.1. The design leaves room for each of these:
- Scenario files (YAML/TOML) with multiple endpoints and weights
- Generating scenarios from OpenAPI specs
- Comparing a base branch against a PR branch in the same CI job
- A GitHub Action that posts results as a PR comment
- gRPC and WebSocket support
Contributing
See CONTRIBUTING.md for an architecture overview and good first issues.
License
Licensed under either of Apache License, Version 2.0 or MIT license, at your option.