


![]()
OpenTelemetry Jaeger (Deprecated)
WARNING As of Jaeger 1.35.0, released in Sept 2022, ingesting the OpenTelemetry Protocol (OTLP) is stable and as a result, language specific Jaeger exporters within OpenTelemetry SDKs are recommended for deprecation by the OpenTelemetry project. More information and examples of using OTLP with Jaeger can be found in Introducing native support for OpenTelemetry in Jaeger and Exporting OTLP traces to Jaeger.
The opentelemetry-jaeger crate previously contained both a Jaeger exporter and a Jaeger propagator. To prepare for the deprecation of the Jaeger exporter, the Jaeger propagator implementation has been migrated to opentelemetry-jaeger-propagator.
The 0.22.0 is the last release of the Jaeger exporter. This means that future versions of the OpenTelemetry SDK will not work with the exporter.
If you have any questions please comment on the Jaeger Deprecation Issue.
Jaeger integration for applications instrumented with OpenTelemetry. This includes a jaeger exporter and a jaeger propagator.

![]()

![]()
![]()
Overview
OpenTelemetry is a collection of tools, APIs, and SDKs used to instrument,
generate, collect, and export telemetry data (metrics, logs, and traces) for
analysis in order to understand your software's performance and behavior. This
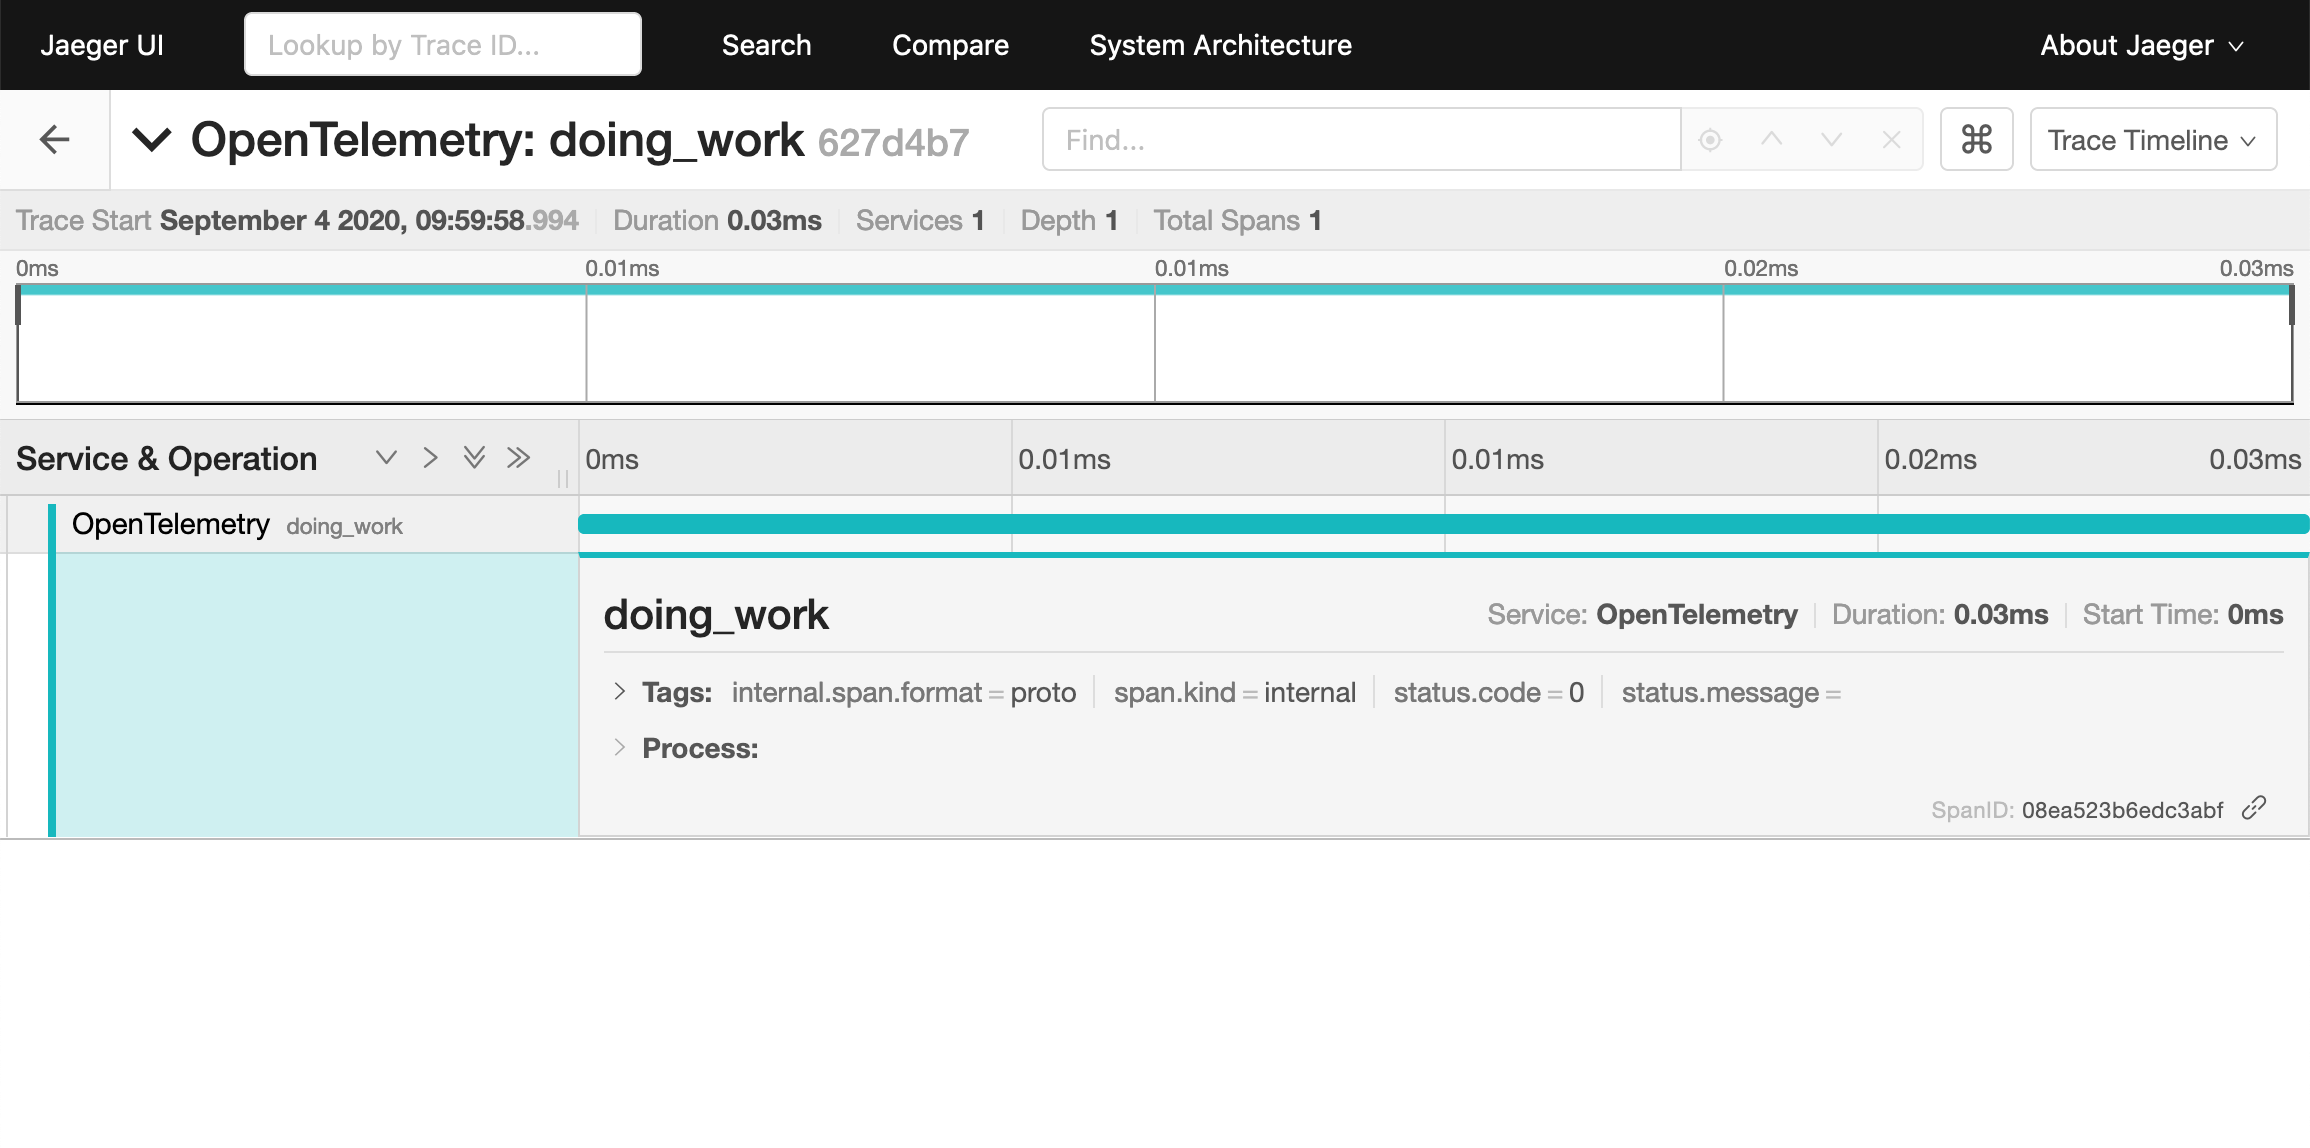
crate provides a trace pipeline and exporter for sending span information to a
Jaeger agent or collector endpoint for processing and visualization.
Compiler support: requires rustc 1.65+
Quickstart
First make sure you have a running version of the Jaeger instance you want to send data to:
$ docker run -d -p6831:6831/udp -p6832:6832/udp -p16686:16686 -p14268:14268 jaegertracing/all-in-one:latest
Then install a new jaeger pipeline with the recommended defaults to start exporting telemetry:
use global;
use Tracer;
use opentelemetry_jaeger_propagator;
Performance
For optimal performance, a batch exporter is recommended as the simple exporter
will export each span synchronously on drop. You can enable the rt-tokio,
rt-tokio-current-thread or rt-async-std features and specify a runtime
on the pipeline builder to have a batch exporter configured for you
automatically.
[]
= { = "*", = ["rt-tokio"] }
= { = "*", = ["rt-tokio"] }
let tracer = new_agent_pipeline
.install_batch?;
Jaeger Exporter From Environment Variables
The jaeger pipeline builder can be configured dynamically via environment variables. All variables are optional, a full list of accepted options can be found in the jaeger variables spec.
Jaeger Collector Example
If you want to skip the agent and submit spans directly to a Jaeger collector,
you can enable the optional collector_client feature for this crate. This
example expects a Jaeger collector running on http://localhost:14268.
[]
= { = "..", = ["isahc_collector_client"] }
Then you can use the with_collector_endpoint method to specify the endpoint:
// Note that this requires one of the following features enabled so that there is a default http client implementation
// * hyper_collector_client
// * reqwest_collector_client
// * reqwest_blocking_collector_client
// * reqwest_rustls_collector_client
// * isahc_collector_client
// You can also provide your own implementation by enable
// `collector_client` and set it with
// new_pipeline().with_http_client() method.
use Tracer;
Kitchen Sink Full Configuration
Example showing how to override all configuration options. See the
AgentPipeline docs for details of each option.
Supported Rust Versions
OpenTelemetry is built against the latest stable release. The minimum supported version is 1.65. The current OpenTelemetry version is not guaranteed to build on Rust versions earlier than the minimum supported version.
The current stable Rust compiler and the three most recent minor versions before it will always be supported. For example, if the current stable compiler version is 1.49, the minimum supported version will not be increased past 1.46, three minor versions prior. Increasing the minimum supported compiler version is not considered a semver breaking change as long as doing so complies with this policy.