# Meteostat for Rust
[](https://crates.io/crates/meteostat)
[](https://docs.rs/meteostat)
[](https://github.com/RuurdBijlsma/meteostat_rs/blob/main/LICENSE)
[](https://github.com/RuurdBijlsma/meteostat_rs)
[](https://github.com/RuurdBijlsma/meteostat_rs/actions/workflows/ci.yml)
**The Weather's Record Keeper - In Rust!**
This crate provides a convenient asynchronous Rust interface for accessing historical weather and climate data
from [Meteostat](https://meteostat.net/), leveraging their publicly available **bulk data interface**. It allows
fetching data for thousands of weather stations worldwide.
> **Meteostat is a free and open provider of weather & climate data.** They collect, process, and provide the data. This
> crate is a Rust client for their bulk API. Please consider supporting Meteostat: [**Donate to Meteostat
**](https://meteostat.net/en/patrons).
Access yesterday's temperatures or discover weather from centuries ago, directly from your Rust application.
## Features
* **Fetch by Station ID or Location:** Initiate requests via frequency-specific clients (`client.hourly()`,
`client.daily()`, etc.) and specify either `.station("ID")` or `.location(LatLon)`.
* **Find Nearby Stations:** Search for stations near coordinates using `client.find_stations()`, optionally filtering by
distance and data availability (inventory).
* **Multiple Frequencies:**
* [Hourly](https://dev.meteostat.net/bulk/hourly.html#endpoints)
* [Daily](https://dev.meteostat.net/bulk/daily.html)
* [Monthly](https://dev.meteostat.net/bulk/monthly.html)
* [Climate Normals](https://dev.meteostat.net/bulk/normals.html)
* **Efficient Data Handling with Polars:** Returns data as wrappers around [Polars](https://pola.rs/) **`LazyFrame`s** (
e.g., `HourlyLazyFrame`), enabling powerful, memory-efficient filtering and manipulation *before* collecting results.
* **Convenient Filtering:** Frame wrappers provide methods for easy filtering by date, year, month, or datetime ranges (
e.g., `daily_lazy.get_for_period(Year(2023))`).
* **Collect to Structs or `DataFrame`:** Easily convert filtered data into `Vec<Struct>` (e.g., `Vec<Hourly>`), single
`Struct`s (e.g., `Daily`), or Polars `DataFrame`s.
* **Automatic Caching:** Downloads and caches station metadata and weather data files locally to speed up subsequent
requests and reduce load on Meteostat's servers.
* **Asynchronous:** Built with `tokio` for non-blocking I/O.
## Installation
Add `meteostat` to your `Cargo.toml` dependencies:
```bash
cargo add meteostat
```
## Quick Start
Fetch hourly and daily weather data for a specific location:
```rust
use meteostat::{Meteostat, LatLon, MeteostatError, Year};
use polars::prelude::*;
use chrono::{NaiveDate};
#[tokio::main]
async fn main() -> Result<(), MeteostatError> {
let client = Meteostat::new().await?;
let location = LatLon(52.0836403, 5.1257283); // Example location
// --- Example 1: Collect 24 hourly data points for a specific date into `Vec<Hourly>` ---
let period = NaiveDate::from_ymd_opt(2023, 9, 1).unwrap();
let hourly_vec = client
.hourly()
.location(location)
.call()
.await? // Returns `HourlyLazyFrame`
.get_for_period(period)? // Filter for the specific date
.collect_hourly()?; // Collects into `Vec<Hourly>`
println!("Fetched {} hourly records.", hourly_vec.len());
if let Some(first_record) = hourly_vec.first() {
println!("First hourly record: {:?}", first_record);
}
// --- Example 2: Collect daily data for an entire year into a Polars `DataFrame` ---
let daily_df = client
.daily()
.location(location)
.call()
.await? // Returns `DailyLazyFrame`
.get_for_period(Year(2023))? // Filter for the year 2023
.frame // Access the inner Polars `LazyFrame`
.collect()?; // Collects into `polars::prelude::DataFrame`
println!("Daily data for 2023 (DataFrame):\n{}", daily_df.head(Some(3)));
Ok(())
}
```
<details>
<summary>Output</summary>
```output
Fetched 24 hourly records.
First hourly record: Hourly { datetime: 2023-09-01T00:00:00Z, temperature: Some(12.7), dew_point: Some(12.1), relative_humidity: Some(96), precipitation: Some(0.0), snow: None, wind_direction: Some(150), wind_speed: Some(7.2), peak_wind_gust: Some(9.3), pressure: Some(1011.5), sunshine_minutes: None, condition: Some(Overcast) }
Daily data for 2023 (DataFrame):
shape: (3, 11)
┌────────────┬──────┬──────┬──────┬───┬──────┬──────┬────────┬──────┐
│ date ┆ tavg ┆ tmin ┆ tmax ┆ … ┆ wspd ┆ wpgt ┆ pres ┆ tsun │
│ --- ┆ --- ┆ --- ┆ --- ┆ ┆ --- ┆ --- ┆ --- ┆ --- │
│ date ┆ f64 ┆ f64 ┆ f64 ┆ ┆ f64 ┆ f64 ┆ f64 ┆ i64 │
╞════════════╪══════╪══════╪══════╪═══╪══════╪══════╪════════╪══════╡
│ 2023-01-01 ┆ 12.6 ┆ 10.4 ┆ 15.6 ┆ … ┆ 20.1 ┆ 53.7 ┆ 1011.1 ┆ null │
│ 2023-01-02 ┆ 9.1 ┆ 4.3 ┆ 12.8 ┆ … ┆ 12.6 ┆ 27.8 ┆ 1014.9 ┆ null │
│ 2023-01-03 ┆ 6.1 ┆ 1.1 ┆ 9.1 ┆ … ┆ 14.0 ┆ 44.5 ┆ 1024.3 ┆ null │
└────────────┴──────┴──────┴──────┴───┴──────┴──────┴────────┴──────┘
```
</details>
*(See more examples in the [examples directory](https://github.com/RuurdBijlsma/meteostat_rs/tree/main/examples),
including how to fetch by Station ID.)*
## Key Concepts
### Finding Stations
You can search for weather stations near a specific geographical location. This is useful when you don't know the exact
station ID.
```rust
use meteostat::{Meteostat, MeteostatError, LatLon, InventoryRequest, Frequency, RequiredData};
#[tokio::main]
async fn main() -> Result<(), MeteostatError> {
let client = Meteostat::new().await?;
let nyc = LatLon(40.7128, -74.0060);
// Find the 3 closest stations within 100km of NYC
// that have reported *any* Daily data.
let inventory_req = InventoryRequest::new(Frequency::Daily, RequiredData::Any);
let stations = client.find_stations()
.location(nyc)
.max_distance_km(100.0)
.station_limit(3)
.inventory_request(inventory_req)
.call()
.await?;
println!("Found {} stations near NYC matching criteria:", stations.len());
for result in stations {
println!(" - ID: {}, Name: {:?}, Distance: {:.1}km",
result.station.id,
result.station.name.get("en"),
result.distance_km
);
}
Ok(())
}
```
<details>
<summary>Output</summary>
```output
Found 3 stations near NYC matching criteria:
- ID: KJRB0, Name: Some("New York / Wall Street"), Distance: 1.3km
- ID: 72502, Name: Some("Newark Airport"), Distance: 3.3km
- ID: KNYC0, Name: Some("New York City / Yorkville"), Distance: 8.0km
```
</details>
Once you have a station ID (e.g., from `stations.first().unwrap().station.id`), you can use it with
`.station(&station_id)` instead of `.location(LatLon)` in your data requests.
### Working with Data: LazyFrames, Filtering, and Collection
All weather data fetching methods (e.g., `client.daily().station("ID").call().await?`) return a specific wrapper struct
like `DailyLazyFrame`, `HourlyLazyFrame`, etc. These wrappers contain a Polars `LazyFrame`.
This design allows you to:
1. **Apply Filters Lazily:** Use methods on the wrapper (e.g., `get_for_period()`, `get_range()`, `get_at()`) to define
filtering operations. These operations build up a query plan but don't execute immediately, saving memory and
computation.
* `get_for_period(Year(2023))`: Get data for a whole year.
* `get_for_period(NaiveDate::from_ymd_opt(2023,1,1).unwrap())`: Get data for a specific day.
* `get_range(start_datetime, end_datetime)`: Get data within a datetime range.
* `get_at(NaiveDate::from_ymd_opt(2023,1,1).unwrap())`: Get data for a single point in time.
2. **Collect Results:** After filtering, you can collect the data:
* **Into Rust Structs:**
* `collect_daily()`, `collect_hourly()`: Get a `Vec<Daily>`, `Vec<Hourly>`, etc.
* `collect_single_daily()`, `collect_single_hourly()`: Get an `Result<Daily, MeteostatError>`,
`Result<Hourly, MeteostatError>` etc.
* **Into a Polars `DataFrame`:** Access the underlying `LazyFrame` via the `.frame` field and then call
`.collect()?` for advanced analysis with Polars.
**Example: Fetching a Single Day's Record into a Struct**
```rust
use chrono::NaiveDate;
use serde_json::to_string_pretty;
use meteostat::{LatLon, Meteostat, MeteostatError};
#[tokio::main]
async fn main() -> Result<(), MeteostatError> {
let client = Meteostat::new().await?;
let specific_date = NaiveDate::from_ymd_opt(2023, 10, 26).unwrap();
let daily_data = client
.daily()
.location(LatLon(52.520008, 13.404954))
.call()
.await? // DailyLazyFrame
.get_at(specific_date)? // Filter for the specific date
.collect_single_daily()?; // Attempt to collect a single Daily struct
let json = to_string_pretty(&daily_data).unwrap(); // Convert the struct to JSON for pretty printing
println!("{}", json);
Ok(())
}
```
<details>
<summary>Output</summary>
```json
{
"date": "2023-10-26",
"average_temperature": 9.7,
"minimum_temperature": 9.2,
"maximum_temperature": 10.5,
"precipitation": null,
"snow": null,
"wind_direction": 53,
"wind_speed": 10.1,
"peak_wind_gust": 29.6,
"pressure": 994.9,
"sunshine_minutes": null
}
```
</details>
Refer to the documentation for `HourlyLazyFrame`, `DailyLazyFrame`, `MonthlyLazyFrame`, and `ClimateLazyFrame` for all
available filtering and collection methods.
### Caching
The crate automatically caches downloaded data to minimize redundant downloads:
* **Station Metadata:** The global list of stations is downloaded once.
* **Weather Data:** Individual station data files are cached per station and frequency.
* When you request data newer than the age of the cache (with `.required_data`), the cache will automatically
refresh.
* The cache can also be manually refreshed.
Cache files are stored in your system's standard cache directory. Customize this with
`Meteostat::with_cache_folder(path)`.
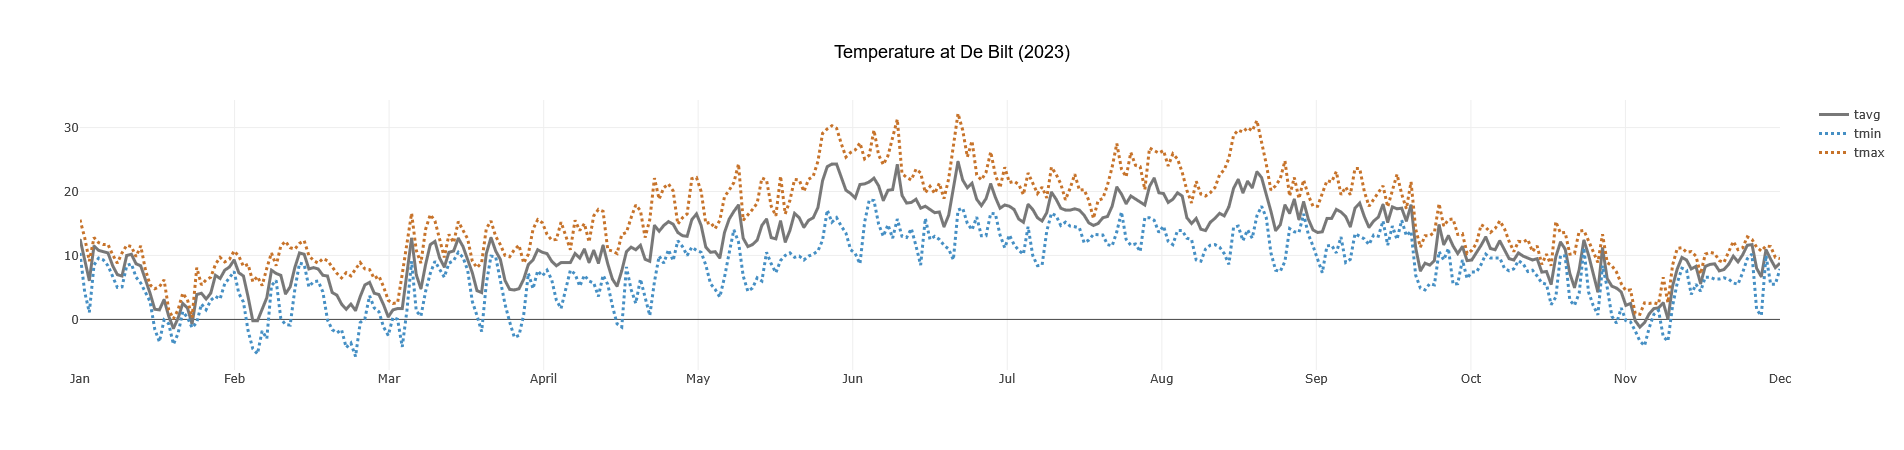
## Example: Plotting Data
You can use the `DataFrame` output with plotting libraries like `plotlars`.
```rust
// This example requires the 'plotlars' feature for the crate
// or run it directly from the examples folder:
// cargo run --example graph_data --features "examples"
use std::error::Error;
use meteostat::{LatLon, Meteostat, Year};
use plotlars::{Line, Plot, Rgb, TimeSeriesPlot};
use polars::prelude::*;
#[tokio::main]
async fn main() -> Result<(), Box<dyn Error>> {
let meteostat = Meteostat::new().await?;
let location = LatLon(52.118641, 5.185589); // De Bilt, Netherlands
let weather_data: DataFrame = meteostat
.daily()
.location(location)
.call()
.await?
.get_for_period(Year(2023))?
.frame
.collect()?;
plot_temperature(&weather_data);
Ok(())
}
fn plot_temperature(dataset: &DataFrame) {
if dataset.is_empty() {
println!("No data to plot.");
return;
}
TimeSeriesPlot::builder()
.data(dataset)
.x("date")
.y("tavg")
.additional_series(vec!["tmin", "tmax"])
.colors(vec![
Rgb(120, 120, 120), // tavg
Rgb(69, 143, 196), // tmin
Rgb(199, 115, 42), // tmax
])
.lines(vec![Line::Solid, Line::Dot, Line::Dot])
.plot_title("Temperature at De Bilt (2023)")
.build()
.plot();
println!("Plot generated/shown (behavior depends on plotlars backend).");
}
```
*(This generates a plot similar to the one at the top of this README)*
## Data Source and Attribution
* All weather data is sourced from **[Meteostat](https://meteostat.net/)**.
* This crate uses Meteostat's **free bulk data interface**. No API key is required.
## API Documentation
Full API documentation is available on [docs.rs](https://docs.rs/meteostat).
## Contributing
Contributions, bug reports, and feature requests are welcome! Please open an issue or submit a pull request on
the [GitHub repository](https://github.com/RuurdBijlsma/meteostat_rs).
## License
This crate is licensed under the Apache License 2.0. See
the [LICENSE](https://github.com/RuurdBijlsma/meteostat_rs/blob/main/LICENSE.md) file.